Financial Benefits

Income Statement Graphical Representation Template Ppt PowerPoint Presentation Model Infographic Template
This is a income statement graphical representation template ppt powerpoint presentation model infographic template. This is a four stage process. The stages in this process are revenue, cogs, operating profit, net profit.

Last 30 Days Results Ppt PowerPoint Presentation Summary Brochure
This is a last 30 days results ppt powerpoint presentation summary brochure. This is a four stage process. The stages in this process are revenue, new customers, gross profit, customer satisfaction.

Customer Lifetime Value Ppt PowerPoint Presentation Styles Gridlines
This is a customer lifetime value ppt powerpoint presentation styles gridlines. This is a three stage process. The stages in this process are inactive nonprofit able customer, active profitable customers, very active very profitable customers.

Area Stacked Ppt PowerPoint Presentation Shapes
This is a area stacked ppt powerpoint presentation shapes. This is a two stage process. The stages in this process are business, marketing, product, finance, profit.

Market Segmentation Evaluation Template 1 Ppt PowerPoint Presentation Templates
This is a market segmentation evaluation template 1 ppt powerpoint presentation templates. This is a two stage process. The stages in this process are market sale, net profit, evaluation, business, marketing.

Competitor Analysis Template Ppt PowerPoint Presentation Pictures Graphics Template
This is a competitor analysis template ppt powerpoint presentation pictures graphics template. This is a four stage process. The stages in this process are business, strategy, marketing, planning, net profit margin.
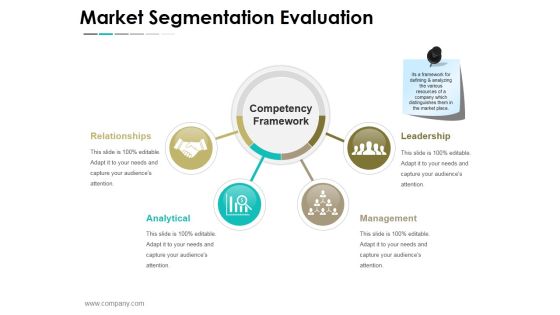
Market Segmentation Evaluation Ppt PowerPoint Presentation Layouts Images
This is a market segmentation evaluation ppt powerpoint presentation layouts images. This is a two stage process. The stages in this process are market sales, net profit, confectionary, milk products, beverages, nutrition and health care.
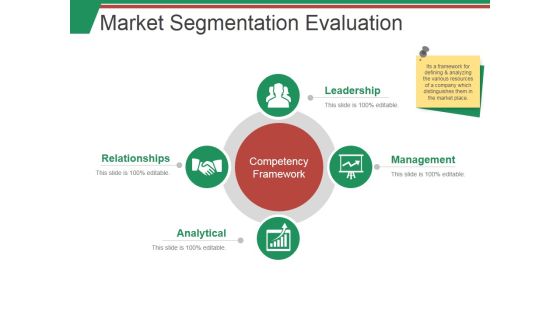
Market Segmentation Evaluation Template 1 Ppt PowerPoint Presentation Summary Smartart
This is a market segmentation evaluation template 1 ppt powerpoint presentation summary smartart. This is a two stage process. The stages in this process are market sales, net profit, beverages, milk product, nutrition.

Competitors Analysis Template Ppt PowerPoint Presentation Infographic Template Rules
This is a competitors analysis template ppt powerpoint presentation infographic template rules. This is a four stage process. The stages in this process are net profit margin, finance, marketing, bar, success.
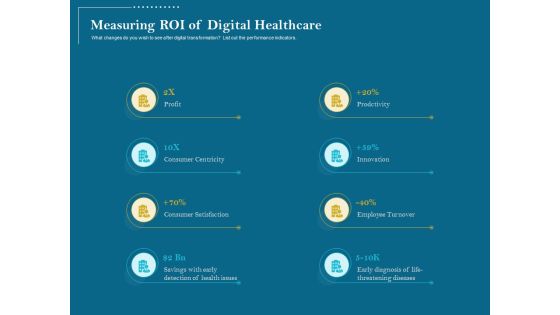
Utilizing Cyber Technology For Change Process Measuring ROI Of Digital Healthcare Formats PDF
What changes do you wish to see after digital transformation List out the performance indicators. This is a utilizing cyber technology for change process measuring roi of digital healthcare formats pdf template with various stages. Focus and dispense information on eight stages using this creative set, that comes with editable features. It contains large content boxes to add your information on topics like profit, consumer centricity, consumer satisfaction, savings with early detection of health issues, prodctivity, innovation, employee turnover, early diagnosis of life-threatening diseases. You can also showcase facts, figures, and other relevant content using this PPT layout. Grab it now.

Year Based Company Finance Growth Ppt PowerPoint Presentation Layouts
This is a year based company finance growth ppt powerpoint presentation layouts. This is a ten stage process. The stages in this process are financial result, net sales, other income, ebita, ebita margins, profit before tax, taxes, tax rate, profit after tax, pat margins.

Pandl Kpis Tabular Form Ppt PowerPoint Presentation Visual Aids
This is a pandl kpis tabular form ppt powerpoint presentation visual aids. This is a four stage process. The stages in this process are revenue, cogs, operating profit, net profit.

Profitability Ratios Template Ppt PowerPoint Presentation Topics
This is a profitability ratios template ppt powerpoint presentation topics. This is a two stage process. The stages in this process are marketing, strategy, growth, graph, business.

Competitor Analysis Competitor Revenue And Profit Growth Ppt PowerPoint Presentation Slide Download
This is a competitor analysis competitor revenue and profit growth ppt powerpoint presentation slide download. This is a five stage process. The stages in this process are business, marketing, management, finance, growth.
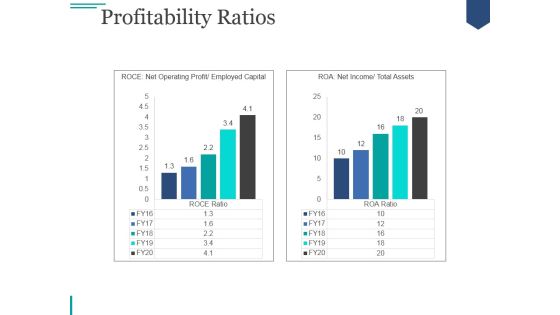
Profitability Ratios Template 2 Ppt PowerPoint Presentation Professional
This is a profitability ratios template 2 ppt powerpoint presentation professional. This is a two stage process. The stages in this process are graph, business, marketing, strategy, growth.

Pie Chart Ppt PowerPoint Presentation Visual Aids
This is a pie chart ppt powerpoint presentation visual aids. This is a five stage process. The stages in this process are pie, finance, analysis, division, percentage.

Performance Overview Ppt PowerPoint Presentation Visual Aids
This is a performance overview ppt powerpoint presentation visual aids. This is a four stage process. The stages in this process are your business, social engagement, website review, local mobile strategy, local reach.

Advantages And Disadvantages Of Invoice Matching Ppt Powerpoint Presentation Gallery Ideas
This is a advantages and disadvantages of invoice matching ppt powerpoint presentation gallery ideas. This is a six stage process. The stages in this process are accounting, three way match, three document.

Current Sources Of Revenue Ppt PowerPoint Presentation Portfolio Rules
This is a current sources of revenue ppt powerpoint presentation portfolio rules. This is a six stage process. The stages in this process are council tax, revenue support grant, retained income, other grants, local sales, others.

Customer Lifetime Value Model Powerpoint Shapes
This is a customer lifetime value model powerpoint shapes. This is a three stage process. The stages in this process are inactive nonprofit able customer, active profitable customers, very active very profitable customers.
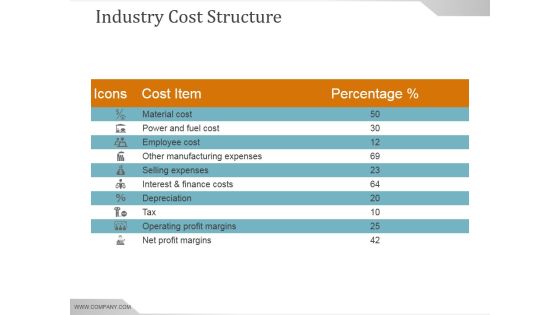
Industry Cost Structure Template Ppt PowerPoint Presentation Tips
This is a industry cost structure template ppt powerpoint presentation tips. This is a seven stage process. The stages in this process are purchases, rent and utilities, marketing, profit, depreciation, wages.

Scatter With Smooth Lines And Markers Ppt PowerPoint Presentation Show Template
This is a scatter with smooth lines and markers ppt powerpoint presentation show template. This is a nine stage process. The stages in this process are business, strategy, marketing, success, dollar in billions, profit in thousands.
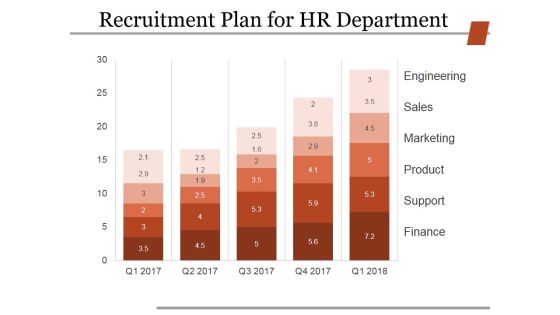
Recruitment Plan For Hr Department Ppt PowerPoint Presentation Infographic Template Design Inspiration
This is a recruitment plan for hr department ppt powerpoint presentation infographic template design inspiration. This is a five stage process. The stages in this process are engineering, sales, marketing, product, support, finance.
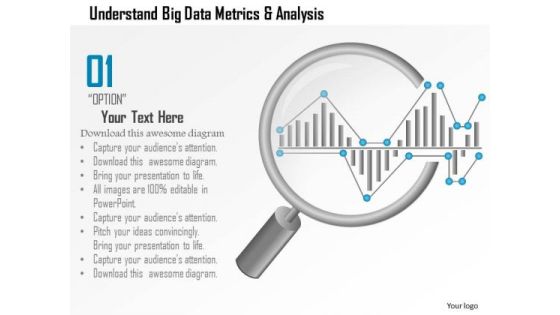
Business Diagram Understand Big Data Metrics And Analysis Showing By Magnifying Glass Ppt Slide
This PPT slide has been designed with big data metrics and magnifying glass. This diagram helps to portray concept of data analysis and data search. Download this diagram to make professional presentations.

Revenue Model Ppt PowerPoint Presentation Visual Aids
This is a revenue model ppt powerpoint presentation visual aids. This is a five stage process. The stages in this process are business, marketing, management, finance, planning.
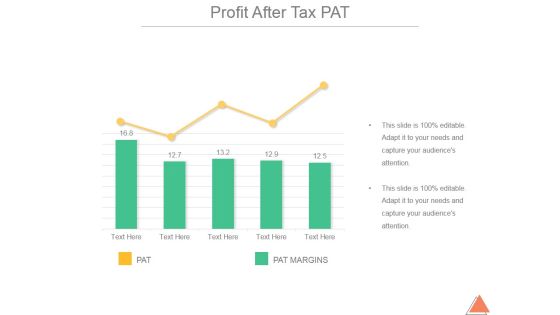
Profit After Tax Pat Ppt PowerPoint Presentation Show
This is a profit after tax pat ppt powerpoint presentation show. This is a two stage process. The stages in this process are business, marketing, management, finance, strategy.

Profitability Ratios Template 3 Ppt PowerPoint Presentation Show Graphics Download
This is a profitability ratios template 3 ppt powerpoint presentation show graphics download. This is a two stage process. The stages in this process are roce, net operating profit, employed capital, roa, net income, total assets.

Our Growth Profit Ppt PowerPoint Presentation Outline Ideas
This is a our growth profit ppt powerpoint presentation outline ideas. This is a two stage process. The stages in this process are business, marketing, success, process, targets.
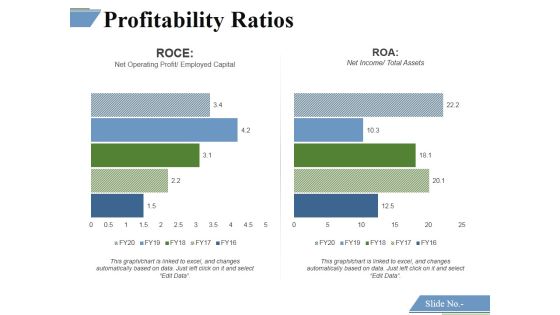
Profitability Ratios Template 5 Ppt PowerPoint Presentation Layouts Graphics Design
This is a profitability ratios template 5 ppt powerpoint presentation layouts graphics design. This is a two stage process. The stages in this process are finance, business, marketing, success, strategy.
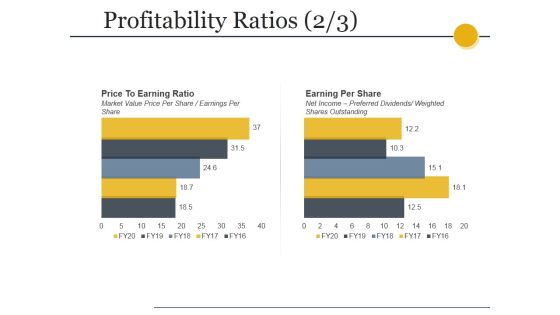
Profitability Ratios Template 2 Ppt PowerPoint Presentation Gallery Designs
This is a profitability ratios template 2 ppt powerpoint presentation gallery designs. This is a two stage process. The stages in this process are price to earning ratio, market value price per share earnings per share, earning per share, net income preferred dividends, weighted shares outstanding.

Profitability Ratios Template 4 Ppt PowerPoint Presentation Professional Deck
This is a profitability ratios template 4 ppt powerpoint presentation professional deck. This is a two stage process. The stages in this process are price to earning ratio, market value price per share earnings per share, earning per share, net income preferred dividends, weighted shares outstanding.

Conversion Rate Template 1 Ppt PowerPoint Presentation Visual Aids Files
This is a conversion rate template 1 ppt powerpoint presentation visual aids files. This is a two stage process. The stages in this process are net revenue gross revenue from last year.
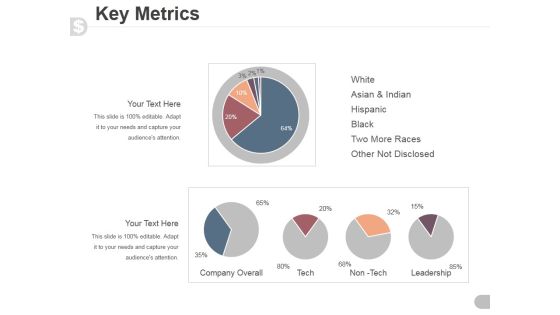
Key Metrics Ppt PowerPoint Presentation Visual Aids
This is a key metrics ppt powerpoint presentation visual aids. This is a five stage process. The stages in this process are white, asian and indian, hispanic, black, two more races, other not disclosed.

Web Traffic Insights Ppt PowerPoint Presentation Model Visual Aids
This is a web traffic insights ppt powerpoint presentation model visual aids. This is a two stage process. The stages in this process are traffic sources, engagement in, ranks in, subdomains.
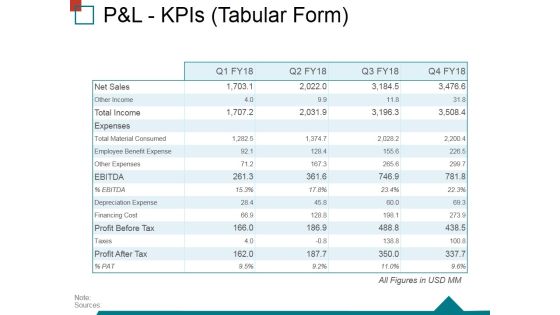
Pandl Kpis Tabular Form Ppt PowerPoint Presentation Ideas Structure
This is a pandl kpis tabular form ppt powerpoint presentation ideas structure. This is a four stage process. The stages in this process are operating profit, revenue, cogs, net profit.

Last 90 Days Results Ppt PowerPoint Presentation Introduction
This is a last 90 days results ppt powerpoint presentation introduction. This is a six stage process. The stages in this process are revenue, new customers, gross profit, sales comparison.

Bubble Chart Ppt PowerPoint Presentation Portfolio Files
This is a bubble chart ppt powerpoint presentation portfolio files. This is a five stage process. The stages in this process are profit, bubble chart, in percentage.

Clustered Bar Ppt PowerPoint Presentation Summary Design Inspiration
This is a clustered bar ppt powerpoint presentation summary design inspiration. This is a two stage process. The stages in this process are product, clustered bar, profit, business, marketing.

Stacked Line With Marker Ppt PowerPoint Presentation Ideas Themes
This is a stacked line with marker ppt powerpoint presentation ideas themes. This is a two stage process. The stages in this process are profit, stacked bar, product, business, marketing.
Market Segmentation Evaluation Ppt PowerPoint Presentation Icon Pictures
This is a market segmentation evaluation ppt powerpoint presentation icon pictures. This is a two stage process. The stages in this process are net profit, in usd millions, market sales, business, marketing.

Competitive Analysis Scatter Chart Radar Chart Ppt PowerPoint Presentation Infographics
This is a competitive analysis scatter chart radar chart ppt powerpoint presentation infographics. This is a eight stage process. The stages in this process are users interface, data import, example, pricing, support, update, tutorials, easy to use.
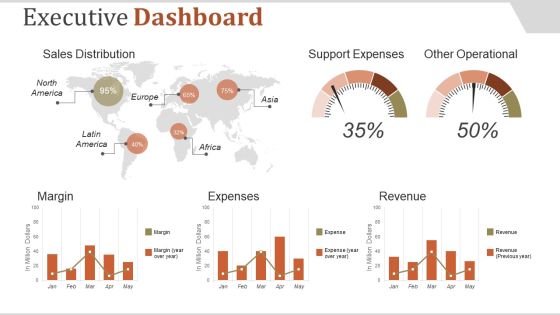
Executive Dashboard Ppt PowerPoint Presentation Introduction
This is a executive dashboard ppt powerpoint presentation introduction. This is a five stage process. The stages in this process are sales distribution, support expenses, other operational, margin, expenses.

Cost Analysis Ppt PowerPoint Presentation Inspiration Aids
This is a cost analysis ppt powerpoint presentation inspiration aids. This is a three stage process. The stages in this process are product and operation cost analysis, marketing and launch cost analysis, business and financial analysis, cost analysis.

Profitability Ratios Template 1 Ppt PowerPoint Presentation Outline Information
This is a profitability ratios template 1 ppt powerpoint presentation outline information. This is a two stage process. The stages in this process are net profit ratio, gross profit ratio, net profit after tax, net sales.
Profitability Ratios Template 1 Ppt PowerPoint Presentation Icon Example File
This is a profitability ratios template 1 ppt powerpoint presentation icon example file. This is a two stage process. The stages in this process are gross profit ratio, net profit ratio.
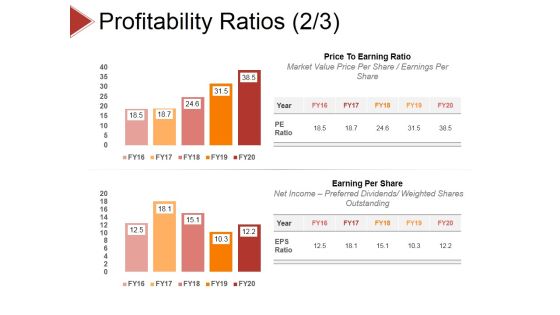
Profitability Ratios Template 3 Ppt PowerPoint Presentation Styles Slide Download
This is a profitability ratios template 3 ppt powerpoint presentation styles slide download. This is a two stage process. The stages in this process are roce, roa, net operating profit, net income.

Profitability Ratios Template 2 Ppt PowerPoint Presentation Infographics Layouts
This is a profitability ratios template 2 ppt powerpoint presentation infographics layouts. This is a two stage process. The stages in this process are price to earning ratio, earning per share, market value price per share.

Organic Visits And Backlinks Ppt PowerPoint Presentation Professional Aids
This is a organic visits and backlinks ppt powerpoint presentation professional aids. This is a two stage process. The stages in this process are rank, domain authority, backlinks.
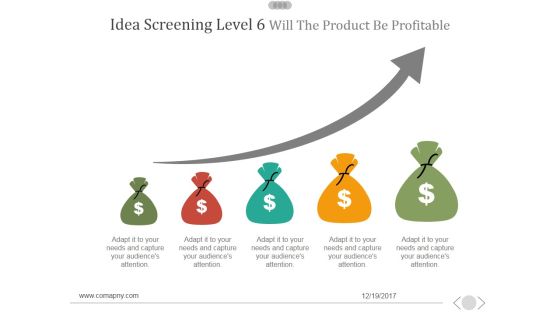
Idea Screening Level 6 Will The Product Be Profitable Ppt PowerPoint Presentation Ideas
This is a idea screening level 6 will the product be profitable ppt powerpoint presentation ideas. This is a five stage process. The stages in this process are business, marketing, success, currency, finance.
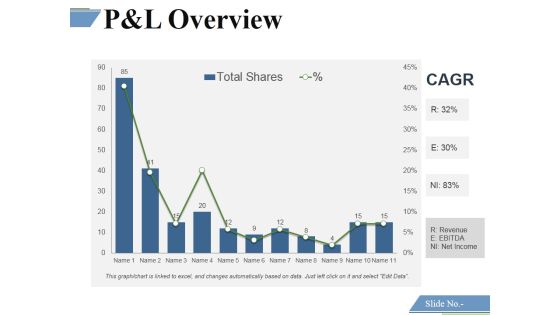
P And L Overview Template 3 Ppt PowerPoint Presentation Model Gridlines
This is a p and l overview template 3 ppt powerpoint presentation model gridlines. This is a eleven stage process. The stages in this process are financing cost, net sales, profit before tax, profit after tax.
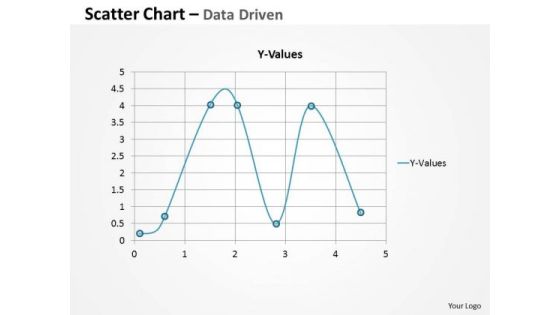
Excel Data Analysis Data Tools Data Methods Statistical Survey Driven PowerPoint Slides Templates
Ask For Assistance From Our excel data analysis data tools data methods statistical survey driven powerpoint slides Templates . You Will Be Duly Satisfied.

Development In Past 10 Years Template 1 Ppt PowerPoint Presentation Infographics
This is a development in past 10 years template 1 ppt powerpoint presentation infographics. This is a ten stage process. The stages in this process are net sales, other income, ebita margins, profit before tax, taxes.
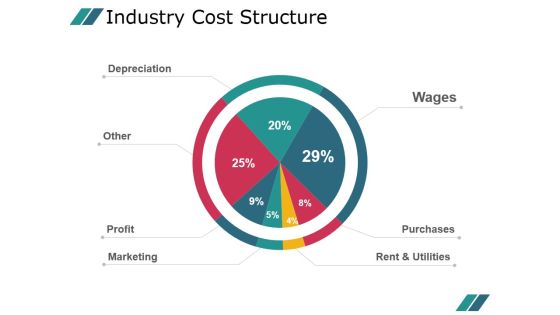
Industry Cost Structure Template 1 Ppt PowerPoint Presentation Example 2015
This is a industry cost structure template 1 ppt powerpoint presentation example 2015. This is a seven stage process. The stages in this process are wages, purchases, rent and utilities, depreciation, other, profit, marketing.
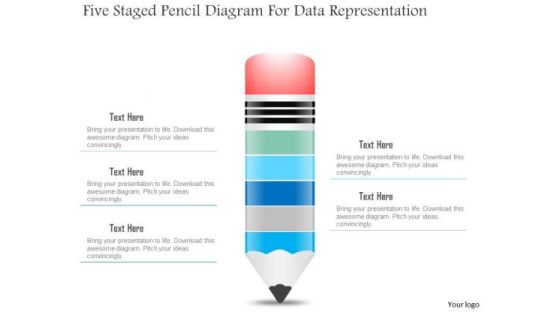
Business Diagram Five Staged Pencil Diagram For Data Representation PowerPoint Slide
This business slide displays five staged pencil diagram. It contains pencil graphic divided into five parts. This diagram slide depicts processes, stages, steps, points, options and education information display. Use this diagram, in your presentations to express your views innovatively.
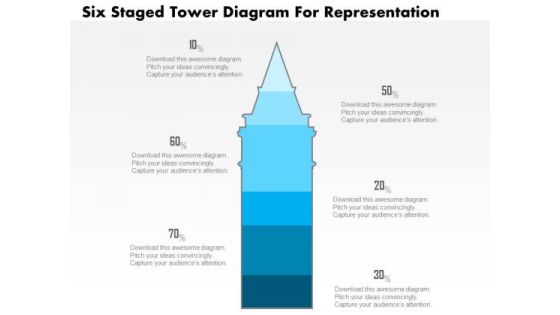
Business Diagram Five Staged Tower Diagram For Representation PowerPoint Slide
This business slide displays five staged tower diagram. It contains blue tower graphic divided into five parts. This diagram slide depicts processes, stages, steps, points, options information display. Use this diagram, in your presentations to express your views innovatively.
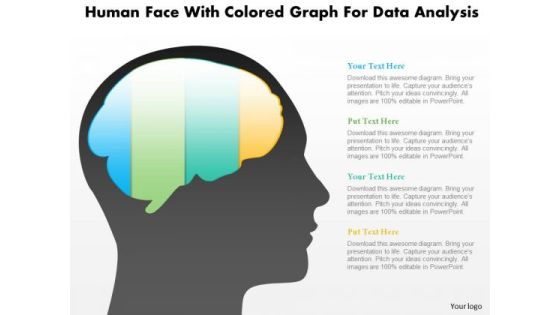
Business Diagram Human Face With Colored Graph For Data Analysis PowerPoint Slide
This diagram displays human face graphic with colored graph. This diagram can be used to represent strategy, planning, thinking of business plan. Display business options in your presentations by using this creative diagram.

Team Goals For Multiple Departments Ppt PowerPoint Presentation Infographics
This is a team goals for multiple departments ppt powerpoint presentation infographic. This is a three stage process. The stages in this process are engineering, product, marketing, sales, support, finance admin.

Hiring Plan Ppt PowerPoint Presentation Pictures Graphic Images
This is a hiring plan ppt powerpoint presentation pictures graphic images. This is a five stage process. The stages in this process are engineering, sales, marketing, product, support, finance.

Data Analysis In Excel Area Chart For Business Process PowerPoint Templates
Your Grasp Of Economics Is Well Known. Help Your Audience Comprehend Issues With Our data analysis in excel area chart for business process Powerpoint Templates .

Multivariate Data Analysis Numeric Values Surface Chart PowerPoint Templates
Your Grasp Of Economics Is Well Known. Help Your Audience Comprehend Issues With Our multivariate data analysis numeric values surface chart Powerpoint Templates .

 Home
Home