Financial Benefits

Circle Diagram For Business Marketing Mix Powerpoint Slides
This PowerPoint template has been designed with nine steps circle chart. This PPT slide can be used to prepare presentations for profit growth report and also for financial data analysis. You can download finance PowerPoint template to prepare awesome presentations.

Human Hand Holding Dollar Note Powerpoint Templates
Use this PowerPoint template, in your corporate presentations. It contains graphics of human hand holding dollar note. This slide is 100 percent editable. This business slide may be used to exhibit financial planning. Make wonderful presentations using this diagram.

Bar Graph With Five Icons Powerpoint Slides
This PowerPoint slide contains diagram bar graph with icons. This PPT slide helps to exhibit concepts of financial deal and planning. Use this business slide to make impressive presentations.

Three Tags With Magnifier For Competitive Advantages Powerpoint Slides
This PowerPoint template has been designed with diagram of three tags with magnifier. This PPT slide can be used to prepare presentations for financial planning. You can download finance PowerPoint template to prepare awesome presentations.

Best Practices Increase Revenue Out Indirect Channel Characteristics With Impact On Product Pictures PDF
Deliver an awe inspiring pitch with this creative best practices increase revenue out indirect channel characteristics with impact on product pictures pdf bundle. Topics like characteristics, product strategy, cost or benefits can be discussed with this completely editable template. It is available for immediate download depending on the needs and requirements of the user.

Promotional Channels And Action Plan For Increasing Revenues Channel Characteristics With Impact On Product Formats PDF
Deliver an awe inspiring pitch with this creative promotional channels and action plan for increasing revenues channel characteristics with impact on product formats pdf bundle. Topics like characteristics, product strategy, cost or benefits can be discussed with this completely editable template. It is available for immediate download depending on the needs and requirements of the user.

Unconventional Source Of Real Estate Finance Venture Capital Backed Company Loans Ppt Slides Backgrounds PDF
Deliver an awe inspiring pitch with this creative unconventional source of real estate finance venture capital backed company loans ppt slides backgrounds pdf bundle. Topics like key benefits of venture capital backed, expansion opportunity, personal assets dont need to be pledged can be discussed with this completely editable template. It is available for immediate download depending on the needs and requirements of the user.

Area Chart Ppt PowerPoint Presentation Icon Aids
This is a area chart ppt powerpoint presentation icon aids. This is a three stage process. The stages in this process are financial years, sales in percentage, business, marketing, graph.

Bar Chart Ppt PowerPoint Presentation Visual Aids Diagrams
This is a bar chart ppt powerpoint presentation visual aids diagrams. This is a two stage process. The stages in this process are business, marketing, financial years, sales in percentage, graph.
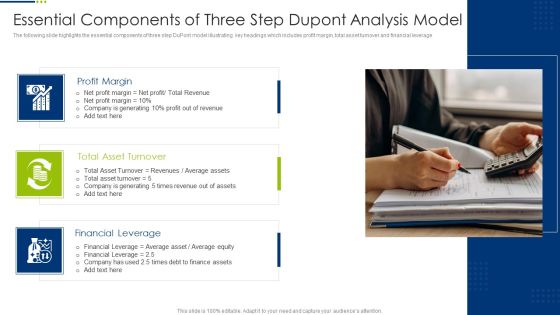
Essential Components Of Three Step Dupont Analysis Model Diagrams PDF
The following slide highlights the essential components of three step DuPont model illustrating key headings which includes profit margin, total asset turnover and financial leverage. Presenting Essential Components Of Three Step Dupont Analysis Model Diagrams PDF to dispense important information. This template comprises three stages. It also presents valuable insights into the topics including Profit Margin, Total Asset Turnover, Financial Leverage. This is a completely customizable PowerPoint theme that can be put to use immediately. So, download it and address the topic impactfully.

Quarterly Revenue And Loss Statement Comparison Dashboard Portrait PDF
This slide showcases a comprehensive P and L report for representing the financial outcomes. It also helps to take financial performance management decisions. It includes financial analysis KPIs such as p and l statements, p and l structure dynamics, sales or margin quality performance analysis, DUPONT ratio, etc. Showcasing this set of slides titled Quarterly Revenue And Loss Statement Comparison Dashboard Portrait PDF. The topics addressed in these templates are Profitability, Debt Coverage Ratios, Margin Quality Performa. All the content presented in this PPT design is completely editable. Download it and make adjustments in color, background, font etc. as per your unique business setting.

Various Solutions For Effective Project Budget Planning Pictures PDF
This slide covers project and financial management solution which helps in managing income and expenses. It also includes strategic alignment, process automation, financial management and value realization. Presenting various solutions for effective project budget planning pictures pdf to dispense important information. This template comprises four stages. It also presents valuable insights into the topics including strategic alignment, process automation, financial management, value realization. This is a completely customizable PowerPoint theme that can be put to use immediately. So, download it and address the topic impactfully.

Four Step Project Management Process For Budget Planning Sample PDF
This slide covers four steps for financial planning of a project which will helps project leaders in effective implementation of project. It also include develop financial goals, identify alternative actions, implementation of action plan and review and revise plan. Presenting four step project management process for budget planning sample pdf to dispense important information. This template comprises four stages. It also presents valuable insights into the topics including develop financial goals, identify alternative actions, implementation of action plan, review and revise plan. This is a completely customizable PowerPoint theme that can be put to use immediately. So, download it and address the topic impactfully.

Important Factors For Purchasing Existing Business Sample PDF
This slide includes various prospects that helps to analyse financial and overall position of purchased business. It includes various aspects such as check financial statements, tax records, sale reasons, legal rights, competitors etc. Showcasing this set of slides titled Important Factors For Purchasing Existing Business Sample PDF. The topics addressed in these templates are Financial Statements, Tax Records, Sale Reasons, Legal Rights Obligations, Competitors, Customers And Suppliers. All the content presented in this PPT design is completely editable. Download it and make adjustments in color, background, font etc. as per your unique business setting.
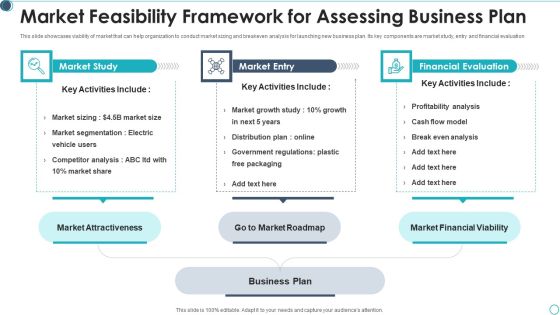
Market Feasibility Framework For Assessing Business Plan Brochure PDF
This slide showcases viability of market that can help organization to conduct market sizing and breakeven analysis for launching new business plan. Its key components are market study, entry and financial evaluation Presenting market feasibility framework for assessing business plan brochure pdf to dispense important information. This template comprises three stages. It also presents valuable insights into the topics including key activities include, financial evaluation, market financial viability This is a completely customizable PowerPoint theme that can be put to use immediately. So, download it and address the topic impactfully.
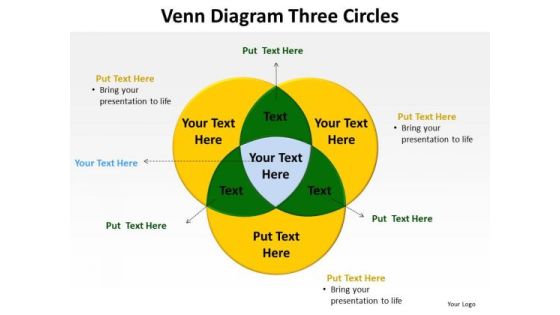
PowerPoint Backgrounds Chart Venn Diagram Ppt Design
PowerPoint Backgrounds Chart Venn Diagram PPT Design-The Venn graphic comprising interlinking circles geometrically demonstrate how various functions operating independently, to a large extent, are essentially interdependent. Amplify on this basic corporate concept and forefront the benefits of overlapping processes to arrive at common goals.-Background, Black, Blue, Business, Chart, Circle, Diagram, Drop, Financial, Green, Icon, Isolated, Overlapping, Process, Red, Round, Shadow, Shape, Three, Transparency, Vector, Venn, White
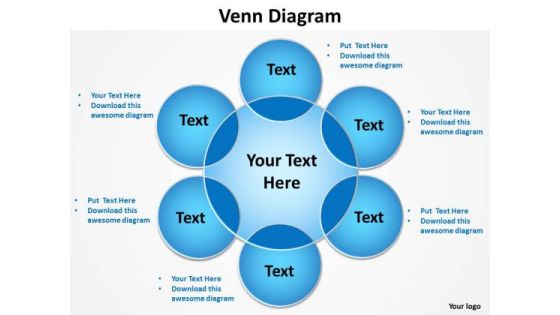
PowerPoint Backgrounds Marketing Venn Diagram Ppt Slide
PowerPoint Backgrounds Marketing Venn Diagram PPT Slide-The Venn graphic comprising interlinking circles geometrically demonstrate how various functions operating independently, to a large extent, are essentially interdependent. Amplify on this basic corporate concept and forefront the benefits of overlapping processes to arrive at common goals.-Background, Black, Blue, Business, Chart, Circle, Diagram, Drop, Financial, Green, Icon, Isolated, Overlapping, Process, Red, Round, Shadow, Shape, Three, Transparency, Vector, Venn, White
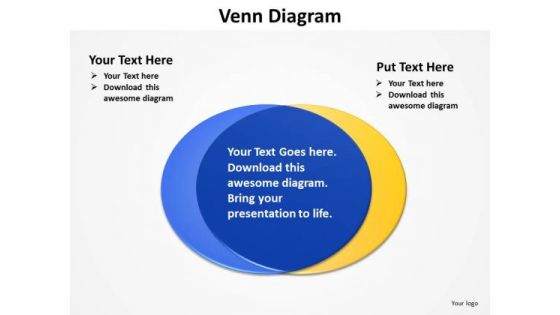
PowerPoint Backgrounds Process Venn Diagram Ppt Template
PowerPoint Backgrounds Process Venn Diagram PPT Template-The Venn graphic comprising interlinking circles geometrically demonstrate how various functions operating independently, to a large extent, are essentially interdependent. Amplify on this basic corporate concept and forefront the benefits of overlapping processes to arrive at common goals.-Background, Black, Blue, Business, Chart, Circle, Diagram, Drop, Financial, Green, Icon, Isolated, Overlapping, Process, Red, Round, Shadow, Shape, Three, Transparency, Vector, Venn, White

PowerPoint Backgrounds Strategy Venn Diagram Ppt Template
PowerPoint Backgrounds Strategy Venn Diagram PPT Template-The Venn graphic comprising interlinking circles geometrically demonstrate how various functions operating independently, to a large extent, are essentially interdependent. Amplify on this basic corporate concept and forefront the benefits of overlapping processes to arrive at common goals.-Background, Black, Blue, Business, Chart, Circle, Diagram, Drop, Financial, Green, Icon, Isolated, Overlapping, Process, Red, Round, Shadow, Shape, Three, Transparency, Vector, Venn, White
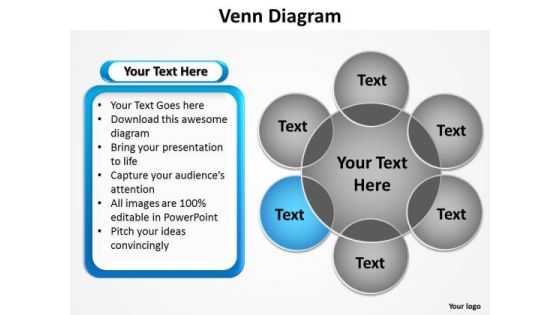
PowerPoint Design Process Venn Diagram Ppt Themes
PowerPoint Design Process Venn Diagram PPT Themes-The Venn graphic comprising interlinking circles geometrically demonstrate how various functions operating independently, to a large extent, are essentially interdependent. Amplify on this basic corporate concept and forefront the benefits of overlapping processes to arrive at common goals.-Background, Black, Blue, Business, Chart, Circle, Diagram, Drop, Financial, Green, Icon, Isolated, Overlapping, Process, Red, Round, Shadow, Shape, Three, Transparency, Vector, Venn, White

PowerPoint Design Slides Process Venn Diagram Ppt Backgrounds
PowerPoint Design Slides Process Venn Diagram PPT Backgrounds-The Venn graphic comprising interlinking circles geometrically demonstrate how various functions operating independently, to a large extent, are essentially interdependent. Amplify on this basic corporate concept and forefront the benefits of overlapping processes to arrive at common goals.-Background, Black, Blue, Business, Chart, Circle, Diagram, Drop, Financial, Green, Icon, Isolated, Overlapping, Process, Red, Round, Shadow, Shape, Three, Transparency, Vector, Venn, White
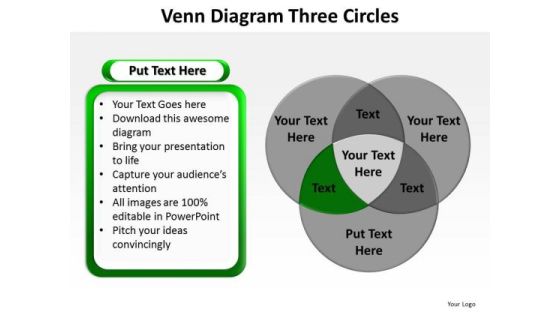
PowerPoint Design Success Venn Diagram Ppt Slides
PowerPoint Design Success Venn Diagram PPT Slides-The Venn graphic comprising interlinking circles geometrically demonstrate how various functions operating independently, to a large extent, are essentially interdependent. Amplify on this basic corporate concept and forefront the benefits of overlapping processes to arrive at common goals.-Background, Black, Blue, Business, Chart, Circle, Diagram, Drop, Financial, Green, Icon, Isolated, Overlapping, Process, Red, Round, Shadow, Shape, Three, Transparency, Vector, Venn, White
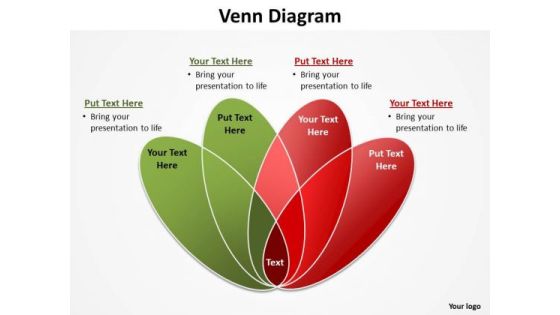
PowerPoint Designs Success Venn Diagram Ppt Design
PowerPoint Designs Success Venn Diagram PPT Design-The Venn graphic comprising interlinking circles geometrically demonstrate how various functions operating independently, to a large extent, are essentially interdependent. Amplify on this basic corporate concept and forefront the benefits of overlapping processes to arrive at common goals.-Background, Black, Blue, Business, Chart, Circle, Diagram, Drop, Financial, Green, Icon, Isolated, Overlapping, Process, Red, Round, Shadow, Shape, Three, Transparency, Vector, Venn, White

PowerPoint Layout Company Venn Diagram Ppt Theme
PowerPoint Layout Company Venn Diagram PPT Theme-The Venn graphic comprising interlinking circles geometrically demonstrate how various functions operating independently, to a large extent, are essentially interdependent. Amplify on this basic corporate concept and forefront the benefits of overlapping processes to arrive at common goals.-Background, Black, Blue, Business, Chart, Circle, Diagram, Drop, Financial, Green, Icon, Isolated, Overlapping, Process, Red, Round, Shadow, Shape, Three, Transparency, Vector, Venn, White
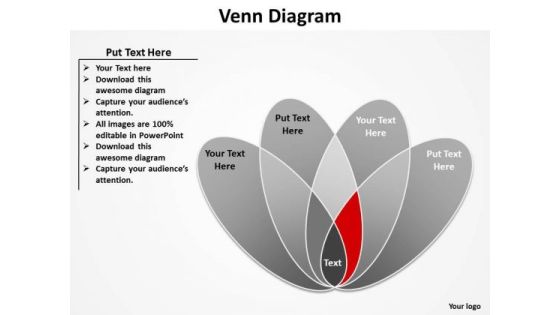
PowerPoint Layout Editable Venn Diagram Ppt Design
PowerPoint Layout Editable Venn Diagram PPT Design-The Venn graphic comprising interlinking circles geometrically demonstrate how various functions operating independently, to a large extent, are essentially interdependent. Amplify on this basic corporate concept and forefront the benefits of overlapping processes to arrive at common goals.-Background, Black, Blue, Business, Chart, Circle, Diagram, Drop, Financial, Green, Icon, Isolated, Overlapping, Process, Red, Round, Shadow, Shape, Three, Transparency, Vector, Venn, White

PowerPoint Layout Education Venn Diagram Ppt Slide Designs
PowerPoint Layout Education Venn Diagram PPT Slide Designs-The Venn graphic comprising interlinking circles geometrically demonstrate how various functions operating independently, to a large extent, are essentially interdependent. Amplify on this basic corporate concept and forefront the benefits of overlapping processes to arrive at common goals.-Background, Black, Blue, Business, Chart, Circle, Diagram, Drop, Financial, Green, Icon, Isolated, Overlapping, Process, Red, Round, Shadow, Shape, Three, Transparency, Vector, Venn, White
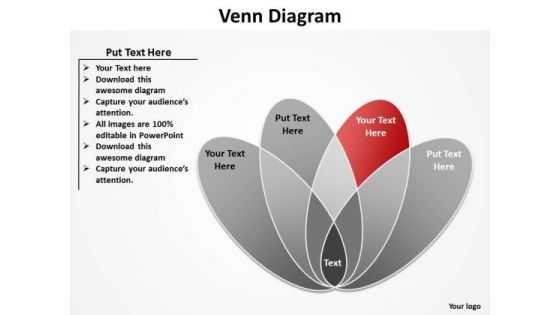
PowerPoint Layout Global Venn Diagram Ppt Backgrounds
PowerPoint Layout Global Venn Diagram PPT Backgrounds-The Venn graphic comprising interlinking circles geometrically demonstrate how various functions operating independently, to a large extent, are essentially interdependent. Amplify on this basic corporate concept and forefront the benefits of overlapping processes to arrive at common goals.-Background, Black, Blue, Business, Chart, Circle, Diagram, Drop, Financial, Green, Icon, Isolated, Overlapping, Process, Red, Round, Shadow, Shape, Three, Transparency, Vector, Venn, White
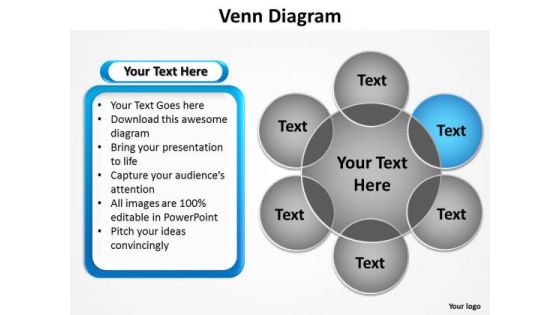
PowerPoint Layouts Company Venn Diagram Ppt Design
PowerPoint Layouts Company Venn Diagram PPT Design-The Venn graphic comprising interlinking circles geometrically demonstrate how various functions operating independently, to a large extent, are essentially interdependent. Amplify on this basic corporate concept and forefront the benefits of overlapping processes to arrive at common goals.-Background, Black, Blue, Business, Chart, Circle, Diagram, Drop, Financial, Green, Icon, Isolated, Overlapping, Process, Red, Round, Shadow, Shape, Three, Transparency, Vector, Venn, White

Stock Trading Advice News And Analytics Ppt Powerpoint Presentation Show Design Inspiration
This is a stock trading advice news and analytics ppt powerpoint presentation show design inspiration. This is a three stage process. The stages in this process are stock market, financial market, bull market.

Competitive Advantage Ppt PowerPoint Presentation Infographics Deck
This is a competitive advantage ppt powerpoint presentation infographics deck. This is a three stage process. The stages in this process are maintain the advantage, additional investment costs, project planning, high financial budget.

Competitive Advantage Ppt PowerPoint Presentation Inspiration Portfolio
This is a competitive advantage ppt powerpoint presentation inspiration portfolio. This is a three stage process. The stages in this process are advantage, additional investment costs, project planning, high financial budget, competitors who could catch up.
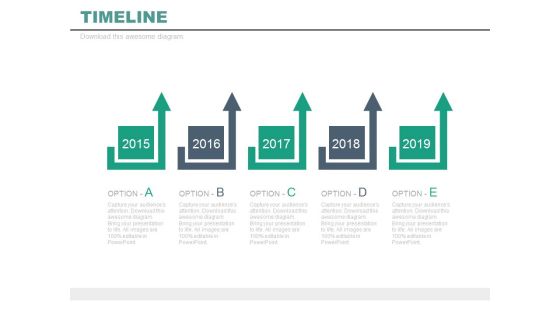
Five Options Timeline For Marketing Plan Powerpoint Slides
This five years timeline template can be used to display marketing plan. This PPT slide may be helpful to display financial strategy and timeline. Download this PowerPoint timeline template to make impressive presentations.

Competitive Advantage In Marketing Powerpoint Presentation
This is a competitive advantage in marketing powerpoint presentation. This is a six stage process. The stages in this process are sustainable competitive advantage, marketing strategy, operations strategy, innovation strategy, human resource strategy, financial strategy.

Competitive Advantage Ppt PowerPoint Presentation Professional Clipart Images
This is a competitive advantage ppt powerpoint presentation professional clipart images. This is a two stage process. The stages in this process are competitor, reason, project planning, high financial budget.
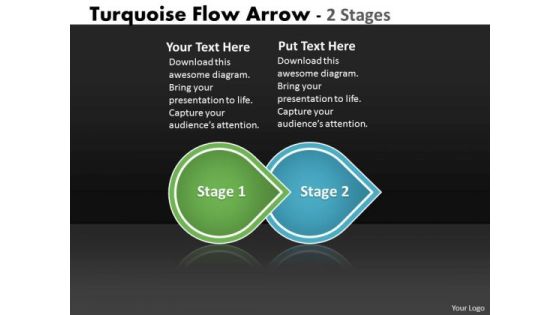
Ppt Theme Beeline Two Phase Diagram Arrow Ishikawa PowerPoint Template 1 Design
We present our PPT Theme beeline two phase diagram arrow ishikawa PowerPoint template 1 design. Use our Arrows PowerPoint Templates because; Use them to help you organize the logic of your views. Use our Symbol PowerPoint Templates because; unravel the desired and essential elements of your overall strategy. Use our Business PowerPoint Templates because; emphasize the benefits of healthy food habits and lifestyles in respect of vital organs of the human anatomy. Use our Process and Flows PowerPoint Templates because; illustrate your plans on using the many social media modes available to inform society at large of the benefits of your product. Use our Marketing PowerPoint Templates because; Take your team along by explaining your plans. Use these PowerPoint slides for presentations relating to Arrows, Background, Business, Chart, Circle, Circular, Financial, Flow, Graphic, Gray, Icon, Illustration, Isometric, Leadership, Marketing, Perspective, Process, Recycle, Round, Shape, Steps. The prominent colors used in the PowerPoint template are Green, Blue, and White
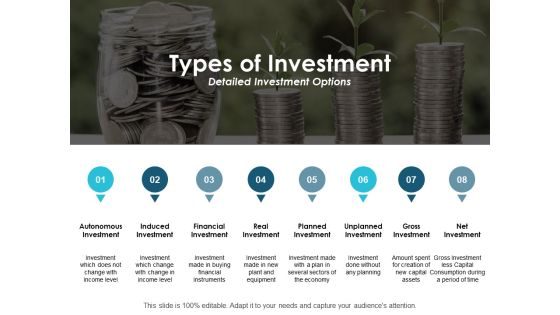
Types Of Investment Detailed Investment Options Ppt PowerPoint Presentation Pictures Graphics Tutorials
This is a types of investment detailed investment options ppt powerpoint presentation pictures graphics tutorials. This is a eight stage process. The stages in this process are financial investment, planned investment, gross investment, induced investment, process.

Statement Of Profit And Loss Layout Example Of Ppt Presentation
This is a statement of profit and loss layout example of ppt presentation. This is a six stage process. The stages in this process are financial statement, income statement, balance sheet, statement of cash flow, equity, cash flow.
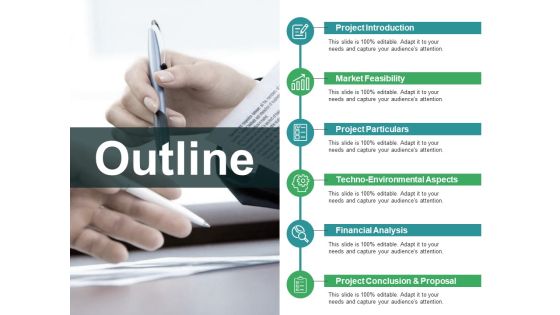
Outline Ppt PowerPoint Presentation Model Visual Aids
This is a outline ppt powerpoint presentation model visual aids. This is a six stage process. The stages in this process are project introduction, market feasibility, project particulars, financial analysis.

Business Man With Binocular For Profit Vision Powerpoint Template
This PPT slide has been designed with graphics of business man looking into binoculars. Download this diagram to portray concepts like financial planning. This slide is innovatively designed to highlight your worthy view.
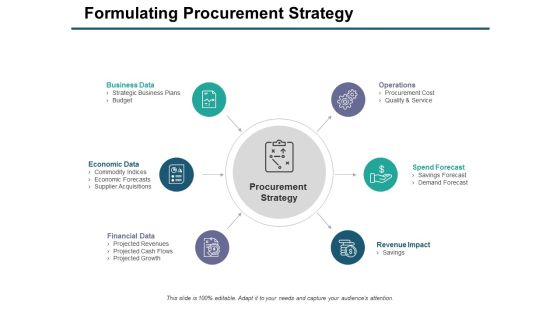
Formulating Procurement Strategy Ppt PowerPoint Presentation Model Visual Aids
This is a formulating procurement strategy ppt powerpoint presentation model visual aids. This is a six stage process. The stages in this process are business data, operations, revenue impact, financial data, economic data.

Business Performance Ppt PowerPoint Presentation Professional Visual Aids
This is a business performance ppt powerpoint presentation professional visual aids. This is a four stage process. The stages in this process are business, business highlights, financial summary, revenue split by geography, revenue split by products segment.

Law Practice Tips Layout Ppt Samples Download
This is a law practice tips layout ppt samples download. This is a three stage process. The stages in this process are legal advice, method of resolution, financial disclosure, result.

Management Team Template 6 Ppt PowerPoint Presentation Show Aids
This is a management team template 6 ppt powerpoint presentation show aids. This is a six stage process. The stages in this process are mary clark, john smith, charly doe, graphic designer, financial advisor.

Cost Analysis Ppt PowerPoint Presentation Infographics Visual Aids
This is a cost analysis ppt powerpoint presentation infographics visual aids. This is a three stage process. The stages in this process are product and operation cost analysis, marketing and launch cost analysis, business and financial analysis.

Column Chart Ppt PowerPoint Presentation Slides Visual Aids
This is a column chart ppt powerpoint presentation slides visual aids. This is a six stage process. The stages in this process are bar graph, growth, success, sales in percentage, financial year.

Investment Planning Factors Economy Trade Profit Ppt PowerPoint Presentation Ideas Slide
This is a investment planning factors economy trade profit ppt powerpoint presentation ideas slide. This is a eight stage process. The stages in this process are financial management, wealth management, investment management.

Economic Empowerment And Enforcement Example Ppt Slides
This is a economic empowerment and enforcement example ppt slides. This is a four stage process. The stages in this process are education and training, financial assistance, career planning, mentors networking.
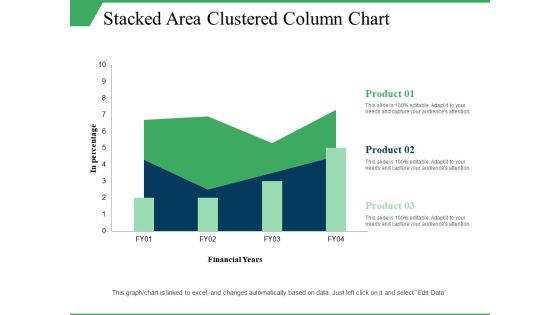
Stacked Area Clustered Column Chart Ppt PowerPoint Presentation Visual Aids Model
This is a stacked area clustered column chart ppt powerpoint presentation visual aids model. This is a three stage process. The stages in this process are in percentage, product, financial years, growth, column chart.

Business Necessity Capabilities Powerpoint Slides Rules
This is a business necessity capabilities powerpoint slides rules. This is a six stage process. The stages in this process are greater financial impact, strategic support capabilities, advantage capabilities, greater strategic, essential capabilities, business necessity capabilities.
Stock Market Analysis Magnifying Glass Over Bar Graph And Dollar Sign Ppt PowerPoint Presentation Icon Visual Aids
This is a stock market analysis magnifying glass over bar graph and dollar sign ppt powerpoint presentation icon visual aids. This is a four stage process. The stages in this process are stock market, financial markets, bull market.

Business Capital Plan Venture Example Of Ppt Presentation
This is a business capital plan venture example of ppt presentation. This is a five stage process. The stages in this process are proposal size, financial projections, competitive advantage, company management, investment recovery.

Administrative Management Powerpoint Guide
This is a administrative management powerpoint guide. This is a four stage process. The stages in this process are credit and assurance, internal risk management and mitigation, administrative management, federal financial assistance.
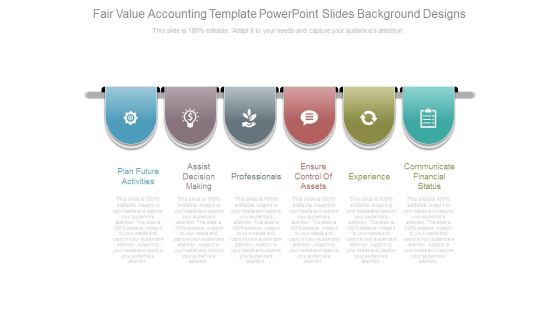
Fair Value Accounting Template Powerpoint Slides Background Designs
This is a fair value accounting template powerpoint slides background designs. This is a six stage process. The stages in this process are plan future activities, assist decision making, professionals, ensure control of assets, experience, communicate financial status.

Business Person With Big Dollar Sign Powerpoint Templates
Adjust the above diagram into your presentations to visually support your content. This slide has been professionally designed with graphics of business man with big dollar sign. This template offers an excellent background to display corporate financial management.
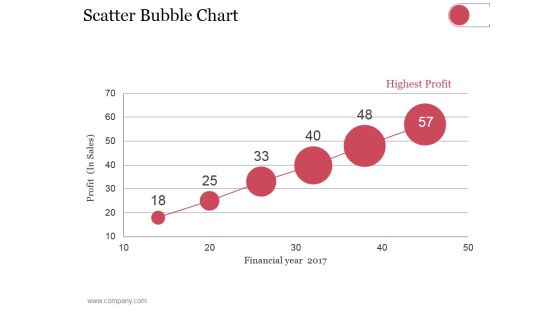
Scatter Bubble Chart Ppt PowerPoint Presentation Summary Pictures
This is a scatter bubble chart ppt powerpoint presentation summary pictures. This is a six stage process. The stages in this process are highest profit, financial year, profit in sales.

Line Bubble Chart Ppt PowerPoint Presentation Portfolio Slide Portrait
This is a line bubble chart ppt powerpoint presentation portfolio slide portrait. This is a six stage process. The stages in this process are highest profit, financial year, profit in sales, growth, business.
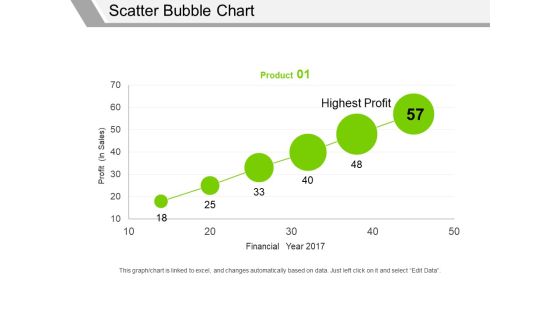
Scatter Bubble Chart Ppt PowerPoint Presentation Professional Graphics Pictures
This is a scatter bubble chart ppt powerpoint presentation professional graphics pictures. This is a one stage process. The stages in this process are profit in sales, financial year, highest profit, product.

Scatter Bubble Chart Ppt PowerPoint Presentation Summary Files
This is a scatter bubble chart ppt powerpoint presentation summary files. This is a six stage process. The stages in this process are product, financial year, profit, highest profit.
Scatter Bubble Chart Ppt PowerPoint Presentation Icon Elements
This is a scatter bubble chart ppt powerpoint presentation icon elements. This is a six stage process. The stages in this process are highest profit, profit, financial year, product.
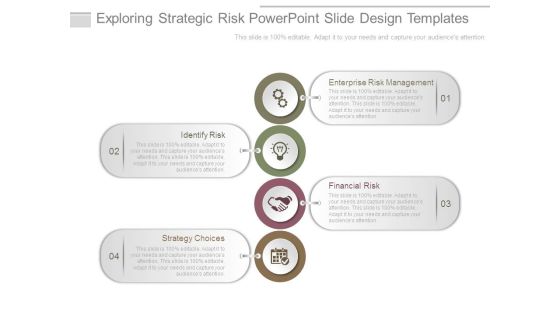
Exploring Strategic Risk Powerpoint Slide Design Templates
This is a exploring strategic risk powerpoint slide design templates. This is a four stage process. The stages in this process are enterprise risk management, identify risk, financial risk, strategy choices.

 Home
Home