Finance Kpi

Facebook Ads Dashboard Highlighting Marketing Campaign Results Slides PDF
The purpose of this slide is to highlight a comprehensive key performance indicator KPI dashboard which will allow marketers to measure return on investment ROI from social media campaign. The key metrics covered are total ad spend, cost per thousand CPM, cost per click CPC, click through rate CTR, etc. From laying roadmaps to briefing everything in detail, our templates are perfect for you. You can set the stage with your presentation slides. All you have to do is download these easy to edit and customizable templates. Facebook Ads Dashboard Highlighting Marketing Campaign Results Slides PDF will help you deliver an outstanding performance that everyone would remember and praise you for. Do download this presentation today.
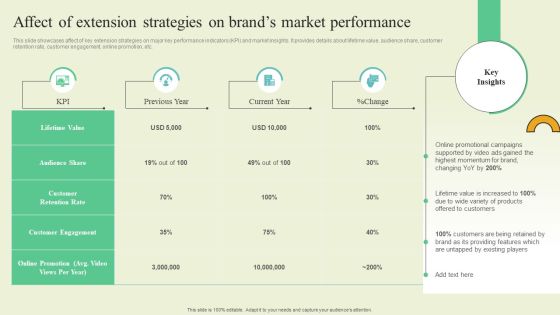
Extending Brand To Introduce New Commodities And Offerings Affect Extension Strategies Brands Microsoft PDF
This slide showcases affect of key extension strategies on major key performance indicators KPI and market insights. It provides details about lifetime value, audience share, customer retention rate, customer engagement, online promotion, etc. Boost your pitch with our creative Extending Brand To Introduce New Commodities And Offerings Affect Extension Strategies Brands Microsoft PDF. Deliver an awe inspiring pitch that will mesmerize everyone. Using these presentation templates you will surely catch everyones attention. You can browse the ppts collection on our website. We have researchers who are experts at creating the right content for the templates. So you do not have to invest time in any additional work. Just grab the template now and use them.

Kpis To Measure Effectiveness Of Facebook Ad Campaign Ppt PowerPoint Presentation File Diagrams PDF
The following slide outlines key performance indicators KPI through which marketers can analyze impact of Facebook ads. The key metrics mentioned in slide are likes, shares, comments, click-through rate CTR, cost per conversion CPV, conversion rate, new followers, reach, and brand impressions. Do you have to make sure that everyone on your team knows about any specific topic I yes, then you should give Kpis To Measure Effectiveness Of Facebook Ad Campaign Ppt PowerPoint Presentation File Diagrams PDF a try. Our experts have put a lot of knowledge and effort into creating this impeccable Kpis To Measure Effectiveness Of Facebook Ad Campaign Ppt PowerPoint Presentation File Diagrams PDF. You can use this template for your upcoming presentations, as the slides are perfect to represent even the tiniest detail. You can download these templates from the Slidegeeks website and these are easy to edit. So grab these today.

Transform Management Instruction Schedule Dashboard To Track And Analyse Change Mockup PDF
This slide represents the KPI dashboard to track and monitor the effectiveness of change management training program conducted by the organization. It includes key metrics such as active employees, no.of trainings, cost etc. Slidegeeks is one of the best resources for PowerPoint templates. You can download easily and regulate Transform Management Instruction Schedule Dashboard To Track And Analyse Change Mockup PDF for your personal presentations from our wonderful collection. A few clicks is all it takes to discover and get the most relevant and appropriate templates. Use our Templates to add a unique zing and appeal to your presentation and meetings. All the slides are easy to edit and you can use them even for advertisement purposes.

Brand Launch Checklist Awareness Kpis To Track Brand Effectiveness Ideas PDF
This template covers key performance indicator KPI to determine the performance against the company objectives. These Social media KPIs would be focusing on social engagements, content reach, purchase leads and conversions. Slidegeeks is one of the best resources for PowerPoint templates. You can download easily and regulate Brand Launch Checklist Awareness Kpis To Track Brand Effectiveness Ideas PDF for your personal presentations from our wonderful collection. A few clicks is all it takes to discover and get the most relevant and appropriate templates. Use our Templates to add a unique zing and appeal to your presentation and meetings. All the slides are easy to edit and you can use them even for advertisement purposes.
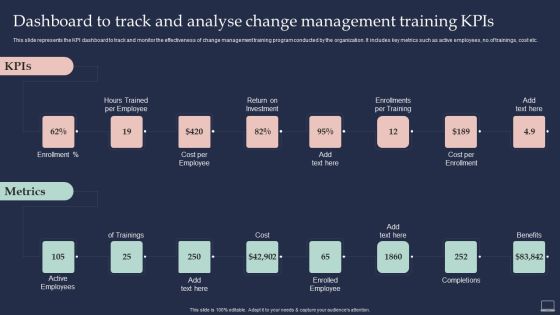
Training Program For Implementing Dashboard To Track And Analyse Change Management Brochure PDF
This slide represents the KPI dashboard to track and monitor the effectiveness of change management training program conducted by the organization. It includes key metrics such as active employees, no.of trainings, cost etc. This Training Program For Implementing Dashboard To Track And Analyse Change Management Brochure PDF is perfect for any presentation, be it in front of clients or colleagues. It is a versatile and stylish solution for organizing your meetings. The Training Program For Implementing Dashboard To Track And Analyse Change Management Brochure PDF features a modern design for your presentation meetings. The adjustable and customizable slides provide unlimited possibilities for acing up your presentation. Slidegeeks has done all the homework before launching the product for you. So, dont wait, grab the presentation templates today.

Optimizing Marketing Analytics To Enhance Organizational Growth Analyzing Backlinks For Improved Brochure PDF
This slide covers an overview of backlinks KPI to identify count as one of the most important Google ranking factors. It also includes improvement strategies such as finding backlink opportunities with top referral sources, guest blogging, and writing testimonials. Slidegeeks is one of the best resources for PowerPoint templates. You can download easily and regulate Optimizing Marketing Analytics To Enhance Organizational Growth Analyzing Backlinks For Improved Brochure PDF for your personal presentations from our wonderful collection. A few clicks is all it takes to discover and get the most relevant and appropriate templates. Use our Templates to add a unique zing and appeal to your presentation and meetings. All the slides are easy to edit and you can use them even for advertisement purposes.

Marketers Guide To Data Analysis Optimization Tracking Followers Count To Improve User Engagement Clipart PDF
This slide covers an overview of the follower count KPI to identify the number of users following the account on social media platforms. It also includes strategies to increase followers, such as throwing contests, posting exclusive content, and partnering with influencers. Slidegeeks is one of the best resources for PowerPoint templates. You can download easily and regulate Marketers Guide To Data Analysis Optimization Tracking Followers Count To Improve User Engagement Clipart PDF for your personal presentations from our wonderful collection. A few clicks is all it takes to discover and get the most relevant and appropriate templates. Use our Templates to add a unique zing and appeal to your presentation and meetings. All the slides are easy to edit and you can use them even for advertisement purposes.

Online Marketing Analytics To Enhance Business Growth Analyzing Blog Views Visits To Increase Organic Traffic Diagrams PDF
This slide covers blog view KPI to identify how many unique visitors have viewed your blogs. It also includes strategies to improve blog page views, create viral content, use FAB strategy to create content, and create evergreen list posts. Slidegeeks is one of the best resources for PowerPoint templates. You can download easily and regulate Online Marketing Analytics To Enhance Business Growth Analyzing Blog Views Visits To Increase Organic Traffic Diagrams PDF for your personal presentations from our wonderful collection. A few clicks is all it takes to discover and get the most relevant and appropriate templates. Use our Templates to add a unique zing and appeal to your presentation and meetings. All the slides are easy to edit and you can use them even for advertisement purposes.

Search Engine Marketing Annual Sem Campaign Performance Plan Guidelines PDF
The following slide showcases the yearly search engine marketing campaign performance plan to project results . It KPI such as revenue, pay-per-click, media spend, management fee, total cost, paid search revenue etc. Welcome to our selection of the Search Engine Marketing Annual Sem Campaign Performance Plan Guidelines PDF. These are designed to help you showcase your creativity and bring your sphere to life. Planning and Innovation are essential for any business that is just starting out. This collection contains the designs that you need for your everyday presentations. All of our PowerPoints are 100 percent editable, so you can customize them to suit your needs. This multi-purpose template can be used in various situations. Grab these presentation templates today.

Annual SEM Campaign Performance Plan Ppt Layouts Templates PDF
The following slide showcases the yearly search engine marketing campaign performance plan to project results . It KPI such as revenue, pay-per-click, media spend, management fee, total cost, paid search revenue etc. If you are looking for a format to display your unique thoughts, then the professionally designed Annual SEM Campaign Performance Plan Ppt Layouts Templates PDF is the one for you. You can use it as a Google Slides template or a PowerPoint template. Incorporate impressive visuals, symbols, images, and other charts. Modify or reorganize the text boxes as you desire. Experiment with shade schemes and font pairings. Alter, share or cooperate with other people on your work. Download Annual SEM Campaign Performance Plan Ppt Layouts Templates PDF and find out how to give a successful presentation. Present a perfect display to your team and make your presentation unforgettable.
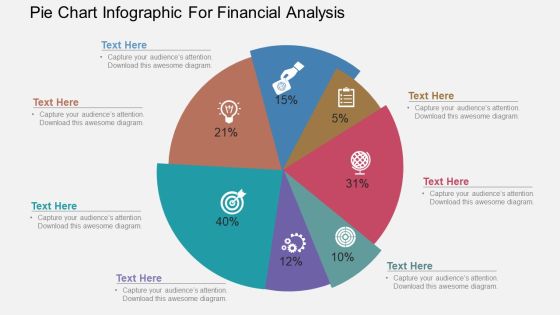
Pie Chart Infographic For Financial Analysis Powerpoint Template
Our above PowerPoint template has been designed with pie chart infographic. This slide is suitable to present financial analysis. Use this business diagram to present your work in a more smart and precise manner.

Improving Business Procedures Enterprise Resource Planning System Projecting Future Kpis Post Erp Brochure PDF
The following slide highlights some key performance indicators to set standards and compare with previous performance. It includes components such as finance and customer management, internal processes, learning, growth etc. This Improving Business Procedures Enterprise Resource Planning System Projecting Future Kpis Post Erp Brochure PDF from Slidegeeks makes it easy to present information on your topic with precision. It provides customization options, so you can make changes to the colors, design, graphics, or any other component to create a unique layout. It is also available for immediate download, so you can begin using it right away. Slidegeeks has done good research to ensure that you have everything you need to make your presentation stand out. Make a name out there for a brilliant performance.
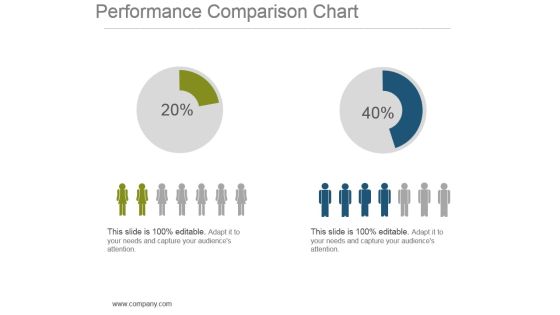
Performance Comparison Chart Powerpoint Show
This is a performance comparison chart powerpoint show. This is a two stage process. The stages in this process are finance, compare, strategy, management, planning.

Key Evaluation Metrics Ppt Slides
This is a key evaluation metrics ppt slides. This is a five stage process. The stages in this process are business, finance, marketing, symbol.

Key Metrics To Analyse Annual Cash Flow Statement Ppt Gallery Microsoft PDF
This slide showcases cashflow statement to provide a detailed picture of companys cash. It includes major KPIs which are net cashflow from operating, investing and financing activity. Pitch your topic with ease and precision using this Key Metrics To Analyse Annual Cash Flow Statement Ppt Gallery Microsoft PDF. This layout presents information on Net Cashflow, 2019 To 2021, Investing Activity. It is also available for immediate download and adjustment. So, changes can be made in the color, design, graphics or any other component to create a unique layout.

Business Risk Impact Analysis Matrix With Mitigation Strategies Structure PDF
This slide covers the risk management matrix this prompts the team to identify risks, assess their potential impact, and devise mitigation strategies. It includes likelihood, metric, date , current value, etc. Presenting Business Risk Impact Analysis Matrix With Mitigation Strategies Structure PDF to dispense important information. This template comprises five stages. It also presents valuable insights into the topics including Financing Source, Mitigation Strategies, Plan. This is a completely customizable PowerPoint theme that can be put to use immediately. So, download it and address the topic impactfully.

Business Departments Performance Metrics Ppt Slides
This is a business departments performance metrics ppt slides. This is a seven stage process. The stages in this process are engineering, construction, maintenance, operations, safety, finance, environment.

Balanced Scorecard Metrics Powerpoint Shapes
This is a balanced scorecard metrics powerpoint shapes. This is a four stage process. The stages in this process are finance, client, processes, people.

Key Performance Management Metrics Powerpoint Slide Background
This is a key performance management metrics powerpoint slide background. This is a five stage process. The stages in this process are business, marketing, finance, icons, strategy.
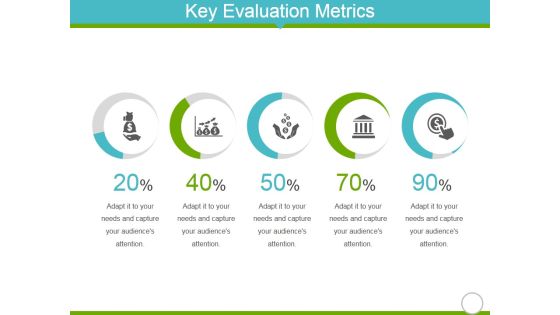
Key Evaluation Metrics Ppt Powerpoint Presentation Styles Design Inspiration
This is a key evaluation metrics ppt powerpoint presentation styles design inspiration. This is a five stage process. The stages in this process are business, marketing, icons, finance.

Key Evaluation Metrics Ppt PowerPoint Presentation File Design Ideas
This is a key evaluation metrics ppt powerpoint presentation file design ideas. This is a five stage process. The stages in this process are business, icons, strategy, marketing, finance.
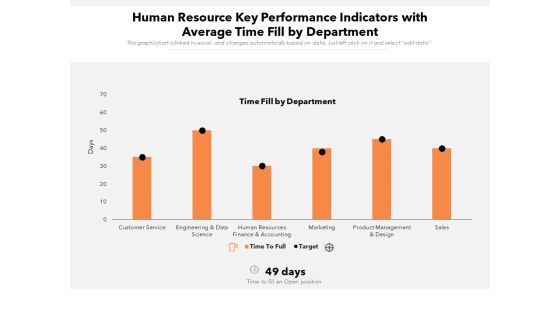
Human Resource Key Performance Indicators With Average Time Fill By Department Ppt PowerPoint Presentation Gallery Example Introduction PDF
Showcasing this set of slides titled human resource key performance indicators with average time fill by department ppt powerpoint presentation gallery example introduction pdf. The topics addressed in these templates are sales, service, finance. All the content presented in this PPT design is completely editable. Download it and make adjustments in color, background, font etc. as per your unique business setting.

Scorecard Management Diagram Ppt Samples Download
This is a scorecard management diagram ppt samples download. This is a five stage process. The stages in this process are financial goals, growth, customer metrics, budget finance, internal metrics.

4 Key Market Drivers Of Economic Growth Ppt PowerPoint Presentation Templates
This is a 4 key market drivers of economic growth ppt powerpoint presentation templates. This is a four stage process. The stages in this process are key market driver.

Essentials Of Statistics For Business And Economics Ppt Powerpoint Presentation Pictures Styles
This is a essentials of statistics for business and economics ppt powerpoint presentation pictures styles. This is a three stage process. The stages in this process are business metrics, business kpi, business dashboard.

Key Financial Ratios Ppt PowerPoint Presentation Infographic Template Master Slide
This is a key financial ratios ppt powerpoint presentation infographic template master slide. This is a eight stage process. The stages in this process are debt to equity ratio, current ratio, return on equity, return on investment.

Key Financial Ratios Ppt PowerPoint Presentation Portfolio Summary
This is a key financial ratios ppt powerpoint presentation portfolio summary. This is a eight stage process. The stages in this process are return on assets, return on equity, return on investment, debt equity ratio, current ratio.
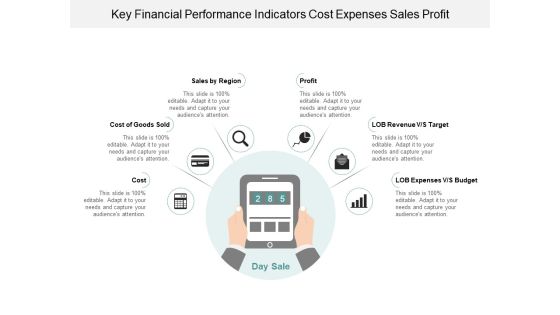
Key Financial Performance Indicators Cost Expenses Sales Profit Ppt Powerpoint Presentation Infographic Template Graphic Images
This is a key financial performance indicators cost expenses sales profit ppt powerpoint presentation infographic template graphic images. This is a six stage process. The stages in this process are dashboard, kpi, metrics.
Key Attributes Of Fixed Price Model Ppt PowerPoint Presentation Icon
This is a key attributes of fixed price model ppt powerpoint presentation icon. This is a six stage process. The stages in this process are fixed price model.

Inventory Metrics Carrying Cost Order Inventory Delivered Unit Costs Ppt Powerpoint Presentation Layouts Guidelines
This is a inventory metrics carrying cost order inventory delivered unit costs ppt powerpoint presentation layouts guidelines. This is a two stage process. The stages in this process are availability kpi, availability dashboard, availability metrics.
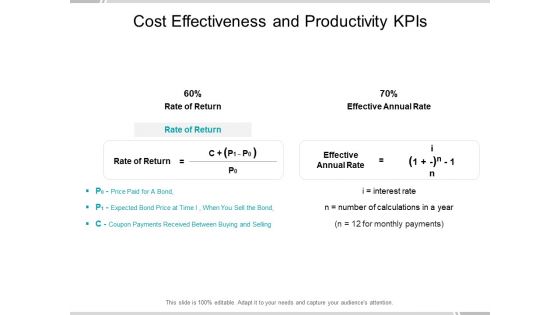
Cost Effectiveness And Productivity Kpis Ppt Powerpoint Presentation Portfolio Demonstration
This is a cost effectiveness and productivity kpis ppt powerpoint presentation portfolio demonstration. This is a two stage process. The stages in this process are availability kpi, availability dashboard, availability metrics.
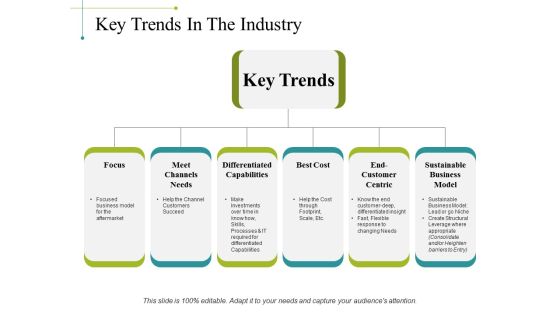
Key Trends In The Industry Ppt PowerPoint Presentation Portfolio Design Inspiration
This is a key trends in the industry ppt powerpoint presentation portfolio design inspiration. This is a six stage process. The stages in this process are focus, meet channels needs, differentiated capabilities, best cost, sustainable business model.

Customer Retention Kpis Lifetime Value And Acquisition Cost Ppt Powerpoint Presentation Model Samples
This is a customer retention kpis lifetime value and acquisition cost ppt powerpoint presentation model samples. This is a five stage process. The stages in this process are dashboard, kpi, metrics.

Customer Satisfaction Template Ppt PowerPoint Presentation Show Introduction
This is a customer satisfaction template ppt powerpoint presentation show introduction. This is a three stage process. The stages in this process are overall satisfaction with service, satisfaction with value for money, overall satisfaction with relationship.
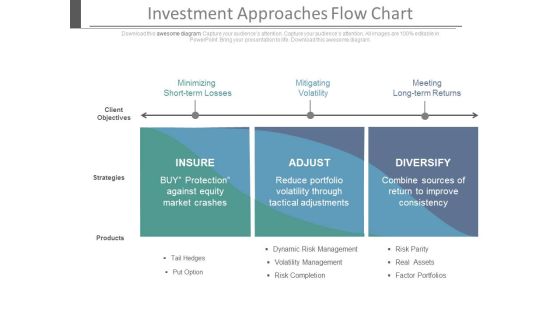
Investment Approaches Flow Chart Ppt Slides
This is an investment approached flow chart ppt slides. This is a three stage process. The stages in this process are marketing, business, success.

Designing Effective Kpis Ppt Example
This is a designing effective kpis ppt example. This is a seven stage process. The stages in this process are goal, audience, cost, benchmark, kpi, tool, insight, the networked nonprofit.
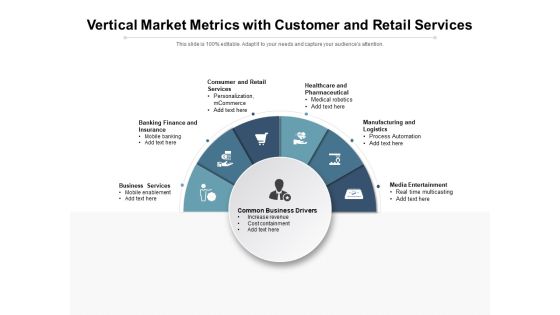
Vertical Market Metrics With Customer And Retail Services Ppt PowerPoint Presentation File Infographics PDF
Presenting this set of slides with name vertical market metrics with customer and retail services ppt powerpoint presentation file infographics pdf. This is a six stage process. The stages in this process are business, services, finance. This is a completely editable PowerPoint presentation and is available for immediate download. Download now and impress your audience.
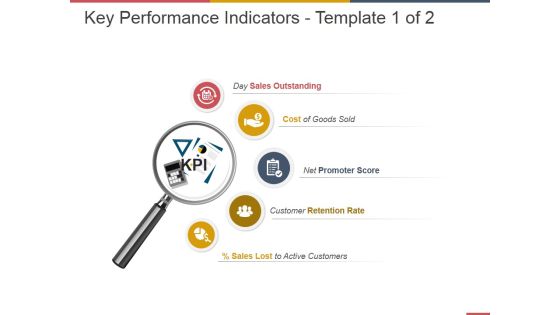
Key Performance Indicators Template 1 Ppt PowerPoint Presentation Portfolio
This is a key performance indicators template 1 ppt powerpoint presentation portfolio. This is a five stage process. The stages in this process are sales outstanding, cost of goods sold, promoter score, retention rate, active customers.

Global Business Data Solution Ppt Powerpoint Layout
This is a global business data solution ppt powerpoint layout. This is a ten stage process. The stages in this process are themis hub, marketing and finance, sales and share, positioning, margin and profit, business performance metrics, product and portfolio mgtchange predictors, pricing strategy, customer and sales force.\n\n\n\n\n\n\n\n\n\n\n\n\n\n\n\n\n\n\n\n

Key Financial Ratios Ppt PowerPoint Presentation Outline Slide
This is a key financial ratios ppt powerpoint presentation outline slide. This is a eight stage process. The stages in this process are return on assets, return on equity, return on investment, current ratio, debt equity ratio.

Key Trends In The Industry Ppt PowerPoint Presentation Professional Backgrounds
This is a key trends in the industry ppt powerpoint presentation professional backgrounds. This is a six stage process. The stages in this process are focus, meet channels needs, differentiated capabilities, best cost, end customer centric.

10 Designs To An Amazing Pitch Example Of Ppt
This is a 10 designs to an amazing pitch example of ppt. This is a ten stage process. The stages in this process are business model, money, market size, the solution, team, marketing plan, competition, elevator pitch, proprietary tech, the problem.

Recruitment Strategy And Human Resource Employee Skill Assessment Scorecard Background PDF
The following slide showcases HR scorecard and strategy map. It includes employee growth, financial and process, KPI, current score and target. This is a Recruitment Strategy And Human Resource Employee Skill Assessment Scorecard Background PDF template with various stages. Focus and dispense information on two stages using this creative set, that comes with editable features. It contains large content boxes to add your information on topics like Recruitment Strategy Management, HR Scorecard, KPI, Strategy. You can also showcase facts, figures, and other relevant content using this PPT layout. Grab it now.

Essential Factors To Develop Sales Remuneration Strategy Ppt Gallery Graphics PDF
The following slide highlights the essential factors to develop sales commission scheme. It illustrates company goals, roles in team, budget and industry, on target earnings, sales team kpi, company culture and payout. Persuade your audience using this Essential Factors To Develop Sales Remuneration Strategy Ppt Gallery Graphics PDF. This PPT design covers seven stages, thus making it a great tool to use. It also caters to a variety of topics including Company Goals, Budget And Industry, On Target Earnings, Sales Team KPI. Download this PPT design now to present a convincing pitch that not only emphasizes the topic but also showcases your presentation skills.

Comparison Metrics For Business Partner Lifecycle Management Guidelines PDF
The following slide highlights the comparison metrics for partner lifecycle management illustrating key headings which includes comparison area, comparison metric, high score, low score and partner. Where comparison are depicts business size, management, growth strategy, integration and finance. Pitch your topic with ease and precision using this Comparison Metrics For Business Partner Lifecycle Management Guidelines PDF. This layout presents information on Business Size, Management, Growth Strategy. It is also available for immediate download and adjustment. So, changes can be made in the color, design, graphics or any other component to create a unique layout.

Steps Of Yearly Operations Planning Process Ppt PowerPoint Presentation Gallery Template PDF
The following slide showcases various steps of annual operations planning process. It includes key steps like gather diversified team, analyze precious years, set realistic goals, determine KPI, prepare monthly budgets, plan for future and revisit regularly. Pitch your topic with ease and precision using this Steps Of Yearly Operations Planning Process Ppt PowerPoint Presentation Gallery Template PDF. This layout presents information on Analyze Previous Years, Set Realistic Objectives, Determine KPI. It is also available for immediate download and adjustment. So, changes can be made in the color, design, graphics or any other component to create a unique layout.

Impact Of Poor Vendor Management On Major Kpis Vendor Management Strategies Ideas PDF
The following slide shows impact of poor supplier administration on key performance indicators KPIs. It provides information about reputation, operations, compliance, finance, service level agreements, customer retention, etc. Deliver and pitch your topic in the best possible manner with this Impact Of Poor Vendor Management On Major Kpis Vendor Management Strategies Ideas PDF. Use them to share invaluable insights on Parameters, Decreased Operational, Compliance and impress your audience. This template can be altered and modified as per your expectations. So, grab it now.

Vendor Management To Handle Purchase Impact Of Poor Vendor Management On Major Kpis Mockup PDF
The following slide shows impact of poor supplier administration on key performance indicators KPIs. It provides information about reputation, operations, compliance, finance, service level agreements, customer retention, etc. Deliver an awe inspiring pitch with this creative Vendor Management To Handle Purchase Impact Of Poor Vendor Management On Major Kpis Mockup PDF bundle. Topics like Decreased Operational, Improper Management, Poor External can be discussed with this completely editable template. It is available for immediate download depending on the needs and requirements of the user.
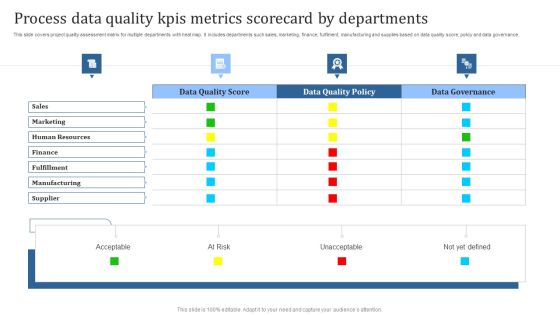
Process Data Quality Kpis Metrics Scorecard By Departments Template PDF
This slide covers project quality assessment matrix for multiple departments with heat map. It includes departments such sales, marketing, finance, fulfilment, manufacturing and supplies based on data quality score, policy and data governance. Showcasing this set of slides titled Process Data Quality Kpis Metrics Scorecard By Departments Template PDF. The topics addressed in these templates are Acceptable, At Risk, Unacceptable. All the content presented in this PPT design is completely editable. Download it and make adjustments in color, background, font etc. as per your unique business setting.
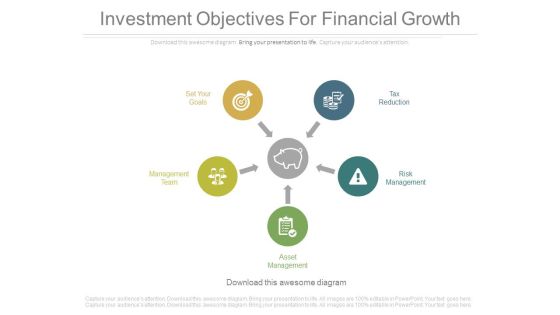
Investment Objectives For Financial Growth Ppt Slides
This is an investment objectives for financial growth ppt slides. This is a five stage process. The stages in this process are marketing, business, success, arrows.
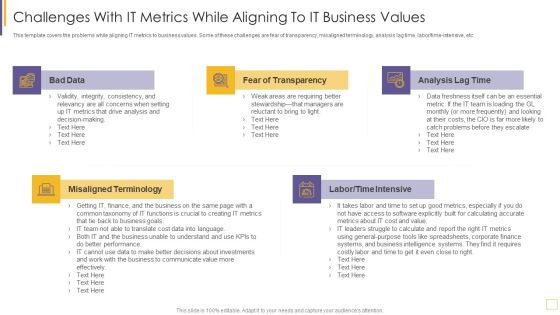
Guidelines For Exhibiting Business Value Of Information And Technology Challenges With IT Metrics Template PDF
This template covers the problems while aligning IT metrics to business values. Some of these challenges are fear of transparency, misaligned terminology, analysis lag time, labor or time intensive, etc. This is a guidelines for exhibiting business value of information and technology challenges with it metrics template pdf template with various stages. Focus and dispense information on five stages using this creative set, that comes with editable features. It contains large content boxes to add your information on topics like analysis, value, finance, metrics, systems. You can also showcase facts, figures, and other relevant content using this PPT layout. Grab it now.

Financials Base Plan Table Chart Ppt Slide Templates
This is a financials base plan table chart ppt slide templates. This is a five stage process. The stages in this process are kpi, revenue, cost of sales, gross profit, customer acquisition cost, other operating cost expense, operating profit, change in cash, ending cash, employees ftes.
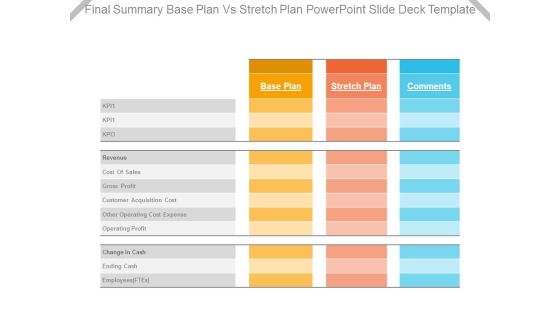
Final Summary Base Plan Vs Stretch Plan Powerpoint Slide Deck Template
This is a final summary base plan vs stretch plan powerpoint slide deck template. This is a three stage process. The stages in this process are kpi, revenue, cost of sales, gross profit, customer acquisition cost, other operating cost expense, operating profit, change in cash, ending cash, employees ftes.

Profit Summary Base Plan Vs Stretch Plan Presentation Diagrams
This is a profit summary base plan vs stretch plan presentation diagrams. This is a three stage process. The stages in this process are base plan, stretch plan, comments, kpi, cost of sales, revenue, gross profit, customer acquisition cost, other operating expense, operating profit, change in cash, ending cash, employees ftes.

Financials Base Plan For Company Targets Powerpoint Slide Deck Samples
This is a financials base plan for company targets powerpoint slide deck samples. This is a five stage process. The stages in this process are revenue, cost of sales, gross profit, customer acquisition cost, other operating expense, change in cash, change in cash, ending cash, employees ftes, kpi.
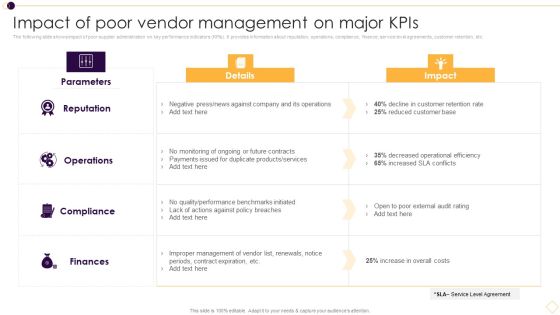
Supplier Management For Enhanced SCM And Procurement Impact Of Poor Vendor Management On Major Kpis Clipart PDF
The following slide shows impact of poor supplier administration on key performance indicators KPIs. It provides information about reputation, operations, compliance, finance, service level agreements, customer retention, etc. Deliver an awe inspiring pitch with this creative Supplier Management For Enhanced SCM And Procurement Impact Of Poor Vendor Management On Major Kpis Clipart PDF bundle. Topics like Quality Or Performance, Improper Management, Increase In Overall can be discussed with this completely editable template. It is available for immediate download depending on the needs and requirements of the user.

Impact Of Poor Vendor Management On Major Kpis Effective Vendor Management For Enhancing Graphics PDF
The following slide shows impact of poor supplier administration on key performance indicators KPIs. It provides information about reputation, operations, compliance, finance, service level agreements, customer retention, etc. This Impact Of Poor Vendor Management On Major Kpis Effective Vendor Management For Enhancing Graphics PDF is perfect for any presentation, be it in front of clients or colleagues. It is a versatile and stylish solution for organizing your meetings. The product features a modern design for your presentation meetings. The adjustable and customizable slides provide unlimited possibilities for acing up your presentation. Slidegeeks has done all the homework before launching the product for you. So, do not wait, grab the presentation templates today
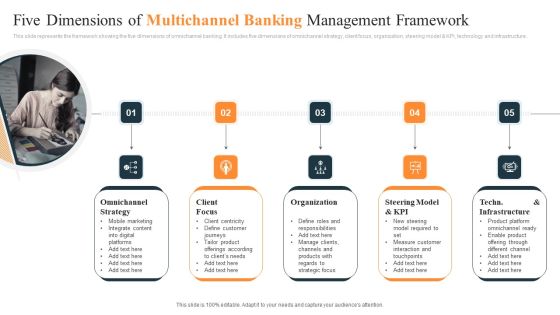
Five Dimensions Of Multichannel Banking Management Framework Ppt Outline Files PDF
This slide represents the framework showing the five dimensions of omnichannel banking. It includes five dimensions of omnichannel strategy, client focus, organization, steering model and KPI, technology and infrastructure. Persuade your audience using this Five Dimensions Of Multichannel Banking Management Framework Ppt Outline Files PDF. This PPT design covers five stages, thus making it a great tool to use. It also caters to a variety of topics including Omnichannel Strategy, Client Focus, Organization. Download this PPT design now to present a convincing pitch that not only emphasizes the topic but also showcases your presentation skills.
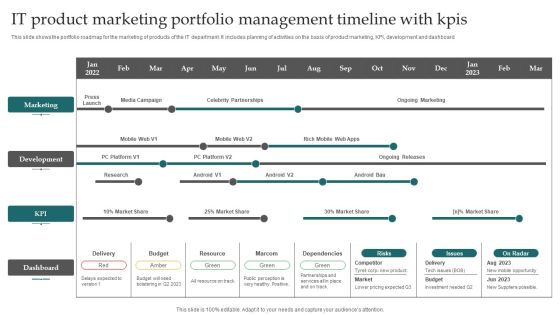
IT Product Marketing Portfolio Management Timeline With Kpis Elements PDF
This slide shows the portfolio roadmap for the marketing of products of the IT department. It includes planning of activities on the basis of product marketing, KPI, development and dashboard. Showcasing this set of slides titled IT Product Marketing Portfolio Management Timeline With Kpis Elements PDF. The topics addressed in these templates are Marketing, Development, Budget. All the content presented in this PPT design is completely editable. Download it and make adjustments in color, background, font etc. as per your unique business setting.
 Home
Home