Finance Kpi
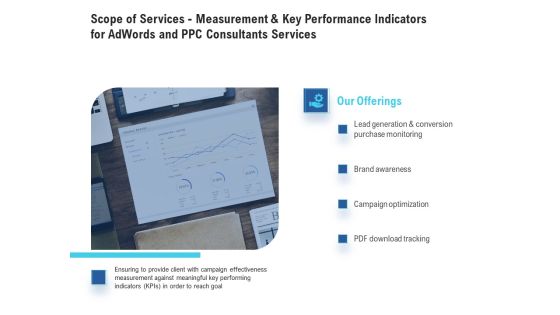
Scope Of Services - Measurement And Key Performance Indicators For Adwords And PPC Consultants Services Brochure PDF
Presenting this set of slides with name scope of services - measurement and key performance indicators for adwords and ppc consultants services brochure pdf. This is a four stage process. The stages in this process are lead generation and conversion purchase monitoring, brand awareness, campaign optimization, pdf download tracking. This is a completely editable PowerPoint presentation and is available for immediate download. Download now and impress your audience.
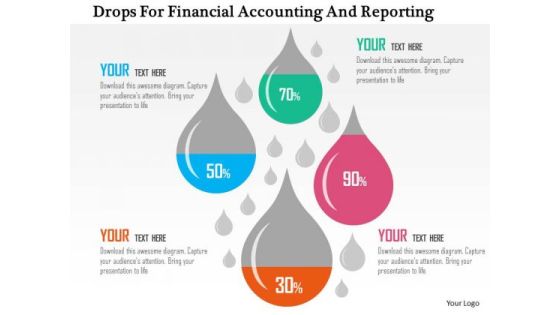
Business Diagram Drops For Financial Accounting And Reporting Presentation Template
This business diagram has been designed with drops displaying financial ratios. Download this diagram to depict financial and accounting ratios. Use this slide to build quality presentations for your viewers.

Five Year Financial Forecast And Essential Metrics Ppt Infographics Shapes PDF
This slide showcases five-year projection of the company to analyze its growth and financing needs and capital expenditures requirements. It also includes the KPIs such as number of customers, revenue , expenses and cashflow. Presenting Five Year Financial Forecast And Essential Metrics Ppt Infographics Shapes PDF to dispense important information. This template comprises five stages. It also presents valuable insights into the topics including Number Customers, Revenue, Expenses, Cash Flow, 2018 To 2022. This is a completely customizable PowerPoint theme that can be put to use immediately. So, download it and address the topic impactfully.
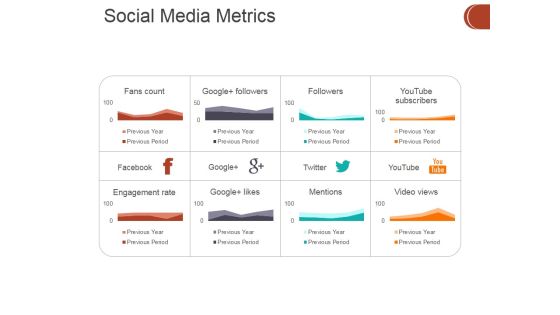
Social Media Metrics Ppt PowerPoint Presentation Portfolio Tips
This is a social media metrics ppt powerpoint presentation portfolio tips. This is a eight stage process. The stages in this process are business, finance, growth, strategy, analysis, investment.
Key Evaluation Metrics Ppt PowerPoint Presentation Layouts Icons
This is a key evaluation metrics ppt powerpoint presentation layouts icons. This is a five stage process. The stages in this process are business, icons, marketing, strategy, finance, analysis.

Commodity Adoption Metrics For Technique Development Microsoft PDF
This slide highlights various key performance indicators to identify product adoption rate for user acquisition strategy development. It includes key metrics such as net promoter score, client retention rate, active user percentage, customer lifetime value and churn rate. Presenting Commodity Adoption Metrics For Technique Development Microsoft PDF to dispense important information. This template comprises four stages. It also presents valuable insights into the topics including Build Customer, Onboarding Process, Analysis. This is a completely customizable PowerPoint theme that can be put to use immediately. So, download it and address the topic impactfully.

Social Media And Word Of Mouth Metrics Ppt Powerpoint Presentation Show Example Introduction
This is a social media and word of mouth metrics ppt powerpoint presentation show example introduction. This is a two stage process. The stages in this process are finance, marketing, management, investment, analysis.
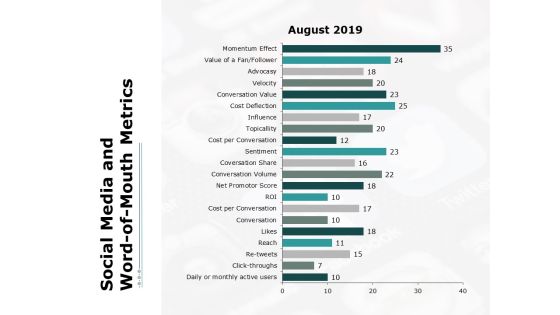
Social Media And Word Of Mouth Metrics Ppt PowerPoint Presentation Layouts Graphics
This is a social media and word of mouth metrics ppt powerpoint presentation layouts graphics. This is a three stage process. The stages in this process are finance, marketing, management, investment, analysis.
Social Media And Word Of Mouth Metrics Ppt PowerPoint Presentation Model Icon
This is a social media and word of mouth metrics ppt powerpoint presentation model icon. This is a two stage process. The stages in this process are finance, management, strategy, analysis, marketing.

Key Metrics Presentation Powerpoint Example
This is a key metrics presentation powerpoint example. This is a two stage process. The stages in this process are residential customer churn, broadband availability.
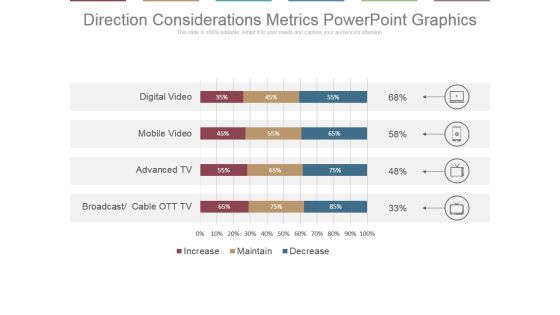
Direction Considerations Metrics Powerpoint Graphics
This is a direction considerations metrics powerpoint graphics. This is a four stage process. The stages in this process are digital video, mobile video, advanced tv, broadcast, cable ott tv.
Key Evaluation Metrics Ppt PowerPoint Presentation Portfolio
This is a key evaluation metrics ppt powerpoint presentation portfolio. This is a five stage process. The stages in this process are business, strategy, marketing, analysis, success, icons.
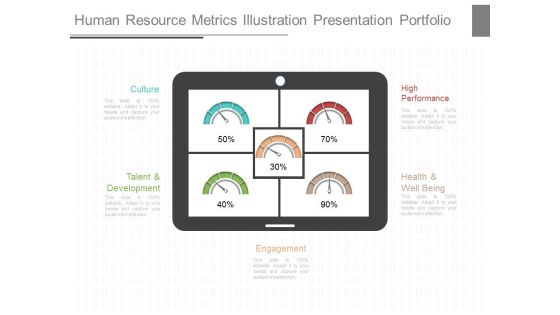
Human Resource Metrics Illustration Presentation Portfolio
This is a human resource metrics illustration presentation portfolio. This is a five stage process. The stages in this process are culture, high performance, talent and development, health and well being, engagement.

Successful Mobile Strategies For Business App Metrics Dashboard Microsoft PDF
Presenting successful mobile strategies for business app metrics dashboard microsoft pdf to provide visual cues and insights. Share and navigate important information on six stages that need your due attention. This template can be used to pitch topics like app metrics dashboard. In addtion, this PPT design contains high resolution images, graphics, etc, that are easily editable and available for immediate download.

Sales Opportunity Metrics Template Presentation Design
This is a sales opportunity metrics template presentation design. This is a three stage process. The stages in this process are sales status, sales opportunities, sales product performance.
Sales Target Metrics Achievement Icon Download PDF
Persuade your audience using this Sales Target Metrics Achievement Icon Download PDF. This PPT design covers four stages, thus making it a great tool to use. It also caters to a variety of topics including Sales Target Metrics, Achievement Icon. Download this PPT design now to present a convincing pitch that not only emphasizes the topic but also showcases your presentation skills.
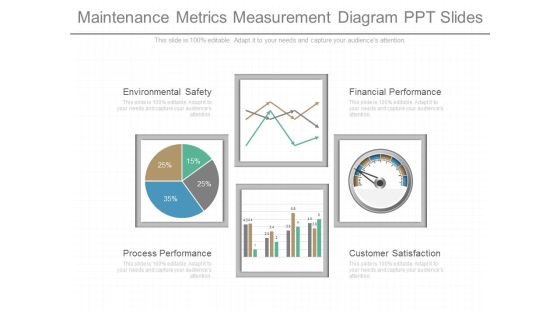
Maintenance Metrics Measurement Diagram Ppt Slides
This is a maintenance metrics measurement diagram ppt slides. This is a four stage process. The stages in this process are environmental safety, process performance, financial performance, customer satisfaction.

Kpis And Operations Metrics Presentation Powerpoint Example
This is a kpis and operations metrics presentation powerpoint example. This is a five stage process. The stages in this process are customer class, affiliate, sales by warehouse, warehouse, profit by affiliate.
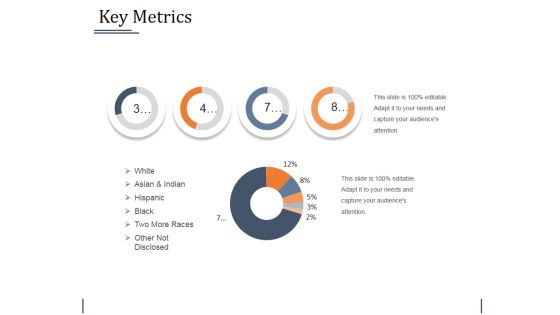
Key Metrics Ppt PowerPoint Presentation Outline Templates
This is a key metrics ppt powerpoint presentation outline templates. This is a four stage process. The stages in this process are white, asian and indian, hispanic, black, two more races, other not disclosed.

Business Management Kpis Metrics Net Profit Ppt Show Structure PDF
Presenting business management kpis metrics net profit ppt show structure pdf. to provide visual cues and insights. Share and navigate important information on five stages that need your due attention. This template can be used to pitch topics like active customers sold units, total revenues, profit margin, net profit. In addtion, this PPT design contains high resolution images, graphics, etc, that are easily editable and available for immediate download.

Enterprise Tactical Planning Business Management Kpis Metrics Microsoft PDF
Presenting enterprise tactical planning business management kpis metrics microsoft pdf to provide visual cues and insights. Share and navigate important information on five stages that need your due attention. This template can be used to pitch topics like active customers, sold units, total revenues, net profit, profit margin. In addition, this PPT design contains high-resolution images, graphics, etc, that are easily editable and available for immediate download.
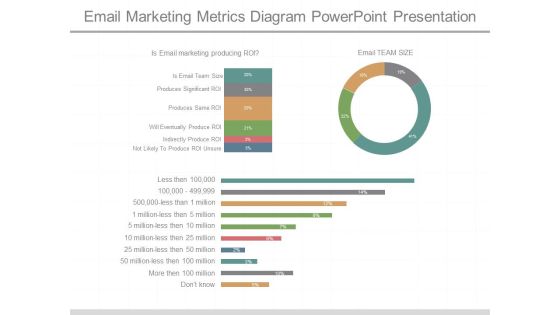
Email Marketing Metrics Diagram Powerpoint Presentation
This is a email marketing metrics diagram powerpoint presentation. This is a three stage process. The stages in this process are is email marketing producing roi, is email team size, produces significant roi, produces same roi, will eventually produce roi, indirectly produce roi, not likely to produce roi unsure, email team size.

Banking Performance Metrics Ppt PowerPoint Presentation Professional Good Cpb Pdf
Presenting this set of slides with name banking performance metrics ppt powerpoint presentation professional good cpb pdf. This is an editable Powerpoint six stages graphic that deals with topics like banking performance metrics to help convey your message better graphically. This product is a premium product available for immediate download and is 100 percent editable in Powerpoint. Download this now and use it in your presentations to impress your audience.

Business Operations Assessment Business Management Kpis Metrics Ppt Infographic Template Deck PDF
This is a business operations assessment business management kpis metrics ppt infographic template deck pdf template with various stages. Focus and dispense information on six stages using this creative set, that comes with editable features. It contains large content boxes to add your information on topics like budgeted income, received income, accounts receivable, budgeted expenses, paid expenses, accounts payable. You can also showcase facts, figures, and other relevant content using this PPT layout. Grab it now.
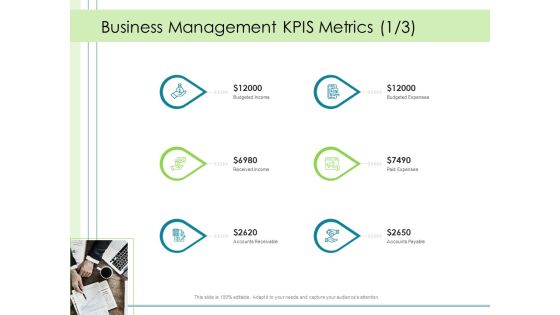
In Depth Business Assessment Business Management Kpis Metrics Ppt PowerPoint Presentation Show Demonstration PDF
This is a in depth business assessment business management kpis metrics ppt powerpoint presentation show demonstration pdf template with various stages. Focus and dispense information on six stages using this creative set, that comes with editable features. It contains large content boxes to add your information on topics like budgeted income, received income, accounts receivable, budgeted expenses, paid expenses, accounts payable. You can also showcase facts, figures, and other relevant content using this PPT layout. Grab it now.

Business Management Kpis Metrics Accounts Business Analysis Method Ppt Portfolio Information PDF
This is a business management kpis metrics accounts business analysis method ppt portfolio information pdf template with various stages. Focus and dispense information on six stages using this creative set, that comes with editable features. It contains large content boxes to add your information on topics like budgeted income, received income, accounts receivable, budgeted expenses, paid expenses. You can also showcase facts, figures, and other relevant content using this PPT layout. Grab it now.
Monthly Budget And Financial Metrics Report Icon Brochure PDF
Persuade your audience using this Monthly Budget And Financial Metrics Report Icon Brochure PDF. This PPT design covers three stages, thus making it a great tool to use. It also caters to a variety of topics including Monthly Budget, Financial Metrics, Report. Download this PPT design now to present a convincing pitch that not only emphasizes the topic but also showcases your presentation skills.

In Depth Business Assessment Business Management KPIS Metrics Customers Ppt PowerPoint Presentation Gallery Infographics PDF
This is a in depth business assessment business management kpis metrics customers ppt powerpoint presentation gallery infographics pdf template with various stages. Focus and dispense information on five stages using this creative set, that comes with editable features. It contains large content boxes to add your information on topics like active customers, sold units, total revenues, net profit, profit margin. You can also showcase facts, figures, and other relevant content using this PPT layout. Grab it now.

Monthly Social Media Dashboard Ppt PowerPoint Presentation Model Slide
This is a monthly social media dashboard ppt powerpoint presentation model slide. This is a four stage process. The stages in this process are sales, social events, business, finance, key social metrics.
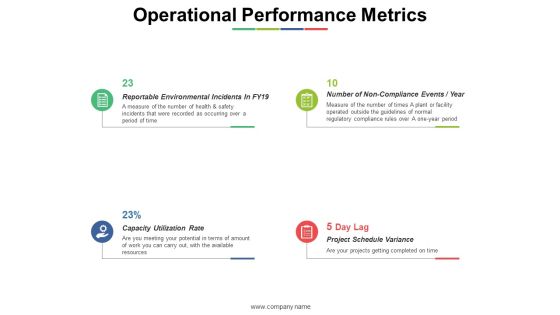
Operational Performance Metrics Ppt PowerPoint Presentation Styles Inspiration
This is a operational performance metrics ppt powerpoint presentation styles inspiration. This is a four stage process. The stages in this process are capacity utilization rate, project schedule variance, operational performance metrics.
Digital Sales Enhancement Metrics With Strategies Elements PDF
The following slide highlights five metrics which are important to track to increase online sales. The metrics included in slide are sales conversion rate, customer acquisition cost, average order value, customer lifetime value, and email opt-in rate and also methods to improve these metrics. Presenting Digital Sales Enhancement Metrics With Strategies Elements PDF to dispense important information. This template comprises five stages. It also presents valuable insights into the topics including Sales Conversion Rate, Customer Acquisition Cost, Average Order Value. This is a completely customizable PowerPoint theme that can be put to use immediately. So, download it and address the topic impactfully.

Social Media Metrics Ppt PowerPoint Presentation Ideas Model
This is a social media metrics ppt powerpoint presentation ideas model. This is a four stage process. The stages in this process are facebook, twitter, youtube, instagram.

Metrics Icon For Customer Service Improvement Portrait PDF
Persuade your audience using this Metrics Icon For Customer Service Improvement Portrait PDF. This PPT design covers four stages, thus making it a great tool to use. It also caters to a variety of topics including Metrics Icon, Customer Service Improvement. Download this PPT design now to present a convincing pitch that not only emphasizes the topic but also showcases your presentation skills.

Consumer Metrics To Track Monzos Performance Formats PDF
This slide provides information about the consumer metrics with respect to the usage of Monzo Platform such as rating on app store, monthly average spend per card per month, amount spend on cards issued etc. This is a consumer metrics to track monzos performance formats pdf template with various stages. Focus and dispense information on five stages using this creative set, that comes with editable features. It contains large content boxes to add your information on topics like consumer metrics to track monzos performance. You can also showcase facts, figures, and other relevant content using this PPT layout. Grab it now.
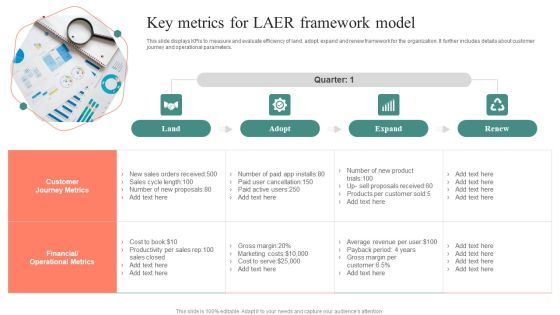
Key Metrics For LAER Framework Model Ideas PDF
This slide displays KPIs to measure and evaluate efficiency of land, adopt, expand and renew framework for the organization. It further includes details about customer journey and operational parameters. Presenting Key Metrics For LAER Framework Model Ideas PDF to dispense important information. This template comprises four stages. It also presents valuable insights into the topics including Customer Journey Metrics, Financial Operational Metrics. This is a completely customizable PowerPoint theme that can be put to use immediately. So, download it and address the topic impactfully.

Major Metrics To Manage Cash Flow Ppt Infographics Portfolio PDF
This slide showcases main performance metric for cashflow management and improvement. The KPIs covered are account receivable turnover, sustainable growth rate, cash conversion cycle and quick ratio. Presenting Major Metrics To Manage Cash Flow Ppt Infographics Portfolio PDF to dispense important information. This template comprises four stages. It also presents valuable insights into the topics including Account Receivable Turnover, Sustainable Growth Rate, Cash Conversion Cycle. This is a completely customizable PowerPoint theme that can be put to use immediately. So, download it and address the topic impactfully.
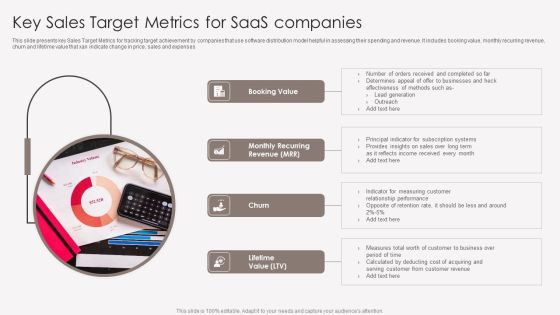
Key Sales Target Metrics For Saas Companies Portrait PDF
This slide presents key Sales Target Metrics for tracking target achievement by companies that use software distribution model helpful in assessing their spending and revenue. It includes booking value, monthly recurring revenue, churn and lifetime value that xan indicate change in price, sales and expenses. Persuade your audience using this Key Sales Target Metrics For Saas Companies Portrait PDF. This PPT design covers four stages, thus making it a great tool to use. It also caters to a variety of topics including Booking Value, Churn, Lifetime Value. Download this PPT design now to present a convincing pitch that not only emphasizes the topic but also showcases your presentation skills.

Supply Chain Management Operational Metrics Financial Guidelines PDF
This is a supply chain management operational metrics financial guidelines pdf. template with various stages. Focus and dispense information on three stages using this creative set, that comes with editable features. It contains large content boxes to add your information on topics like medium, minimum, maximum. You can also showcase facts, figures, and other relevant content using this PPT layout. Grab it now.

Sales And Business Development Action Plan Marketing Future Action Metrics Ppt Infographics Designs Download PDF
Presenting this set of slides with name sales and business development action plan marketing future action metrics ppt infographics designs download pdf. This is a one stage process. The stages in this process are metrics, current, goal, timeline, brand awareness, conversion rate optimization. This is a completely editable PowerPoint presentation and is available for immediate download. Download now and impress your audience.

Administrative Regulation Business Management KPIs Metrics Ppt PowerPoint Presentation Slides Shapes PDF
This is a administrative regulation business management kpis metrics ppt powerpoint presentation slides shapes pdf template with various stages. Focus and dispense information on six stages using this creative set, that comes with editable features. It contains large content boxes to add your information on topics like budgeted income, received income, accounts receivable, budgeted expenses, paid expenses, accounts payable. You can also showcase facts, figures, and other relevant content using this PPT layout. Grab it now.

Business Diagram Key Metrics Required For Different Company Situations PowerPoint Ppt Presentation
Get The Domestics Right With Our Business Diagram Key Metrics Required For Different Company Situations PowerPoint PPT Presentation PowerPoint Templates. Create The Base For Thoughts To Grow. Do Away With Dogmatic Approaches. Establish The Value Of Reason With Our Business PowerPoint Templates.

Administrative Regulation Business Management KPIs Metrics Profit Ppt PowerPoint Presentation Portfolio Brochure PDF
This is a administrative regulation business management kpis metrics profit ppt powerpoint presentation portfolio brochure pdf template with various stages. Focus and dispense information on five stages using this creative set, that comes with editable features. It contains large content boxes to add your information on topics like active customers, sold units, total revenues, net profit, profit margin. You can also showcase facts, figures, and other relevant content using this PPT layout. Grab it now.

Various Kpis Included In Performance Sales Report Graphics PDF
The slide covers the key performance indicators of a report to measure product sales. Various KPIs included are conversion rate, referrals and customer lifetime value. Persuade your audience using this Various Kpis Included In Performance Sales Report Graphics PDF. This PPT design covers three stages, thus making it a great tool to use. It also caters to a variety of topics including Conversion Rate, Referrals, Customer Lifetime Value. Download this PPT design now to present a convincing pitch that not only emphasizes the topic but also showcases your presentation skills.

Search Engine Marketing Estimated Campaign Performance Result Summary Designs PDF
The following slide depicts the forecasted campaign outcomes to assess potential earnings and spending. It includes key performance indicators such as monthly budget, cost per click, website traffic, conversion rate, average conversion value etc. Do you know about Slidesgeeks Search Engine Marketing Estimated Campaign Performance Result Summary Designs PDF These are perfect for delivering any kind od presentation. Using it, create PowerPoint presentations that communicate your ideas and engage audiences. Save time and effort by using our pre-designed presentation templates that are perfect for a wide range of topic. Our vast selection of designs covers a range of styles, from creative to business, and are all highly customizable and easy to edit. Download as a PowerPoint template or use them as Google Slides themes.
Social Media And Word Of Mouth Metrics Ppt Powerpoint Presentation Icon Portfolio
This is a social media and word of mouth metrics ppt powerpoint presentation icon portfolio. This is a ten stage process. The stages in this process are financial, marketing, analysis, investment, business.

Identifying Key Metrics To Measure Success Of Our Marketing Efforts Download PDF
Purpose of the following slide is to identify the key metrics that the organization can use to track performance of their marketing efforts, these metrics are cost of acquisition, click through rate etc. Presenting Identifying Key Metrics To Measure Success Of Our Marketing Efforts Download PDF to provide visual cues and insights. Share and navigate important information on one stages that need your due attention. This template can be used to pitch topics like Social Media, Cost Per Acquisition, Key Marketing Metrics. In addtion, this PPT design contains high resolution images, graphics, etc, that are easily editable and available for immediate download.

Operational Performance Metrics Quality Index Ppt PowerPoint Presentation Summary Layout Ideas
This is a operational performance metrics quality index ppt powerpoint presentation summary layout ideas. This is a four stage process. The stages in this process are earned value metrics, order fulfilment cycle time, quality index, delivery in full on time rate.

Icon For Monthly Financial Metrics Report Showcasing Company Statistics Ideas PDF
Presenting Icon For Monthly Financial Metrics Report Showcasing Company Statistics Ideas PDF to dispense important information. This template comprises three stages. It also presents valuable insights into the topics including Monthly Financial, Metrics Report Showcasing, Company Statistics. This is a completely customizable PowerPoint theme that can be put to use immediately. So, download it and address the topic impactfully.
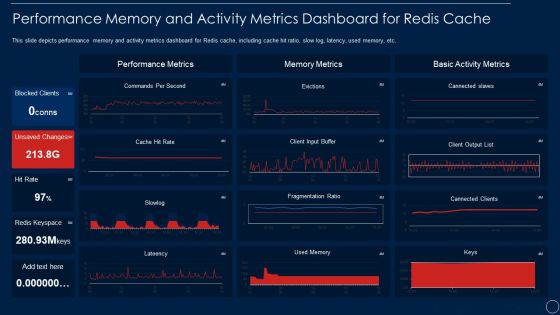
Redis Cache Data Structure IT Performance Memory And Activity Metrics Introduction PDF
This slide depicts performance memory and activity metrics dashboard for Redis cache, including cache hit ratio, slow log, latency, used memory, etc. This is a redis cache data structure it performance memory and activity metrics introduction pdf template with various stages. Focus and dispense information on one stages using this creative set, that comes with editable features. It contains large content boxes to add your information on topics like performance memory and activity metrics dashboard for redis cache. You can also showcase facts, figures, and other relevant content using this PPT layout. Grab it now.
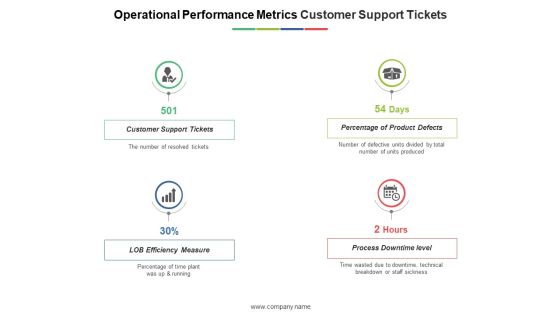
Operational Performance Metrics Customer Support Tickets Ppt PowerPoint Presentation Outline Graphics Design
This is a operational performance metrics customer support tickets ppt powerpoint presentation outline graphics design. This is a four stage process. The stages in this process are customer support tickets, percentage of product defects, lob efficiency measure, process downtime level.

Metrics To Improve Cash Flow Tracking Icon Ppt Inspiration Outfit PDF
Persuade your audience using this Metrics To Improve Cash Flow Tracking Icon Ppt Inspiration Outfit PDF. This PPT design covers three stages, thus making it a great tool to use. It also caters to a variety of topics including Metrics To Improve, Cash Flow, Tracking Icon. Download this PPT design now to present a convincing pitch that not only emphasizes the topic but also showcases your presentation skills.

Cloud Content Delivery Network Key CDN Metrics To Watch Background PDF
This slide represents the key CDN metrics to watch while looking for a CDN provider, such as the time it takes DNS to reply. Explore a selection of the finest Cloud Content Delivery Network Key CDN Metrics To Watch Background PDF here. With a plethora of professionally designed and pre made slide templates, you can quickly and easily find the right one for your upcoming presentation. You can use our Cloud Content Delivery Network Key CDN Metrics To Watch Background PDF to effectively convey your message to a wider audience. Slidegeeks has done a lot of research before preparing these presentation templates. The content can be personalized and the slides are highly editable. Grab templates today from Slidegeeks.
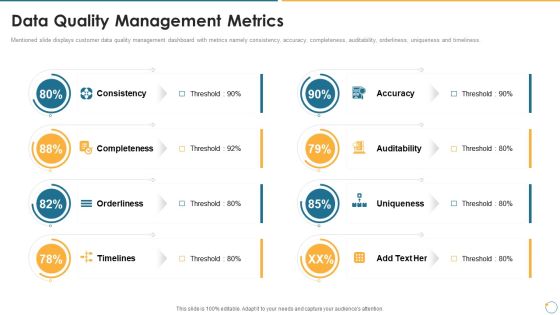
Collection Of Quality Assurance PPT Data Quality Management Metrics Information PDF
Mentioned slide displays customer data quality management dashboard with metrics namely consistency, accuracy, completeness, auditability, orderliness, uniqueness and timeliness. This is a collection of quality assurance ppt data quality management metrics information pdf template with various stages. Focus and dispense information on eight stages using this creative set, that comes with editable features. It contains large content boxes to add your information on topics like accuracy, auditability, consistency, completeness, uniqueness. You can also showcase facts, figures, and other relevant content using this PPT layout. Grab it now.
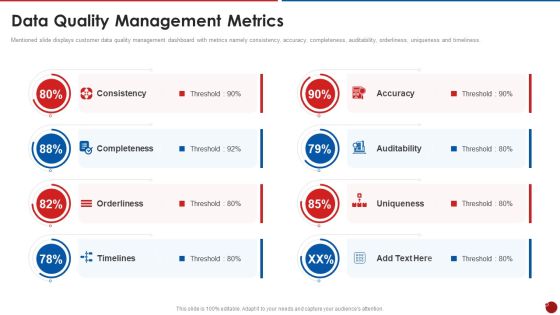
Quality Assurance Templates Set 2 Data Quality Management Metrics Pictures PDF
Mentioned slide displays customer data quality management dashboard with metrics namely consistency, accuracy, completeness, auditability, orderliness, uniqueness and timeliness. Presenting quality assurance templates set 2 data quality management metrics pictures pdf to provide visual cues and insights. Share and navigate important information on eight stages that need your due attention. This template can be used to pitch topics like consistency, completeness, orderliness, timelines, accuracy. In addtion, this PPT design contains high resolution images, graphics, etc, that are easily editable and available for immediate download.

QA Plan Set 2 Data Quality Management Metrics Ppt PowerPoint Presentation Gallery Background Image PDF
Mentioned slide displays customer data quality management dashboard with metrics namely consistency, accuracy, completeness, auditability, orderliness, uniqueness and timeliness. Presenting QA Plan Set 2 Data Quality Management Metrics Ppt PowerPoint Presentation Gallery Background Image PDF to provide visual cues and insights. Share and navigate important information on eight stages that need your due attention. This template can be used to pitch topics like Accuracy Completeness, Orderliness Timelines. In addtion, this PPT design contains high resolution images, graphics, etc, that are easily editable and available for immediate download.
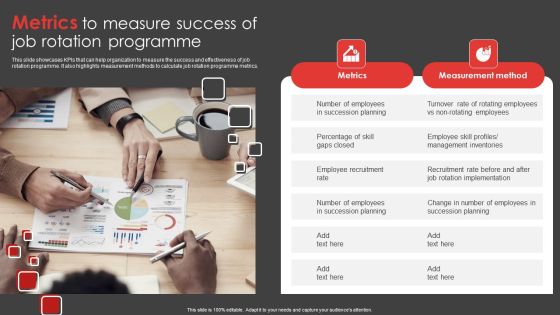
Job Rotation Plan For Staff Metrics To Measure Success Of Job Rotation Programme Diagrams PDF
This slide showcases KPIs that can help organization to measure the success and effectiveness of job rotation programme. It also highlights measurement methods to calculate job rotation programme metrics. Slidegeeks is one of the best resources for PowerPoint templates. You can download easily and regulate Job Rotation Plan For Staff Metrics To Measure Success Of Job Rotation Programme Diagrams PDF for your personal presentations from our wonderful collection. A few clicks is all it takes to discover and get the most relevant and appropriate templates. Use our Templates to add a unique zing and appeal to your presentation and meetings. All the slides are easy to edit and you can use them even for advertisement purposes.

Capital Markets Dashboard Ppt Powerpoint Slide Background
This is a capital markets dashboard ppt powerpoint slide background. This is a three stage process. The stages in this process are weekly sales, product inventory, key performance indicators.

Customer Satisfaction Template 1 Ppt PowerPoint Presentation Portfolio Graphics Example
This is a customer satisfaction template 1 ppt powerpoint presentation portfolio graphics example. This is a three stage process. The stages in this process are overall satisfaction with service, satisfaction with value for money, overall satisfaction with relationship, key performance indicators, business, percentage.
Key Financial Ratios Template 2 Ppt PowerPoint Presentation Icon Slide Download
This is a key financial ratios template 2 ppt powerpoint presentation icon slide download. This is a six stage process. The stages in this process are price to earnings, debt to equity ratio, current ratio, return on, equity, return on , assets, return on investment.

Factory Costs Components Cost Sheet Ratio Cont Ppt Gallery Images PDF
These four key performance indicator calculates a gross profit margin .This is a factory costs components cost sheet ratio cont ppt gallery images pdf. template with various stages. Focus and dispense information on four stages using this creative set, that comes with editable features. It contains large content boxes to add your information on topics like direct material cost per unit, gross profit margin, direct labor cost per unit, sales volume. You can also showcase facts, figures, and other relevant content using this PPT layout. Grab it now.
 Home
Home