Finance Icons

Small Business Structure Chart Example Powerpoint Slide Background Image
This is a small business structure chart example powerpoint slide background image. This is a six stage process. The stages in this process are financial manager, sales, distributions, finance, operations, general manager.

Hiring Plan Bar Chart Powerpoint Slide Background Image
This is a hiring plan bar chart powerpoint slide background image. This is a five stage process. The stages in this process are engineering, sales, marketing, product, support, finance.

Volume High Low Close Chart Ppt PowerPoint Presentation Shapes
This is a volume high low close chart ppt powerpoint presentation shapes. This is a five stage process. The stages in this process are business, strategy, analysis, marketing, finance, growth.

Donut Pie Chart Ppt PowerPoint Presentation Infographic Template Layout Ideas
This is a donut pie chart ppt powerpoint presentation infographic template layout ideas. This is a five stage process. The stages in this process are product, business, finance, marketing.

High Low Close Chart Ppt PowerPoint Presentation Styles Display
This is a high low close chart ppt powerpoint presentation styles display. This is a ten stage process. The stages in this process are high, volume, low, close, finance.

High Low Close Chart Ppt PowerPoint Presentation Show Ideas
This is a high low close chart ppt powerpoint presentation show ideas. This is a ten stage process. The stages in this process are high, volume, low, close, finance.

Stack Area Chart Ppt PowerPoint Presentation Example File
This is a stack area chart ppt powerpoint presentation example file. This is a two stage process. The stages in this process are product, sales in percentage, percentage, finance.

Scatter Bubble Chart Ppt PowerPoint Presentation Styles Objects
This is a scatter bubble chart ppt powerpoint presentation styles objects. This is a two stage process. The stages in this process are product, in price, highest sale, percentage, finance.

Scatter Bubble Chart Template Ppt PowerPoint Presentation Professional Background
This is a scatter bubble chart template ppt powerpoint presentation professional background. This is a six stage process. The stages in this process are business, marketing, strategy, planning, finance.

Marketing Objectives Diagram Presentation Portfolio
This is a marketing objectives diagram presentation portfolio. This is a six stage process. The stages in this process are diversification, human resource, finance, improving profitability, corporate objectives, market share.
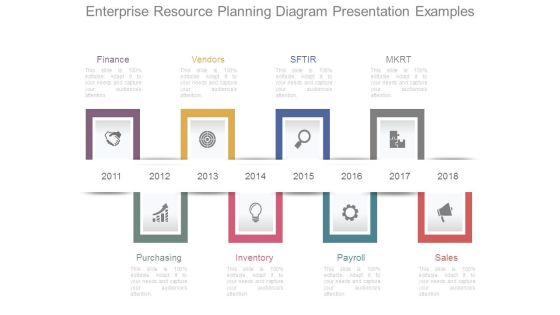
Enterprise Resource Planning Diagram Presentation Examples
This is a enterprise resource planning diagram presentation examples. This is a eight stage process. The stages in this process are finance, purchasing, vendors, inventory, sftir, payroll, mkrt, sales.

Cost Performance Index Ppt PowerPoint Presentation Infographics Themes
This is a cost performance index ppt powerpoint presentation infographics themes. This is a two stage process. The stages in this process are cost performance index, ev term, value, finance.

Data Collection And Analysis Control Chart Ppt PowerPoint Presentation Slide Download
This is a data collection and analysis control chart ppt powerpoint presentation slide download. This is a three stage process. The stages in this process are line chart, finance, marketing, management, investment.

Scorecard Management Diagram Ppt Samples Download
This is a scorecard management diagram ppt samples download. This is a five stage process. The stages in this process are financial goals, growth, customer metrics, budget finance, internal metrics.
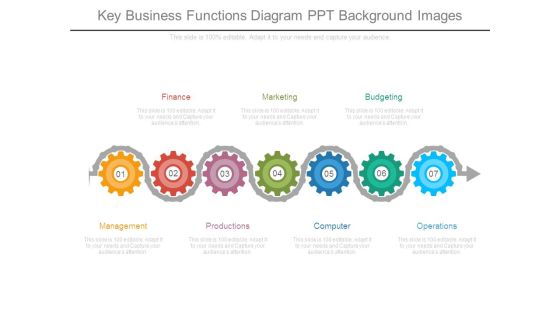
Key Business Functions Diagram Ppt Background Images
This is a key business functions diagram ppt background images. This is a seven stage process. The stages in this process are finance, marketing, budgeting, management, productions, computer, operations.
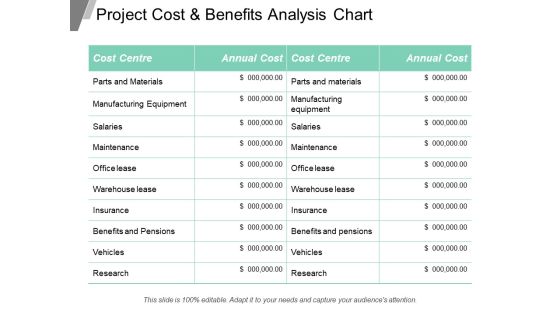
Project Cost And Benefits Analysis Chart Ppt Powerpoint Presentation Inspiration Slideshow
This is a balance scale with cost and benefits ppt powerpoint presentation show. This is a two stage process. The stages in this process are business, finance, marketing, strategy, compare, management.

Retail Business Management Diagram Ppt Slide
This is a retail business management diagram ppt slide. This is a nine stage process. The stages in this process are product brand mgmt, marketing, scm, mis, store operations sales, human resources, store design and vm, accounting finance, merchandising.
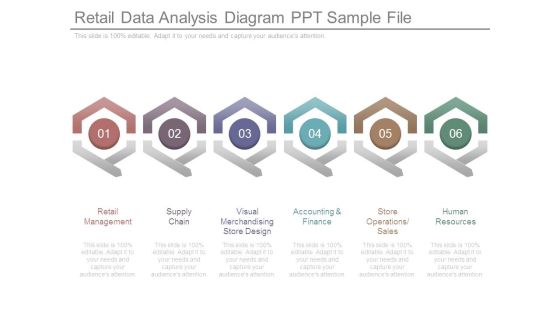
Retail Data Analysis Diagram Ppt Sample File
This is a retail data analysis diagram ppt sample file. This is a six stage process. The stages in this process are retail management, supply chain, visual merchandising store design, accounting and finance, store operations sales, human resources.

Retail Management Process Diagram Powerpoint Presentation
This is a retail management process diagram powerpoint presentation. This is a five stage process. The stages in this process are human resources, brand management, accounting and finance, invoice management, stock management.

Retail Business Strategy Diagram Presentation Slides
This is a retail business strategy diagram presentation slides. This is a five stage process. The stages in this process are product brand mgmt, marketing, store operations sales, human resources, accounting finance.

Business Success Global PowerPoint Templates And PowerPoint Themes 0512
Microsoft Powerpoint Templates and Background with business-Business Success Global PowerPoint Templates And PowerPoint Themes 0512-These PowerPoint designs and slide layouts can be used for themes relating to -Business success global, background, success, finance, marketing, abstract

Business Target Gearwheels PowerPoint Templates And PowerPoint Themes 0512
Microsoft Powerpoint Templates and Background with colorful gears-Business Target Gearwheels PowerPoint Templates And PowerPoint Themes 0512-These PowerPoint designs and slide layouts can be used for themes relating to -Business gearwheels, abstract, background, design, finance, teamwork

Global Business Abstract PowerPoint Templates And PowerPoint Themes 0512
Microsoft Powerpoint Templates and Background with business-Global Business Abstract PowerPoint Templates And PowerPoint Themes 0512-These PowerPoint designs and slide layouts can be used for themes relating to -Business, background, success, finance, marketing, abstract
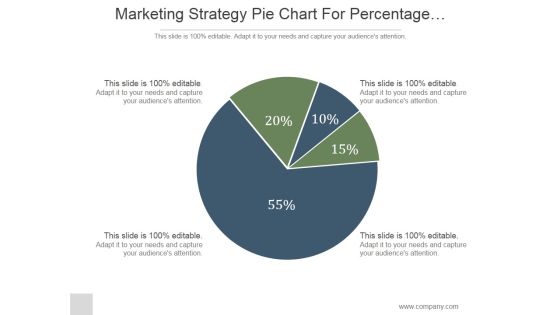
Marketing Strategy Pie Chart For Percentage Comparison Ppt PowerPoint Presentation Ideas
This is a marketing strategy pie chart for percentage comparison ppt powerpoint presentation ideas. This is a four stage process. The stages in this process are marketing, pie, strategy, finance, percentage.

Gears Metaphor PowerPoint Templates And PowerPoint Themes 0512
Microsoft Powerpoint Templates and Background with group of gears-These templates can be used for presentations relating to-Group of gears, background, business, success, teamwork, finance-Gears Metaphor PowerPoint Templates And PowerPoint Themes 0512
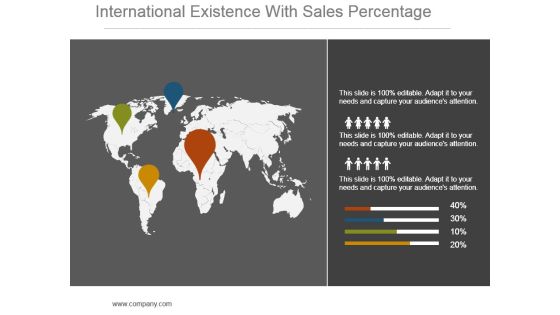
International Existence With Sales Percentage Powerpoint Slide Themes
This is a international existence with sales percentage powerpoint slide themes. This is a four stage process. The stages in this process are globe, finance, pointers, business, marketing, global.

Examples Of Scorecards Dashboard Diagram Powerpoint Show
This is a examples of scorecards dashboard diagram powerpoint show. This is a four stage process. The stages in this process are finance, education and growth, customer relationship, process.
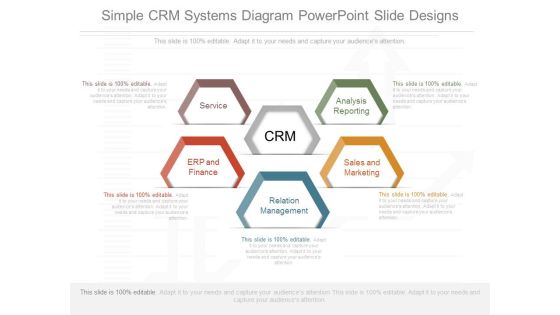
Simple Crm Systems Diagram Powerpoint Slide Designs
This is a simple crm systems diagram powerpoint slide designs. This is a five stage process. The stages in this process are service, erp and finance, analysis reporting, sales and marketing, relation management.
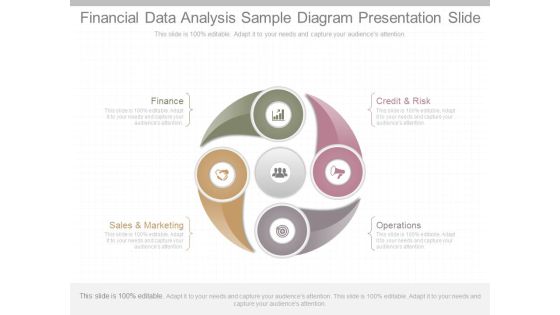
Financial Data Analysis Sample Diagram Presentation Slide
This is a financial data analysis sample diagram presentation slide. This is a four stage process. The stages in this process are finance, sales and marketing, operations, credit and risk.
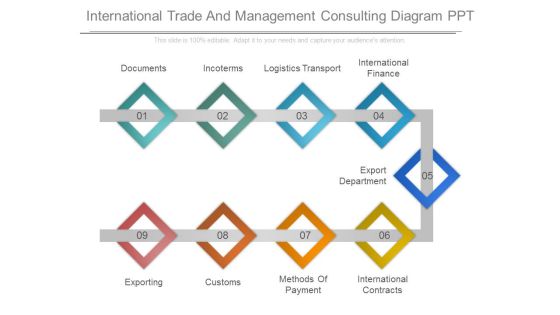
International Trade And Management Consulting Diagram Ppt
This is a international trade and management consulting diagram ppt. This is a nine stage process. The stages in this process are documents, incoterms, logistics transport, international finance, export department, exporting, customs, methods of payment, international contracts.
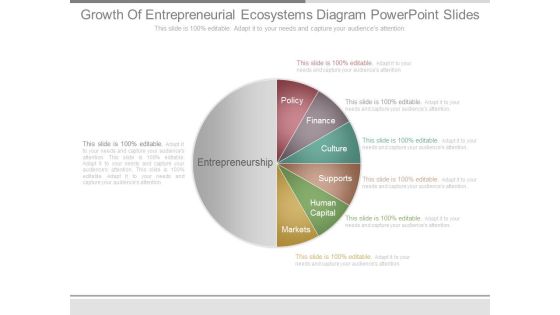
Growth Of Entrepreneurial Ecosystems Diagram Powerpoint Slides
This is a growth of entrepreneurial ecosystems diagram powerpoint slides. This is a seven stage process. The stages in this process are entrepreneurship, policy, finance, culture, supports, human capital, markets.

Erp Support Services Diagram Ppt Slides Templates
This is a erp support services diagram ppt slides templates. This is a six stage process. The stages in this process are management, erp support, procurement, finance, human, supply chain, idea.

Business Competitors Analysis Diagram Sample Ppt Files
This is a business competitors analysis diagram sample ppt files. This is a eight stage process. The stages in this process are product, service, finance, channel, brand, research, success, benefits, competitors analysis.
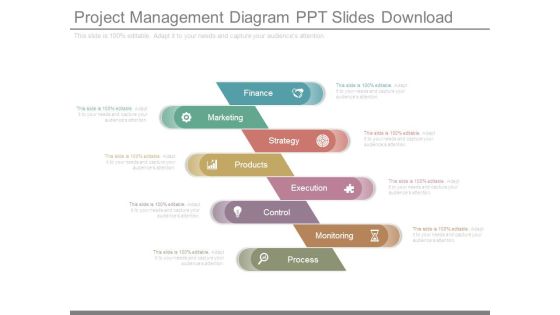
Project Management Diagram Ppt Slides Download
This is a project management diagram ppt slides download. This is a eight stage process. The stages in this process are finance, marketing, strategy, products, execution, control, monitoring, process.

Cash Flow Statement Kpis Tabular Form Ppt PowerPoint Presentation Slides Themes
This is a cash flow statement kpis tabular form ppt powerpoint presentation slides themes. This is a four stage process. The stages in this process are finance, marketing, management, investment, analysis.

Example Of Management Strategy For Information Technology Diagram Presentation Images
This is a example of management strategy for information technology diagram presentation images. This is a six stage process. The stages in this process are human resources, finance, sales and marketing, admin and operations, production, shipping, information technology.
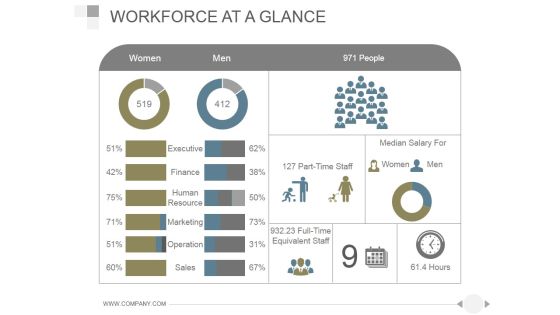
Workforce At A Glance Ppt PowerPoint Presentation Diagrams
This is a workforce at a glance ppt powerpoint presentation diagrams. This is a two stage process. The stages in this process are women, men, people, executive, finance, human resource, marketing.

Initial Half Yearly Business Plan Gantt Chart Graphics PDF
This slide elaborates the roadmap for making business plan for the better workflow of company. It includes strategy, finance, personnel, customers and financial areas. Pitch your topic with ease and precision using this Initial Half Yearly Business Plan Gantt Chart Graphics PDF. This layout presents information on Finance, Startegy, Customers. It is also available for immediate download and adjustment. So, changes can be made in the color, design, graphics or any other component to create a unique layout.

Lead Consultant Roles And Responsibilities Example Ppt Diagrams
This is a lead consultant roles and responsibilities example ppt diagrams. This is a one stage process. The stages in this process are business, idea, strategy, project, cloud, marketing, growth, company, brand, finance, new.
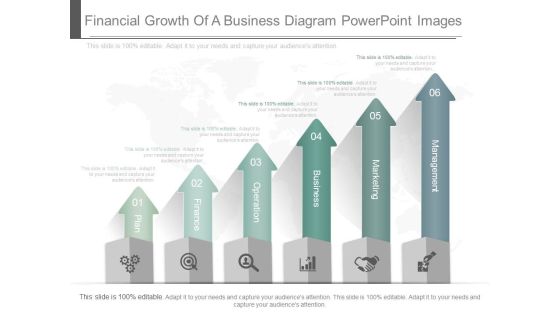
Financial Growth Of A Business Diagram Powerpoint Images
This is a financial growth of a business diagram powerpoint images. This is a six stage process. The stages in this process are plan, finance, operation, business, marketing, management.\n\n\n
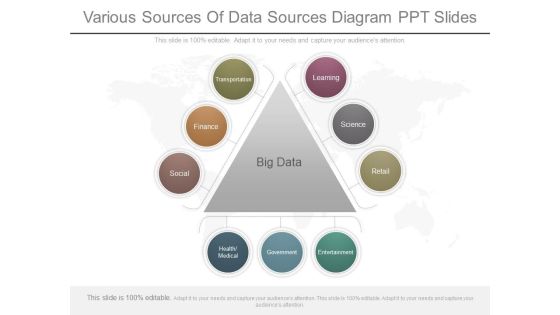
Various Sources Of Data Sources Diagram Ppt Slides
This is a various sources of data sources diagram ppt slides. This is a three stage process. The stages in this process are learning, science, retail, entertainment, government, health medical, social, finance, transportation.
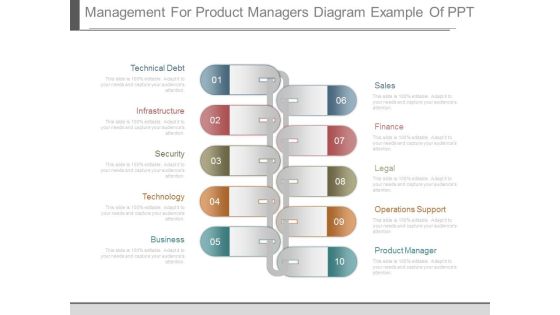
Management For Product Managers Diagram Example Of Ppt
This is a management for product managers diagram example of ppt. This is a ten stage process. The stages in this process are technical debt, infrastructure, security, technology, business, sales, finance, legal, operations support, product manager.
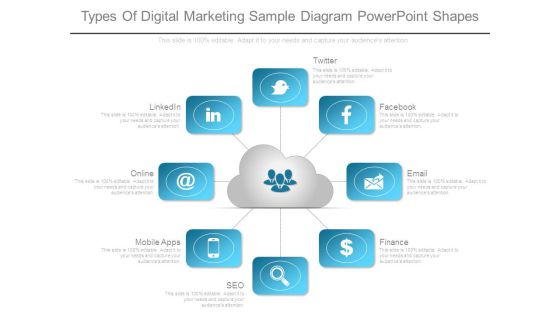
Types Of Digital Marketing Sample Diagram Powerpoint Shapes
This is a types of digital marketing sample diagram powerpoint shapes. This is a eight stage process. The stages in this process are linkedin, online, mobile apps, seo, finance, email, facebook, twitter.

Steps Of Business Advisory Sample Diagram Presentation Outline
This is a steps of business advisory sample diagram presentation outline. This is a five stage process. The stages in this process are envisioning and alignment, planning for change, driving change, finance, marketing.
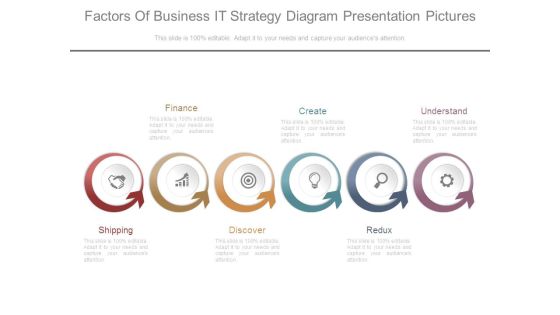
Factors Of Business It Strategy Diagram Presentation Pictures
This is a factors of business it strategy diagram presentation pictures. This is a six stage process. The stages in this process are finance, create, understand, shipping, discover, redux.

The Allure Of Matrix Management Diagram Powerpoint Slides
This is a the allure of matrix management diagram powerpoint slides. This is a eight stage process. The stages in this process are context, community, control, clarity, research, production, sales, finance.

Market Trends Percentage Spending By Region Ppt PowerPoint Presentation Diagrams
This is a market trends percentage spending by region ppt powerpoint presentation diagrams. This is a seven stage process. The stages in this process are business, marketing, management, planning, finance.

Changes In Competitive Environment Template 2 Ppt PowerPoint Presentation Infographic Template Themes
This is a changes in competitive environment template 2 ppt powerpoint presentation infographic template themes. This is a four stage process. The stages in this process are weekly, monthly, year, finance, percentage.
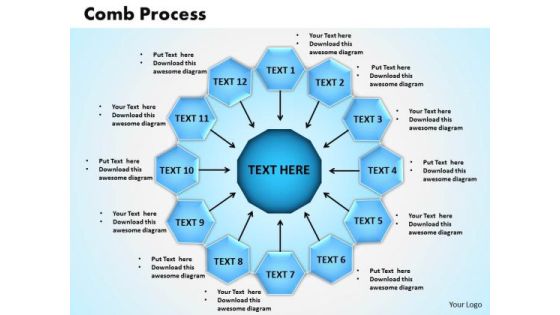
PowerPoint Process Comb Process Business Ppt Slides
PowerPoint Process Comb Process Business PPT Slides-Use this graphics to organize major factors like Accountancy, Advertising, Finance, Stock Exchange, Insurance, Marketing ,Management, Real Estate, Trade, Transportation, Web Commerce, Economics etc.-PowerPoint Process Comb Process Business PPT Slides

PowerPoint Circular Arrows Comparison Process Templates Backgrounds For Slides
3d, arrow, arrow button, arrow vector, art, background, blank, blue, business, button, chart, clip, decoration, diagram, direction, drop, element, empty, finance, flow, four, graph, graphic, green, illustration, isometric, presentation, process, red, shape, sign, step, symbol, template, text, vector, white, yellow

Corporate Resilience Plan With Various Initiatives Themes PDF
The following slide highlights the business resilience plan with initiatives. It also provides information related to business areas such as customers, goods and services, employees and finance. Showcasing this set of slides titled Corporate Resilience Plan With Various Initiatives Themes PDF. The topics addressed in these templates are Goods And Services, Employees, Finance. All the content presented in this PPT design is completely editable. Download it and make adjustments in color, background, font etc. as per your unique business setting.

Bar Graph Percentage Product Ppt PowerPoint Presentation Styles Good
This is a bar graph percentage product ppt powerpoint presentation styles good. This is a three stage process. The stages in this process are area chart, finance, marketing, management, investment.

Cycle Time By Month Ppt PowerPoint Presentation Visual Aids Ideas
This is a cycle time by month ppt powerpoint presentation visual aids ideas. This is a two stage process. The stages in this process are line chart, finance, marketing, management, investment.

Bar Graph To Show Company Sales Budget Ppt PowerPoint Presentation Sample
This is a bar graph to show company sales budget ppt powerpoint presentation sample. This is a four stage process. The stages in this process are business, finance, growth, success, marketing, arrow.

Stacked Bar Ppt PowerPoint Presentation Model Graphics
This is a stacked bar ppt powerpoint presentation model graphics. This is a two stage process. The stages in this process are stacked bar, product, chart and graph, finance, business.

Clustered Column Ppt PowerPoint Presentation Model File Formats
This is a clustered column ppt powerpoint presentation model file formats. This is a two stage process. The stages in this process are column chart, business, product, compare, finance.
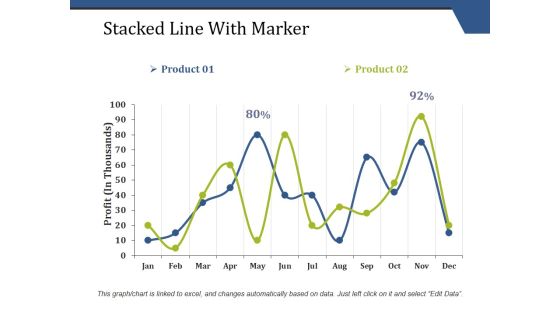
Stacked Line With Marker Ppt PowerPoint Presentation Model Background
This is a stacked line with marker ppt powerpoint presentation model background. This is a two stage process. The stages in this process are business, line chart, finance, growth, analysis.

Continual Service Improvement Template 1 Ppt PowerPoint Presentation Ideas Example Topics
This is a continual service improvement template 1 ppt powerpoint presentation ideas example topics. This is a four stage process. The stages in this process are business, marketing, combo chart, finance, graph.
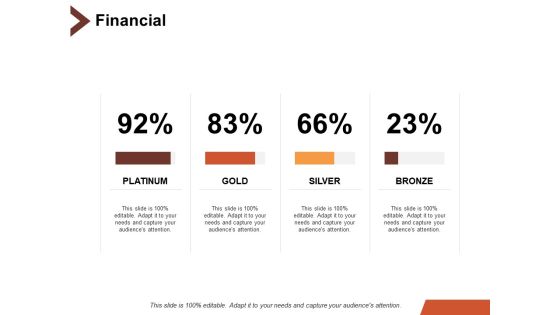
Financial Business Marketing Ppt PowerPoint Presentation Slides Aids
This is a financial business marketing ppt powerpoint presentation slides aids. This is a four stage process. The stages in this process are bar chart, finance, marketing, business, analysis.
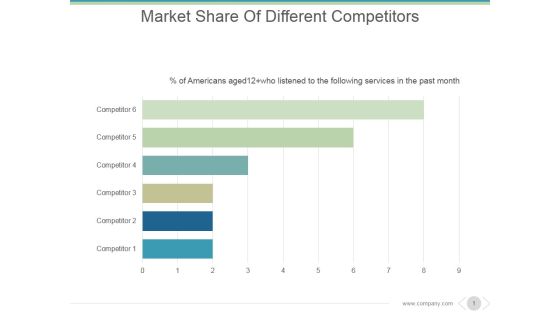
Market Share Of Different Competitors Ppt PowerPoint Presentation Inspiration
This is a market share of different competitors ppt powerpoint presentation inspiration. This is a six stage process. The stages in this process are competitor, business, marketing, graph, finance.
 Home
Home