Finance Icons

Business Process Diagram Chart Six Sided Multicolor Hexagon PowerPoint Slides
We present our business process diagram chart six sided multicolor hexagon PowerPoint Slides.Use our Circle Charts PowerPoint Templates because You have gained great respect for your brilliant ideas. Use our PowerPoint Templates and Slides to strengthen and enhance your reputation. Use our Ring Charts PowerPoint Templates because You can Raise a toast with our PowerPoint Templates and Slides. Spread good cheer amongst your audience. Present our Flow Charts PowerPoint Templates because Our PowerPoint Templates and Slides team portray an attitude of elegance. Personify this quality by using them regularly. Present our Process and Flows PowerPoint Templates because It can Leverage your style with our PowerPoint Templates and Slides. Charm your audience with your ability. Download our Marketing PowerPoint Templates because Watching this your Audience will Grab their eyeballs, they wont even blink.Use these PowerPoint slides for presentations relating to Business, color, colorful, cycle, executive, icon, illustration, management, model, numbers, organization, procedure, red, resource, sequence, sequential, seven, strategy, symbol, process, process and flows, circle process, circle, process, steps. The prominent colors used in the PowerPoint template are Purple, Gray, White. People tell us our business process diagram chart six sided multicolor hexagon PowerPoint Slides will help you be quick off the draw. Just enter your specific text and see your points hit home. PowerPoint presentation experts tell us our executive PowerPoint templates and PPT Slides help you meet deadlines which are an element of today's workplace. Just browse and pick the slides that appeal to your intuitive senses. Presenters tell us our business process diagram chart six sided multicolor hexagon PowerPoint Slides are the best it can get when it comes to presenting. Use our icon PowerPoint templates and PPT Slides are visually appealing. Customers tell us our business process diagram chart six sided multicolor hexagon PowerPoint Slides are specially created by a professional team with vast experience. They diligently strive to come up with the right vehicle for your brilliant Ideas. People tell us our management PowerPoint templates and PPT Slides are specially created by a professional team with vast experience. They diligently strive to come up with the right vehicle for your brilliant Ideas.

Combo Chart Ppt PowerPoint Presentation Portfolio Themes
This is a combo chart ppt powerpoint presentation portfolio themes. This is a three stage process. The stages in this process are market size, product, management, finance, chart, marketing.

Stock Photo House Made Of American Flag PowerPoint Slide
This image slide displays green 3d house made of USA Flag. This image contains graphics of a house made of US flag to represent concepts of finance, property and real estate. This unique image makes your presentations more professional.

Dollar Symbol Business PowerPoint Templates And PowerPoint Themes 1012
Dollar Symbol Business PowerPoint Templates And PowerPoint Themes 1012-Develop competitive advantage with our above template which contains a diagram showing 3d green dollars which signifies business growth which is being illustrated by the bar graph. It portrays the concept of finance, profit, loss, finance, investment etc. This image has been conceived to enable you to emphatically communicate your ideas in your Business and Marketing PPT presentations. The structure of our templates allows you to effectively highlight the key issues concerning the growth of your business.-Dollar Symbol Business PowerPoint Templates And PowerPoint Themes 1012-This PowerPoint template can be used for presentations relating to-Dollor, Symbol, Signs, Finance, Shapes, Metaphor
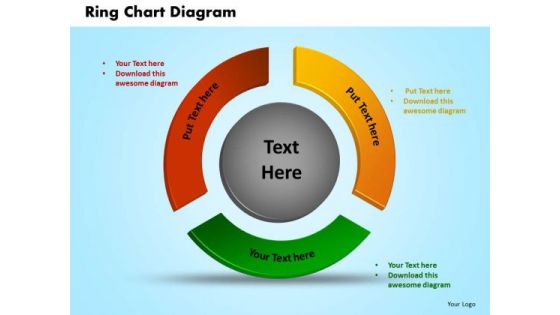
PowerPoint Process Ring Chart Diagram Marketing Ppt Template
PowerPoint Process Ring Chart Diagram Marketing PPT template-This Business oriented PowerPoint Diagram portrays the concept of Inter-related approaches. This Diagram forms Ring which signifies business, finance, investment, strategy, future, Marketing etc.-PowerPoint Process Ring Chart Diagram Marketing PPT template
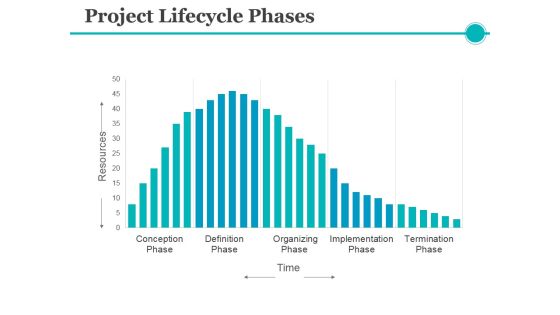
Project Lifecycle Phases Template 2 Ppt PowerPoint Presentation File Information
This is a project lifecycle phases template 2 ppt powerpoint presentation file information. This is a five stage process. The stages in this process are resources, time, business, finance.
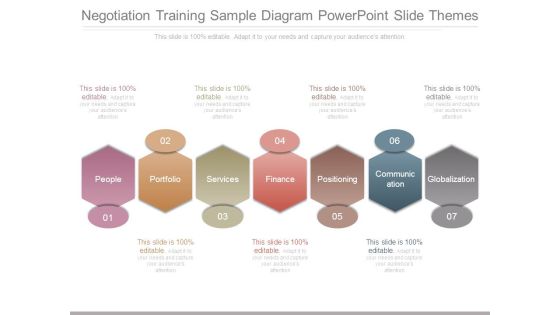
Negotiation Training Sample Diagram Powerpoint Slide Themes
This is a negotiation training sample diagram powerpoint slide themes. This is a seven stage process. The stages in this process are people, portfolio, services, finance, positioning, communication, globalization.

Area Chart Investment Ppt PowerPoint Presentation Gallery Example Introduction
This is a area chart investment ppt powerpoint presentation gallery example introduction. This is a three stage process. The stages in this process are area chart, finance, marketing, management, investment.

Area Chart Ppt PowerPoint Presentation Layouts Images
This is a area chart ppt powerpoint presentation layouts images. This is a two stage process. The stages in this process are product, sales in percentage, area chart, percentage, finance.

Column Chart Ppt PowerPoint Presentation Layouts Vector
This is a column chart ppt powerpoint presentation layouts vector. This is a two stage process. The stages in this process are product, column chart, bar graph, percentage, finance.

Bar Chart Ppt PowerPoint Presentation File Model
This is a bar chart ppt powerpoint presentation file model. This is a two stage process. The stages in this process are business, strategy, marketing, analysis, finance, bar graph.
Risk Hazard Toxic Material Wooden Table Ppt PowerPoint Presentation Complete Deck
Share a great deal of information on the topic by deploying this person speaking icon speech bubble management ppt powerpoint presentation complete deck. Support your ideas and thought process with this prefabricated set. It includes a set of twelve slides, all fully modifiable and editable. Each slide can be restructured and induced with the information and content of your choice. You can add or remove large content boxes as well, to make this PPT slideshow more personalized. Its high-quality graphics and visuals help in presenting a well-coordinated pitch. This PPT template is also a resourceful tool to take visual cues from and implement the best ideas to help your business grow and expand. The main attraction of this well-formulated deck is that everything is editable, giving you the freedom to adjust it to your liking and choice. Changes can be made in the background and theme as well to deliver an outstanding pitch. Therefore, click on the download button now to gain full access to this multifunctional set.

Line Chart Ppt PowerPoint Presentation Infographics Infographics
This is a line chart ppt powerpoint presentation infographics infographics. This is a two stage process. The stages in this process are product, sales in percentage, financial year, line chart, finance.

Scatter Chart Ppt PowerPoint Presentation Model Influencers
This is a scatter chart ppt powerpoint presentation model influencers. This is a one stage process. The stages in this process are scatter chart, analysis, finance, marketing, business, growth.
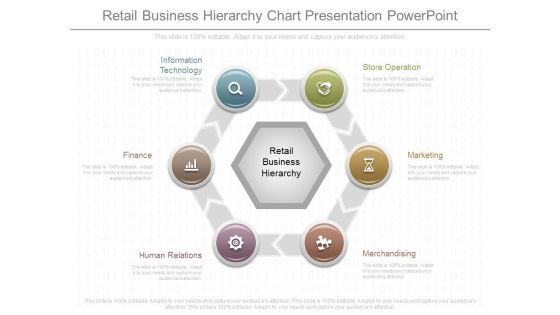
Retail Business Hierarchy Chart Presentation Powerpoint
This is a retail business hierarchy chart presentation powerpoint. This is a six stage process. The stages in this process are store operation, marketing, merchandising, human relations, finance, information technology.
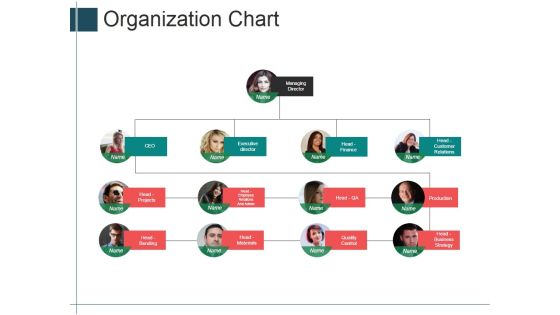
Organization Chart Ppt PowerPoint Presentation Portfolio Shapes
This is a organization chart ppt powerpoint presentation portfolio shapes. This is a four stage process. The stages in this process are managing director, executive director, head finance, head projects.
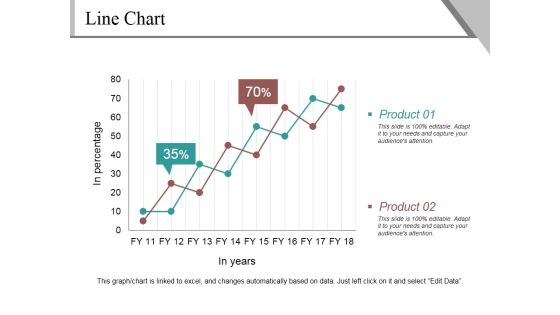
Line Chart Ppt PowerPoint Presentation Infographics Example
This is a line chart ppt powerpoint presentation infographics example. This is a two stage process. The stages in this process are product, in percentage, in years, finance, growth.
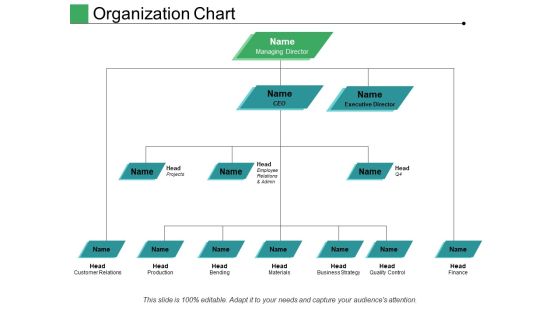
Organization Chart Ppt PowerPoint Presentation Pictures Structure
This is a organization chart ppt powerpoint presentation pictures structure. This is a three stage process. The stages in this process are managing director, executive director, head, ceo, finance.

Benefits Of Business Intelligence Layout Ppt Slide
This is a benefits of business intelligence layout ppt slide. This is a three stage process. The stages in this process are accounting and budgeting system, financial and standard reporting, operational and transactional system, business operations, business intelligence, finance, technology.

Bubble Chart Enterprise Model Canvas Ppt PowerPoint Presentation File Structure
This is a bubble chart enterprise model canvas ppt powerpoint presentation file structure. This is a two stage process. The stages in this process are bubble chart, finance, marketing, strategy, analysis, investment.

Area Chart Product Percentage Ppt PowerPoint Presentation Infographic Template Slide
This is a area chart product percentage ppt powerpoint presentation infographic template slide. This is a four stage process. The stages in this process are area chart, finance, marketing, management, investment.
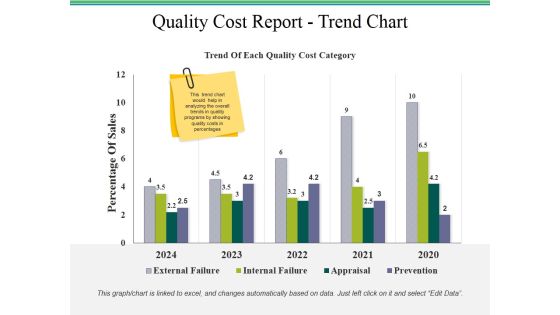
Quality Cost Report Trend Chart Ppt PowerPoint Presentation Styles Templates
This is a quality cost report trend chart ppt powerpoint presentation styles templates. This is a two stage process. The stages in this process are quality cost report, business, finance, marketing, strategy.

Data Collection Scatter Diagram Ppt PowerPoint Presentation Gallery Graphics Example
This is a data collection scatter diagram ppt powerpoint presentation gallery graphics example. This is a three stage process. The stages in this process are line chart, finance, marketing, management, investment.

Net Fixed Assest Turnover Ppt PowerPoint Presentation Infographics Themes
This is a net fixed assest turnover ppt powerpoint presentation infographics themes. This is a two stage process. The stages in this process are turnover, business, marketing, management, finance.

Banking Facilities Management Diagram Ppt Design
This is a banking facilities management diagram ppt design. This is a seven stage process. The stages in this process are real estate, maintenance, conservation, continuity, operations, quality, finance.

Donut Pie Chart Graph Ppt PowerPoint Presentation File Styles
This is a donut pie chart graph ppt powerpoint presentation file styles. This is a three stage process. The stages in this process are finance, marketing, management, investment, analysis.

Donut Pie Chart Graph Ppt PowerPoint Presentation Ideas Guidelines
This is a donut pie chart graph ppt powerpoint presentation ideas guidelines. This is a three stage process. The stages in this process are finance, marketing, management, investment, analysis.

Combo Chart Graph Ppt PowerPoint Presentation Gallery Designs Download
This is a combo chart graph ppt powerpoint presentation gallery designs download. This is a three stage process. The stages in this process are finance, marketing, analysis, investment, million.
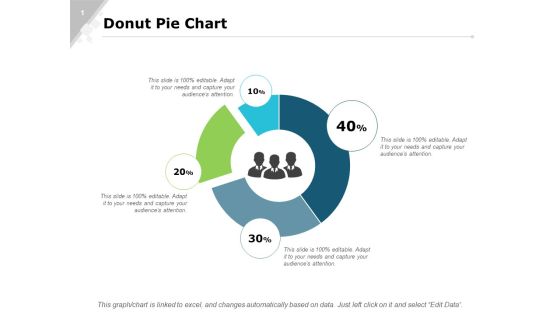
Donut Pie Chart Bar Ppt PowerPoint Presentation Infographics Slide Portrait
This is a donut pie chart bar ppt powerpoint presentation infographics slide portrait. This is a four stage process. The stages in this process are finance, marketing, analysis, investment, million.

Area Chart Graph Ppt PowerPoint Presentation Professional Format Ideas
This is a column chart graph ppt powerpoint presentation slides file formats. This is a stage three process. The stages in this process are finance, marketing, analysis, investment, million.

Column Chart Marketing Management Ppt PowerPoint Presentation Professional Images
This is a column chart marketing management ppt powerpoint presentation professional images. This is a three stage process. The stages in this process are finance, marketing, management, investment, analysis.
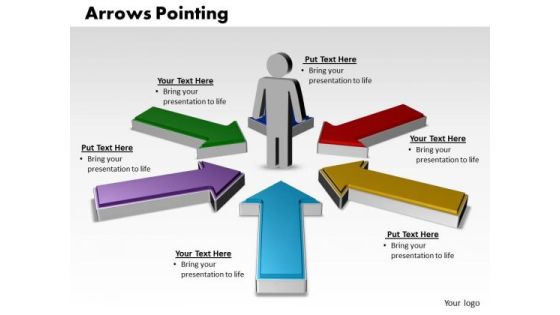
Business Charts PowerPoint Templates Arrows Pointing Inwards With Circular Direction Editable Sales
Business Charts PowerPoint templates arrows pointing inwards with circular direction editable Sales-This PowerPoint Diagram shows the five different colored Arrows pointing towards the man .It imitates the conceptualization of Success, Business, Marketing, Finance, Insurance etc.

Area Chart Ppt PowerPoint Presentation Visual Aids Example 2015
This is a area chart ppt powerpoint presentation visual aids example 2015. This is a two stage process. The stages in this process are area chart, finance, marketing, strategy, business.
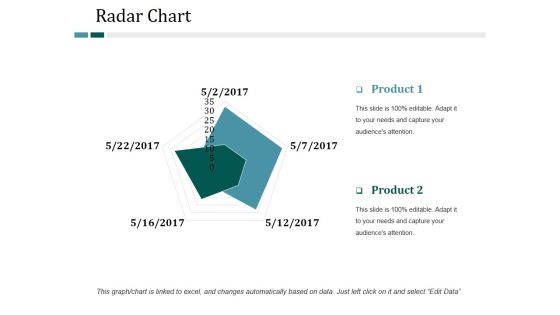
Radar Chart Ppt PowerPoint Presentation Infographic Template Backgrounds
This is a radar chart ppt powerpoint presentation infographic template backgrounds. This is a two stage process. The stages in this process are radar chart, finance, marketing, strategy, business.
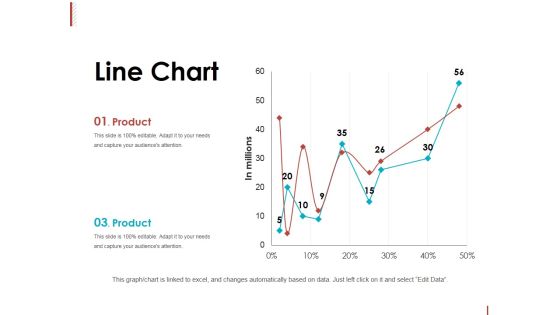
Line Chart Ppt PowerPoint Presentation Slides Graphics Tutorials
This is a line chart ppt powerpoint presentation slides graphics tutorials. This is a two stage process. The stages in this process are product, in millions, line chart, percentage, finance.
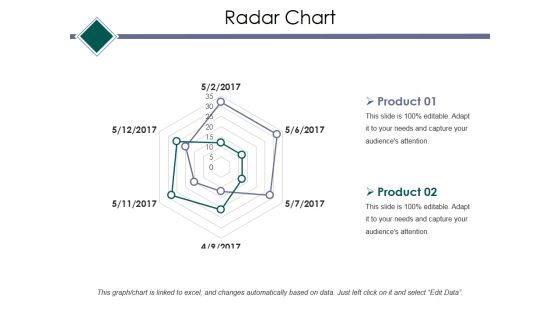
Radar Chart Ppt PowerPoint Presentation Infographic Template Example Topics
This is a radar chart ppt powerpoint presentation infographic template example topics. This is a two stage process. The stages in this process are radar chart, finance, marketing, strategy, business.

Radar Chart Ppt PowerPoint Presentation Outline Background Images
This is a radar chart ppt powerpoint presentation outline background images. This is a two stage process. The stages in this process are radar chart, finance, marketing, strategy, business.
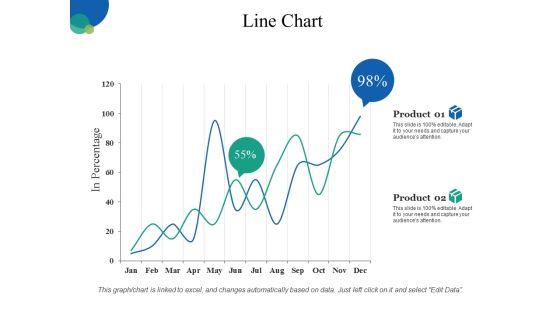
Line Chart Ppt PowerPoint Presentation Gallery Clipart Images
This is a line chart ppt powerpoint presentation gallery clipart images. This is a two stage process. The stages in this process are business, line chart, finance, marketing, strategy.
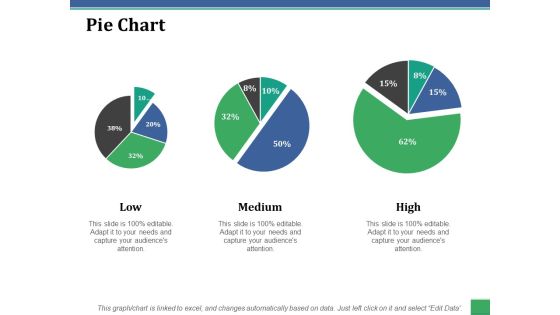
Pie Chart Ppt PowerPoint Presentation File Graphics Download
This is a pie chart ppt powerpoint presentation file graphics download. This is a three stage process. The stages in this process are low, medium, high, pie chart, finance.

Data Collection And Analysis Flow Chart Ppt PowerPoint Presentation Sample
This is a data collection and analysis flow chart ppt powerpoint presentation sample. This is a five stage process. The stages in this process are business, strategy, marketing, process, growth strategy, finance.
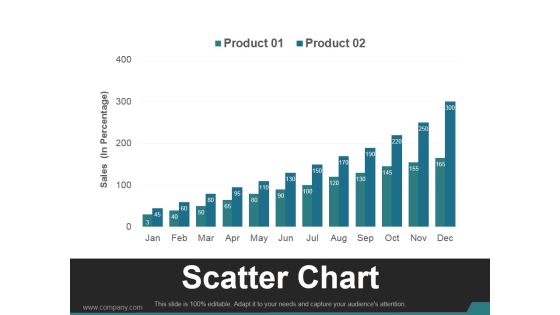
Scatter Chart Template 1 Ppt PowerPoint Presentation Visual Aids
This is a scatter chart template 1 ppt powerpoint presentation visual aids. This is a twelve stage process. The stages in this process are business, marketing, growth, finance, management.
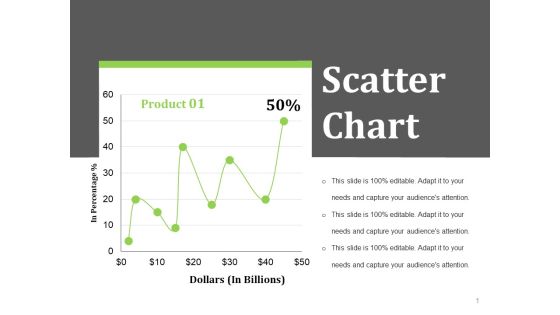
Scatter Chart Ppt PowerPoint Presentation Styles Layout Ideas
This is a scatter chart ppt powerpoint presentation styles layout ideas. This is a one stage process. The stages in this process are dollars in billions, in percentage, business, finance.

Donut Pie Chart Ppt PowerPoint Presentation Professional Example File
This is a donut pie chart ppt powerpoint presentation professional example file. This is a four stage process. The stages in this process are percentage, finance, donut, business, process.

Column Chart Ppt PowerPoint Presentation Layouts Graphics Example
This is a column chart ppt powerpoint presentation layouts graphics example. This is a two stage process. The stages in this process are product, year, bar graph, business, finance.

Donut Pie Chart Ppt PowerPoint Presentation Visual Aids Model
This is a donut pie chart ppt powerpoint presentation visual aids model. This is a four stage process. The stages in this process are product, percentage, finance, donut, business.

Donut Pie Chart Ppt PowerPoint Presentation Pictures Layout Ideas
This is a donut pie chart ppt powerpoint presentation pictures layout ideas. This is a four stage process. The stages in this process are percentage, finance, donut, business, product.

Investment Strategy And Portfolio Management Diagram Ppt Sample File
This is a investment strategy and portfolio management diagram ppt sample file. This is a eight stage process. The stages in this process are supply, finance, demand, leverage items, strategic items, bottleneck items, innovation, direction.

Pie Chart With Multiple Percentage Values Ppt PowerPoint Presentation Show
This is a pie chart with multiple percentage values ppt powerpoint presentation show. This is a six stage process. The stages in this process are pie, finance, people, silhouettes, communication.

Scatter Chart Ppt PowerPoint Presentation Portfolio File Formats
This is a scatter chart ppt powerpoint presentation portfolio file formats. This is a one stage process. The stages in this process are scatter chart, finance, success, management, business.
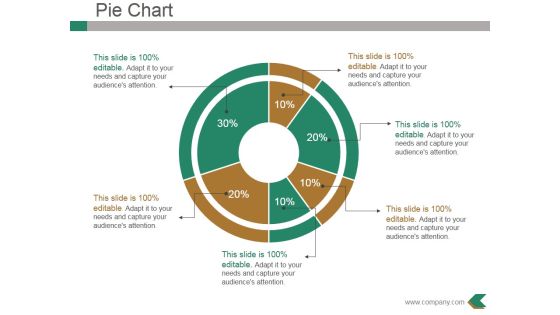
Pie Chart Ppt PowerPoint Presentation File Background Designs
This is a pie chart ppt powerpoint presentation file background designs. This is a six stage process. The stages in this process are business, marketing, pie chart, percentage, finance.
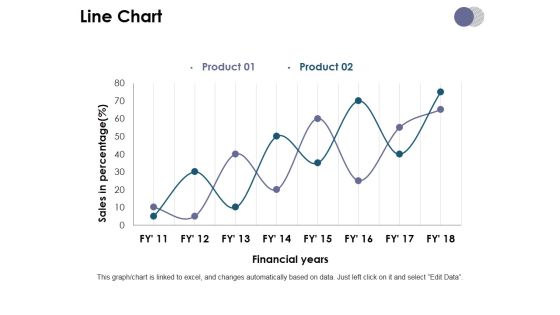
Line Chart Ppt PowerPoint Presentation Model Slide Download
This is a line chart ppt powerpoint presentation model slide download. This is a two stage process. The stages in this process are line chart, growth, finance, analysis, business.
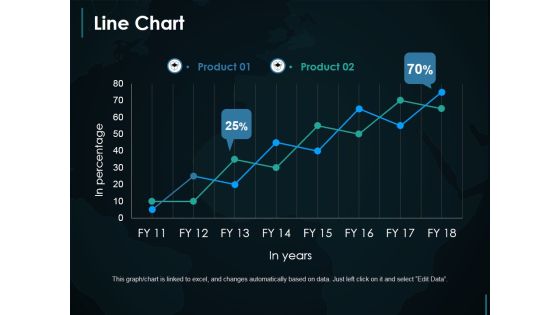
Line Chart Ppt PowerPoint Presentation Infographic Template Demonstration
This is a line chart ppt powerpoint presentation infographic template demonstration. This is a two stage process. The stages in this process are line chart, growth, finance, marketing, strategy.

Stacked Line Chart Ppt PowerPoint Presentation Summary Graphics Pictures
This is a stacked line chart ppt powerpoint presentation summary graphics pictures. This is a two stage process. The stages in this process are stacked line chart, growth, analysis, finance, business.
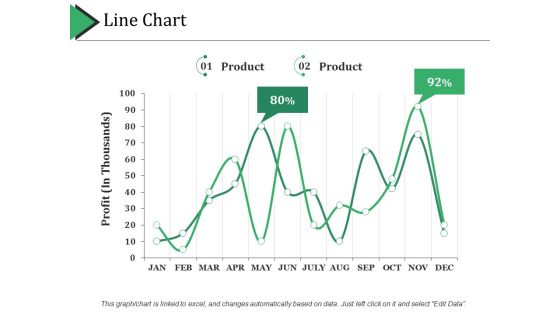
Line Chart Ppt PowerPoint Presentation Portfolio Graphics Pictures
This is a line chart ppt powerpoint presentation portfolio graphics pictures. This is a two stage process. The stages in this process are line chart, finance, growth, strategy, business.

Scatter Chart Ppt PowerPoint Presentation Pictures Background Designs
This is a scatter chart ppt powerpoint presentation pictures background designs. This is a one stage process. The stages in this process are scatter chart, growth, finance, marketing, strategy, business.
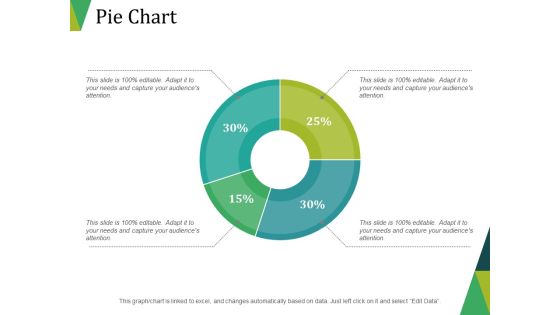
Pie Chart Ppt PowerPoint Presentation Portfolio Design Templates
This is a pie chart ppt powerpoint presentation portfolio design templates. This is a four stage process. The stages in this process are pie chart, finance, marketing, strategy, business.

Control Chart Template 1 Ppt PowerPoint Presentation Infographic Template Deck
This is a control chart template 1 ppt powerpoint presentation infographic template deck. This is a one stage process. The stages in this process are control chart, growth, finance, marketing, strategy, business.

Pie Chart Ppt PowerPoint Presentation Inspiration Example File
This is a pie chart ppt powerpoint presentation inspiration example file. This is a four stage process. The stages in this process are pie chart, finance, percentage, business, marketing.

Combo Chart Analysis Management Ppt PowerPoint Presentation Professional Gridlines
This is a combo chart analysis management ppt powerpoint presentation professional gridlines. This is a three stage process. The stages in this process are combo chart, finance, marketing, business, analysis.

Stacked Column Chart Ppt PowerPoint Presentation Professional Aids
This is a stacked column chart ppt powerpoint presentation professional aids. This is a three stage process. The stages in this process are bar chart, finance, marketing, business, analysis.
 Home
Home