Finance Icons
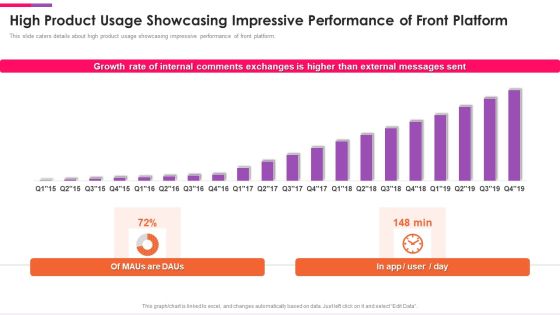
Front Series C Capital Raising Pitch Deck High Product Usage Showcasing Impressive Diagrams PDF
This slide caters details about high product usage showcasing impressive performance of front platform. Deliver an awe inspiring pitch with this creative front series c capital raising pitch deck high product usage showcasing impressive diagrams pdf bundle. Topics like high product usage showcasing impressive performance of front platform can be discussed with this completely editable template. It is available for immediate download depending on the needs and requirements of the user.
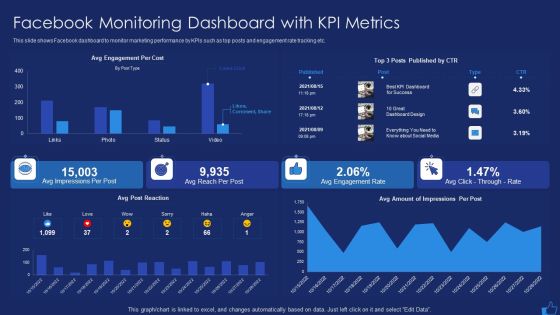
Facebook Advertising Plan For Demand Generation Facebook Monitoring Dashboard With KPI Metrics Diagrams PDF
This slide shows Facebook dashboard to monitor marketing performance by KPIs such as top posts and engagement rate tracking etc. Deliver an awe inspiring pitch with this creative facebook advertising plan for demand generation facebook monitoring dashboard with kpi metrics diagrams pdf bundle. Topics like facebook monitoring dashboard with kpi metrics can be discussed with this completely editable template. It is available for immediate download depending on the needs and requirements of the user.
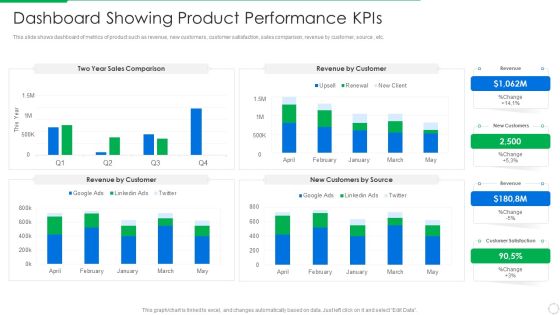
PLM Execution In Company Dashboard Showing Product Performance Kpis Diagrams PDF
This slide shows dashboard of metrics of product such as revenue, new customers, customer satisfaction, sales comparison, revenue by customer, source , etc. Deliver and pitch your topic in the best possible manner with this plm execution in company dashboard showing product performance kpis diagrams pdf . Use them to share invaluable insights on dashboard showing product performance kpis and impress your audience. This template can be altered and modified as per your expectations. So, grab it now.

Enhancing Hospital Software System Hospital Performance Dashboard To Improve Operations Diagrams PDF
This slide focuses on the hospital performance dashboard to improve operations which covers total patients, operational expenses, patient satisfaction, average waiting time, staff per department, etc. Deliver an awe inspiring pitch with this creative enhancing hospital software system hospital performance dashboard to improve operations diagrams pdf bundle. Topics like hospital performance dashboard to improve operations can be discussed with this completely editable template. It is available for immediate download depending on the needs and requirements of the user.

Master Plan For Opening Bistro Coffee Shop Break Even Analysis Diagrams PDF
This slide shows the coffee shop break even analysis which includes the graph and description. Deliver an awe inspiring pitch with this creative master plan for opening bistro coffee shop break even analysis diagrams pdf bundle. Topics like coffee shop break even analysis can be discussed with this completely editable template. It is available for immediate download depending on the needs and requirements of the user.

Master Plan For Opening Bistro Coffee Shop Business Dashboard Diagrams PDF
This slide shows the coffee shop business dashboard which includes profit by state, average sales by month, profit, sales by product type, etc. Deliver an awe inspiring pitch with this creative master plan for opening bistro coffee shop business dashboard diagrams pdf bundle. Topics like coffee shop business dashboard can be discussed with this completely editable template. It is available for immediate download depending on the needs and requirements of the user.

Examining Price Optimization Organization Impact On Customers Due To Poor Product Pricing Strategy Diagrams PDF
This slide covers the high customer churn rate in the company due to poor product pricing strategy involved within the organization.Deliver and pitch your topic in the best possible manner with this examining price optimization organization impact on customers due to poor product pricing strategy diagrams pdf. Use them to share invaluable insights on impact on customers due to poor product pricing strategy and impress your audience. This template can be altered and modified as per your expectations. So, grab it now.
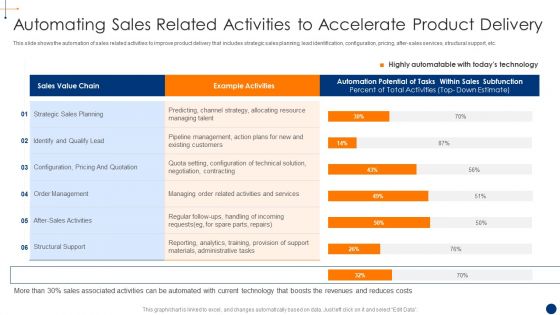
New Product Development Process Optimization Automating Sales Related Activities Diagrams PDF
This slide shows the automation of sales related activities to improve product delivery that includes strategic sales planning, lead identification, configuration, pricing, after sales services, structural support, etc. Deliver an awe inspiring pitch with this creative new product development process optimization automating sales related activities diagrams pdf bundle. Topics like automating sales related activities to accelerate product delivery can be discussed with this completely editable template. It is available for immediate download depending on the needs and requirements of the user.

B2B Customers Journey Playbook B2b Prospects Performance Measurement Dashboard Diagrams PDF
This slide provides information regarding B2B performance tracking dashboard to measure leads, MQL, SQL, customers, revenue goals, total media spend. Deliver an awe inspiring pitch with this creative b2b customers journey playbook b2b prospects performance measurement dashboard diagrams pdf bundle. Topics like b2b prospects performance measurement dashboard can be discussed with this completely editable template. It is available for immediate download depending on the needs and requirements of the user.

Responsibilities Project Management Office Implementing Digitalization Increase In Project Revenue Diagrams PDF
This slide shows the graphical presentation of increase in revenue and productivity of the project from Q1 2022 to Q4 2022, after shifting the PMO priorities Deliver and pitch your topic in the best possible manner with this responsibilities project management office implementing digitalization increase in project revenue diagrams pdf. Use them to share invaluable insights on increase in project revenue and productivity and impress your audience. This template can be altered and modified as per your expectations. So, grab it now.

Fiverr Capital Raising Pitch Deck Market Opportunity Of Fiverr Diagrams PDF
This slide provides details regarding the market opportunity of the company showing total addressable market, estimated US total freelance income and multiple service categories. Deliver an awe inspiring pitch with this creative fiverr capital raising pitch deck market opportunity of fiverr diagrams pdf bundle. Topics like fiverr has a large market opportunity, service categories can be discussed with this completely editable template. It is available for immediate download depending on the needs and requirements of the user.
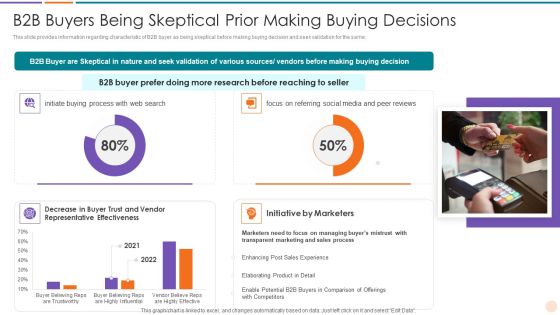
Improving Lead Generation B2B Buyers Being Skeptical Prior Making Buying Decisions Diagrams PDF
This slide provides information regarding characteristic of B2B buyer as being skeptical before making buying decision and seek validation for the same. Deliver and pitch your topic in the best possible manner with this improving lead generation b2b buyers being skeptical prior making buying decisions diagrams pdf. Use them to share invaluable insights on initiative by marketers, b2b buyer prefer, 2021 to 2022 and impress your audience. This template can be altered and modified as per your expectations. So, grab it now.
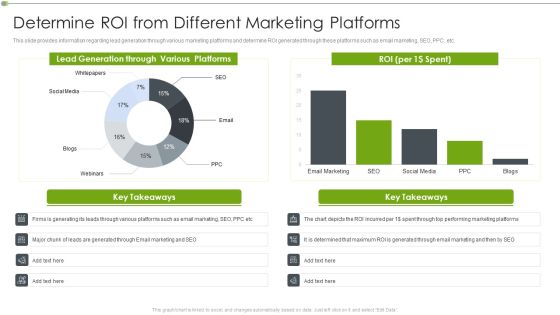
Ways To Retain Consumer Through Strategic Marketing Determine ROI From Different Marketing Platforms Diagrams PDF
This slide provides information regarding lead generation through various marketing platforms and determine ROI generated through these platforms such as email marketing, SEO, PPC, etc. Deliver an awe inspiring pitch with this creative ways to retain consumer through strategic marketing determine roi from different marketing platforms diagrams pdf bundle. Topics like determine roi from different marketing platforms can be discussed with this completely editable template. It is available for immediate download depending on the needs and requirements of the user.

Application Development Ios Vs Android Market Share From 2012Q1 2021Q1 Diagrams PDF
This slide represents the market shares of iOS and android from 2012Q1 to 2021Q1which shows that iOS had the more significant market share in 2021.Deliver an awe inspiring pitch with this creative Application Development Ios Vs Android Market Share From 2012Q1 2021Q1 Diagrams PDF bundle. Topics like Ios Vs Android Market Share From 2012Q1 To 2021Q1 can be discussed with this completely editable template. It is available for immediate download depending on the needs and requirements of the user.
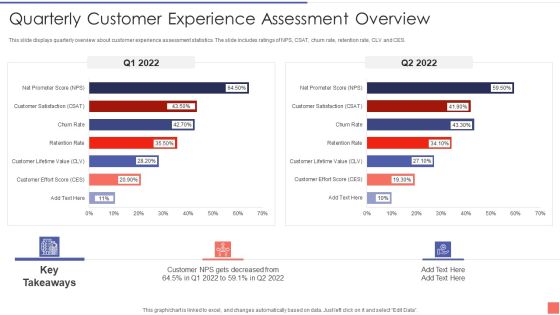
Providing Electronic Financial Services To Existing Consumers Quarterly Customer Experience Diagrams PDF
This slide displays quarterly overview about customer experience assessment statistics. The slide includes ratings of NPS, CSAT, churn rate, retention rate, CLV and CES. Deliver and pitch your topic in the best possible manner with this Providing Electronic Financial Services To Existing Consumers Quarterly Customer Experience Diagrams PDF. Use them to share invaluable insights on Quarterly Customer Experience Assessment Overview and impress your audience. This template can be altered and modified as per your expectations. So, grab it now.
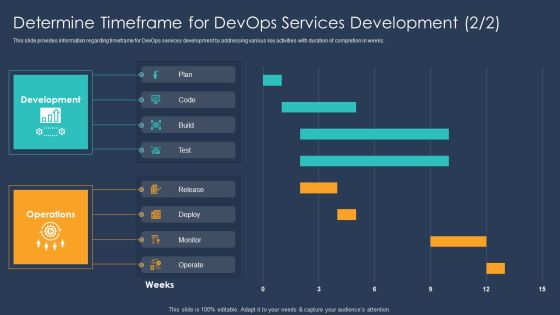
Devops Implementation And Advisory Proposal IT Determine Timeframe For Devops Services Diagrams PDF
This slide provides information regarding timeframe for DevOps services development by addressing various key activities with duration of completion in weeks. Deliver and pitch your topic in the best possible manner with this Devops Implementation And Advisory Proposal IT Determine Timeframe For Devops Services Diagrams PDF. Use them to share invaluable insights on Determine Timeframe For Devops Services Development and impress your audience. This template can be altered and modified as per your expectations. So, grab it now.

Innovation Procedure For Online Business Digital Transformation Change Management Diagrams PDF
Purpose of the following slide is to show the digital transformation change management dashboard as it highlights the percentage of digital transformation and the transformation one by priority Deliver and pitch your topic in the best possible manner with this Innovation Procedure For Online Business Digital Transformation Change Management Diagrams PDF Use them to share invaluable insights on Digital Transformation Change Management Dashboard and impress your audience. This template can be altered and modified as per your expectations. So, grab it now.
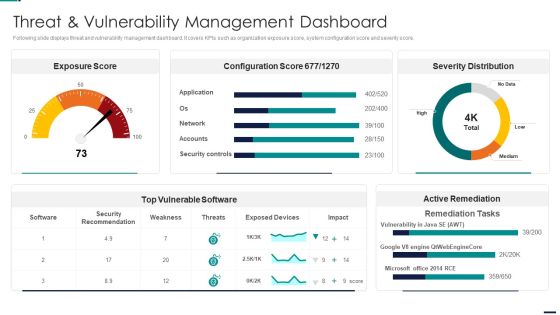
Risk Management Model For Data Security Threat And Vulnerability Management Dashboard Diagrams PDF
Following slide displays threat and vulnerability management dashboard. It covers KPIs such as organization exposure score, system configuration score and severity score. Deliver an awe inspiring pitch with this creative Risk Management Model For Data Security Threat And Vulnerability Management Dashboard Diagrams PDF bundle. Topics like Exposure Score, Configuration Score, Severity Distribution, Top Vulnerable Software, Active Remediation can be discussed with this completely editable template. It is available for immediate download depending on the needs and requirements of the user.
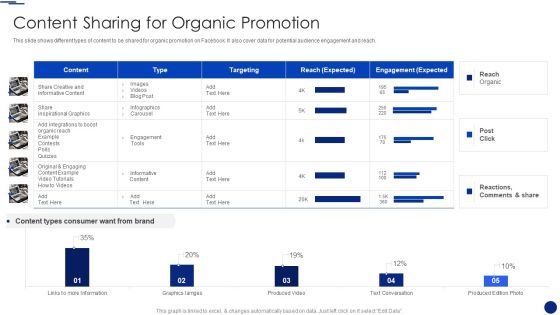
Social Media Marketing Through Facebook Content Sharing For Organic Promotion Diagrams PDF
This slide shows different types of content to be shared for organic promotion on Facebook. It also cover data for potential audience engagement and reach. Deliver and pitch your topic in the best possible manner with this Social Media Marketing Through Facebook Content Sharing For Organic Promotion Diagrams PDF. Use them to share invaluable insights on Content Sharing, Organic Promotion, Engagement and impress your audience. This template can be altered and modified as per your expectations. So, grab it now.

Information Technology Firm Report Example Companys Segment Financials And Revenue Split Diagrams PDF
The slide provides the companys revenue for last three years from three operating segments software for business customers, hardware products, and entertainment.Deliver and pitch your topic in the best possible manner with this Information Technology Firm Report Example Companys Segment Financials And Revenue Split Diagrams PDF Use them to share invaluable insights on Companys Segment, Financials Revenue, Split and impress your audience. This template can be altered and modified as per your expectations. So, grab it now.
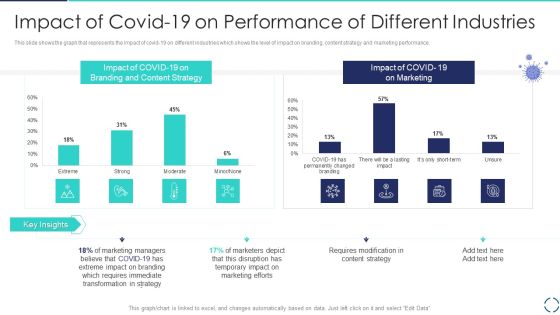
Optimizing E Business Promotion Plan Impact Of Covid 19 On Performance Of Different Industries Diagrams PDF
This slide shows the graph that represents the impact of covid 19 on different industries which shows the level of impact on branding, content strategy and marketing performance. Deliver an awe inspiring pitch with this creative Optimizing E Business Promotion Plan Impact Of Covid 19 On Performance Of Different Industries Diagrams PDF bundle. Topics like Strategy, Marketing, Branding can be discussed with this completely editable template. It is available for immediate download depending on the needs and requirements of the user.
Employees Performance Assessment And Appraisal Determine Employee Performance Tracker Dashboard Diagrams PDF
This slide provides information about employee performance tracker dashboard which covers details in context to employee training, etc.Deliver and pitch your topic in the best possible manner with this Employees Performance Assessment And Appraisal Determine Employee Performance Tracker Dashboard Diagrams PDF Use them to share invaluable insights on Needs Improvement, Current Quarterly, Outstanding and impress your audience. This template can be altered and modified as per your expectations. So, grab it now.

Employee Stress Management Methods Stress Management Dashboard With Wellness Diagrams PDF
This slide highlights the stress management dashboard which showcases the perceived stress scale, heart rate, blood pressure, sleep quality and employee wellness.Deliver an awe inspiring pitch with this creative Employee Stress Management Methods Stress Management Dashboard With Wellness Diagrams PDF bundle. Topics like Perceived Stress, Heart Variability, Blood Pressure can be discussed with this completely editable template. It is available for immediate download depending on the needs and requirements of the user.
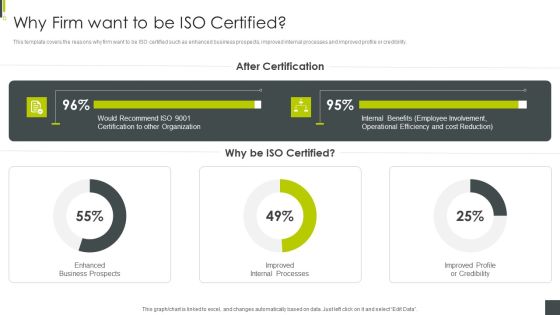
ISO 9001 Certification Procedure Why Firm Want To Be ISO Certified Diagrams PDF
This template covers the reasons why firm want to be ISO certified such as enhanced business prospects, improved internal processes and improved profile or credibility. Deliver an awe inspiring pitch with this creative ISO 9001 Certification Procedure Why Firm Want To Be ISO Certified Diagrams PDF bundle. Topics like Enhanced Business Prospects, Improved Internal Processes, Improved Profile Credibility can be discussed with this completely editable template. It is available for immediate download depending on the needs and requirements of the user.

Organization Stress Administration Practices Stress Management Dashboard With Wellness Diagrams PDF
This slide highlights the stress management dashboard which showcases the perceived stress scale, heart rate, blood pressure, sleep quality and employee wellness.Deliver an awe inspiring pitch with this creative Organization Stress Administration Practices Stress Management Dashboard With Wellness Diagrams PDF bundle. Topics like Perceived Stress, Heart Variability, Blood Pressure can be discussed with this completely editable template. It is available for immediate download depending on the needs and requirements of the user.
Enhanced Workforce Effectiveness Structure Determine Employee Performance Tracker Dashboard Diagrams PDF
This slide provides information about employee performance tracker dashboard which covers details in context to employee training, etc.Deliver an awe inspiring pitch with this creative Enhanced Workforce Effectiveness Structure Determine Employee Performance Tracker Dashboard Diagrams PDF bundle. Topics like Current Quarterly, Outstanding, Needs Improvement can be discussed with this completely editable template. It is available for immediate download depending on the needs and requirements of the user.

IT Security Risk Management Approach Introduction Determining The Priority Requirements Diagrams PDF
This slide demonstrates the priority requirements of companies while buying IoT products. Strong cybersecurity is the topmost priority of companies followed by reliability and compatibility. Deliver an awe inspiring pitch with this creative IT Security Risk Management Approach Introduction Determining The Priority Requirements Diagrams PDF bundle. Topics like Development Processes, Technology Environments, Purchasing Iot Products can be discussed with this completely editable template. It is available for immediate download depending on the needs and requirements of the user.

Proactive Method For 5G Deployment By Telecom Companies 5G Emerging As Network Of Opportunity Diagrams PDF
This slide provides details regarding 5G as next generation mobile technology and emerging as network of opportunity catering various need of users, telecom operators, etc. Deliver an awe inspiring pitch with this creative Proactive Method For 5G Deployment By Telecom Companies 5G Emerging As Network Of Opportunity Diagrams PDF bundle. Topics like Consistent Connectivity, Overall Enhancement, Across Geographical can be discussed with this completely editable template. It is available for immediate download depending on the needs and requirements of the user.
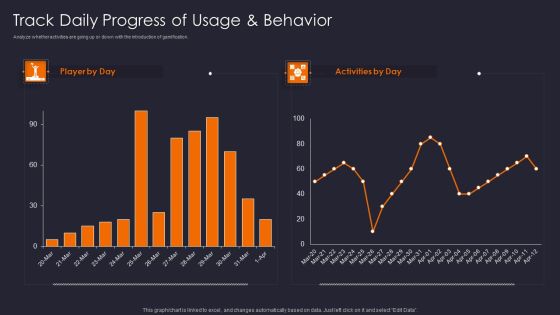
Implementing Gamification Marketing Plan To Increase Conversions Track Daily Progress Of Usage Diagrams PDF
Analyze whether activities are going up or down with the introduction of gamification.Deliver an awe inspiring pitch with this creative Implementing Gamification Marketing Plan To Increase Conversions Track Daily Progress Of Usage Diagrams PDF bundle. Topics like Track Daily, Progress Usage, Behavior can be discussed with this completely editable template. It is available for immediate download depending on the needs and requirements of the user.

Digital Asset Management In Visual World Why Digital Content Diagrams PDF
This slide covers introduction about digital media, how it has evolved till now and facts about social media content etc.Deliver and pitch your topic in the best possible manner with this Digital Asset Management In Visual World Why Digital Content Diagrams PDF Use them to share invaluable insights on Earliest Recorded, Paintings Of Lascaux, Although Distribution and impress your audience. This template can be altered and modified as per your expectations. So, grab it now.

Sales CRM Cloud Solutions Deployment CRM Implementation Dashboard With Customer Diagrams PDF
This slide showcases the dashboard for CRM which includes the revenue, marketing expenses, satisfaction rate, conversion funnel, tickets volume by priority, and expected sales this year.Deliver an awe inspiring pitch with this creative Sales CRM Cloud Solutions Deployment CRM Implementation Dashboard With Customer Diagrams PDF bundle. Topics like Conversion Funnel, Customer Satisfaction, Expected Sales can be discussed with this completely editable template. It is available for immediate download depending on the needs and requirements of the user.

How To Develop Branding And Storytelling With DAM Why Digital Content Diagrams PDF
This slide covers introduction about digital media, how it has evolved till now and facts about social media content etc. Deliver an awe inspiring pitch with this creative How To Develop Branding And Storytelling With DAM Why Digital Content Diagrams PDF bundle. Topics like Produced Digital, Printed And Distributed, Medium Of Communication can be discussed with this completely editable template. It is available for immediate download depending on the needs and requirements of the user.
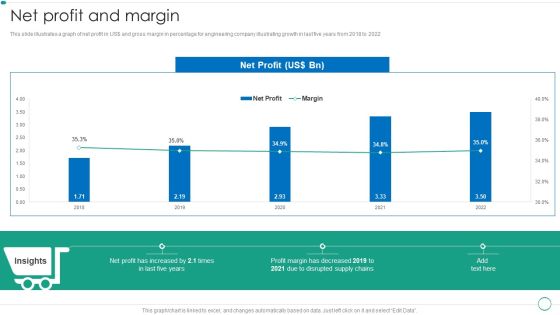
Real Estate Construction And Engineering Company Profile Net Profit And Margin Diagrams PDF
This slide illustrates a graph of net profit in US and gross margin in percentage for engineering company illustrating growth in last five years from 2018 to 2022.Deliver an awe inspiring pitch with this creative Real Estate Construction And Engineering Company Profile Net Profit And Margin Diagrams PDF bundle. Topics like Disrupted Supply, Profit Margin, Increased can be discussed with this completely editable template. It is available for immediate download depending on the needs and requirements of the user.

Current Situation Decrease In Year Over Year Revenue Generation Diagrams PDF
This slide covers revenue generation statistics of the firm over past three years. It also depicts that revenue recorded in FY21 was dollar2070 as compared to dollar4720 in FY19.Deliver an awe inspiring pitch with this creative Current Situation Decrease In Year Over Year Revenue Generation Diagrams PDF bundle. Topics like Revenue Generated, Gets Decreased, Key Takeaways can be discussed with this completely editable template. It is available for immediate download depending on the needs and requirements of the user.

Top Cyber Risks Faced By The Real Estate Company Diagrams PDF
The following slide exhibits four cyber risks which are faced by the real estate organization. It provides key information about the ransomware, phishing, web-based attack and email fraud attack. Deliver an awe inspiring pitch with this creative Top Cyber Risks Faced By The Real Estate Company Diagrams PDF bundle. Topics like Ransomware Business Compromise, Businesses Currently can be discussed with this completely editable template. It is available for immediate download depending on the needs and requirements of the user.

Computer Simulation Human Thinking Tracking Essential Virtual Agents Activities Dashboard Diagrams PDF
This slide provides information regarding virtual agents essential activities dashboard in terms of daily number of new conversation, unique users weekly conversations by channel, etc. Deliver an awe inspiring pitch with this creative Computer Simulation Human Thinking Tracking Essential Virtual Agents Activities Dashboard Diagrams PDF bundle. Topics like Unique Users, Weekly Conversations Channel, Weekly Conversations Topic can be discussed with this completely editable template. It is available for immediate download depending on the needs and requirements of the user.
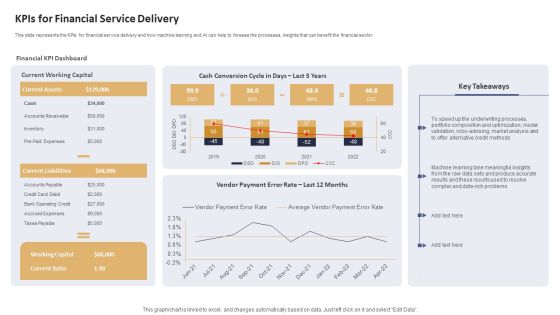
Data Processing Services Delivery Kpis For Financial Service Delivery Diagrams PDF
This slide represents the KPIs for financial service delivery and how machine learning and AI can help to foresee the processes, insights that can benefit the financial sector. Deliver an awe inspiring pitch with this creative Data Processing Services Delivery Kpis For Financial Service Delivery Diagrams PDF bundle. Topics like Financial KPI Dashboard, Current Working Capital, Cash Conversion can be discussed with this completely editable template. It is available for immediate download depending on the needs and requirements of the user.

Customer Relationship Management Post Implementation Impacts On Business Aspects Diagrams PDF
This slide covers major improvements after CRM software implementation. It includes major impact on areas such as customer retention, customer satisfaction, sales revenue, and upselling cross selling. Deliver and pitch your topic in the best possible manner with this Customer Relationship Management Post Implementation Impacts On Business Aspects Diagrams PDF. Use them to share invaluable insights on Regular Reminders, Customer Retention, Customer Interaction and impress your audience. This template can be altered and modified as per your expectations. So, grab it now.

Agile Sprint Technique In Software Advantages Of Agile Methodology Diagrams PDF
This slide depicts the advantages of agile methodology that include managing changing priorities, project visibility, IT alignment, delivery speed, team morale, increased productivity, and so on.Deliver and pitch your topic in the best possible manner with this Agile Sprint Technique In Software Advantages Of Agile Methodology Diagrams PDF. Use them to share invaluable insights on Software Maintainability, Managing Distributed, Engineering Discipline and impress your audience. This template can be altered and modified as per your expectations. So, grab it now.

Complete Online Marketing Audit Guide Findings Of Social Media Channels Audit Diagrams PDF
This slide highlights the social media audit which showcase the performance grade of presence with Facebook, Instagram, twitter and YouTube detailed audit results, Deliver an awe inspiring pitch with this creative Complete Online Marketing Audit Guide Findings Of Social Media Channels Audit Diagrams PDF bundle. Topics like Engagement Rate, Social Media Presence can be discussed with this completely editable template. It is available for immediate download depending on the needs and requirements of the user.

Complete Online Marketing Audit Guide Website Seo Audit With Page Load Speed Diagrams PDF
This slide highlights the SEO audit which showcases the page score, critical errors, warnings, crawled pages results, site health, hreflang audit and page load speed. Deliver an awe inspiring pitch with this creative Complete Online Marketing Audit Guide Website Seo Audit With Page Load Speed Diagrams PDF bundle. Topics like Website SEO Audit can be discussed with this completely editable template. It is available for immediate download depending on the needs and requirements of the user.

Metrics To Measure Business Performance Effective Rate Metrics By Customer And Offering Diagrams PDF
This slide covers effective rate metrics. It shows over year over comparison of effective rate per customer as well as effective rate per offering. Deliver and pitch your topic in the best possible manner with this Metrics To Measure Business Performance Effective Rate Metrics By Customer And Offering Diagrams PDF. Use them to share invaluable insights on Effective Rate, Per Customer, Per Offering and impress your audience. This template can be altered and modified as per your expectations. So, grab it now.

B2B Sales Techniques Playbook B2B Sales Representatives Performance Tracking Dashboard Diagrams PDF
This slide provides information regarding B2B sales representatives performance tracking dashboard to measure leads by region, revenue breakdown, top performers by leads, revenues, etc. Deliver and pitch your topic in the best possible manner with this B2B Sales Techniques Playbook B2B Sales Representatives Performance Tracking Dashboard Diagrams PDF. Use them to share invaluable insights on Combine Sales, Individual Performance, Achieved Highest and impress your audience. This template can be altered and modified as per your expectations. So, grab it now.

Dashboard For Big Data Management Ppt PowerPoint Presentation File Diagrams PDF
This slide represents the dashboards for big data deployment by covering details of visitors and return visitors, subscribers, top 3 articles by readers, avg duration, and pages per visit. Deliver an awe inspiring pitch with this creative Dashboard For Big Data Management Ppt PowerPoint Presentation File Diagrams PDF bundle. Topics like Dashboard, Big Data Management can be discussed with this completely editable template. It is available for immediate download depending on the needs and requirements of the user.
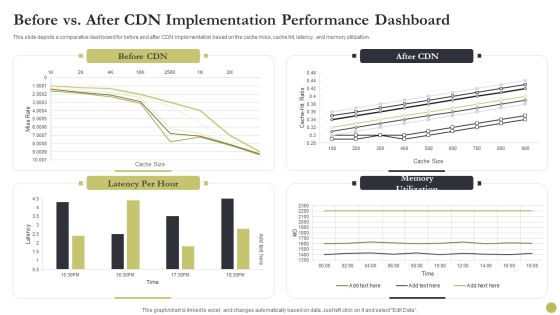
Content Delivery Network Edge Server Before Vs After CDN Implementation Performance Dashboard Diagrams PDF
This slide depicts a comparative dashboard for before and after CDN implementation based on the cache miss, cache hit, latency, and memory utilization. Deliver an awe inspiring pitch with this creative Content Delivery Network Edge Server Before Vs After CDN Implementation Performance Dashboard Diagrams PDF bundle. Topics like After Cdn Implementation, Performance Dashboard can be discussed with this completely editable template. It is available for immediate download depending on the needs and requirements of the user.
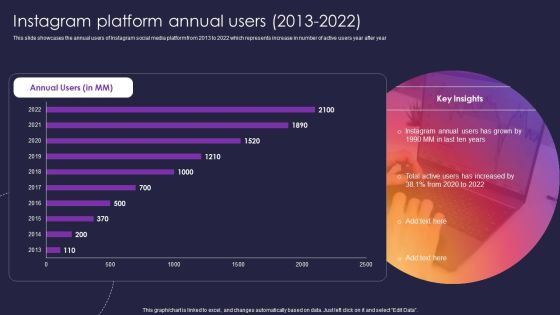
Instagram Company Details Instagram Platform Annual Users 2013 To 2022 Diagrams PDF
This slide showcases the annual users of Instagram social media platform from 2013 to 2022 which represents increase in number of active users year after year. Deliver and pitch your topic in the best possible manner with this Instagram Company Details Instagram Platform Annual Users 2013 To 2022 Diagrams PDF. Use them to share invaluable insights on Instagram Platform Annual Users and impress your audience. This template can be altered and modified as per your expectations. So, grab it now.

Analysis Of Average Wait Time At Retail Store Checkout Counters Retail Outlet Operations Diagrams PDF
The slide visually provides information regarding the average time customer spent at the checkout counter of retail store. It also provides details regarding waiting timings of competitors.Deliver an awe inspiring pitch with this creative Analysis Of Average Wait Time At Retail Store Checkout Counters Retail Outlet Operations Diagrams PDF bundle. Topics like Quarter Customers, Complaints Regarding, Behavior Increased can be discussed with this completely editable template. It is available for immediate download depending on the needs and requirements of the user.

Analysis Of Cleanliness At Retail Store Retail Outlet Operations Performance Evaluation Diagrams PDF
This slide illustrates the graph to showcase visitors responses towards the cleanliness of multiple store areas such as floor, display counters, try rooms etc.Deliver and pitch your topic in the best possible manner with this Analysis Of Cleanliness At Retail Store Retail Outlet Operations Performance Evaluation Diagrams PDF. Use them to share invaluable insights on Retail Store, Visitors Responded, Stores Floors and impress your audience. This template can be altered and modified as per your expectations. So, grab it now.
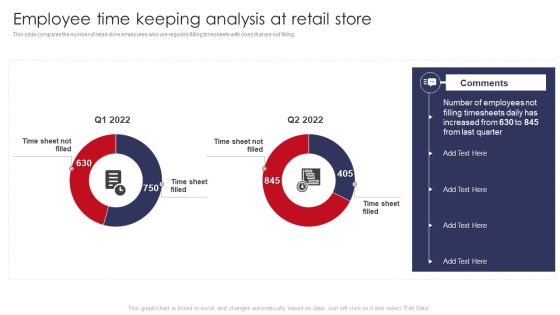
Employee Time Keeping Analysis At Retail Store Retail Outlet Operations Performance Evaluation Diagrams PDF
This slide compares the number of retail store employees who are regularly filling timesheets with ones that are not filling.Deliver an awe inspiring pitch with this creative Employee Time Keeping Analysis At Retail Store Retail Outlet Operations Performance Evaluation Diagrams PDF bundle. Topics like Filling Timesheets, Increased, Last Quarter can be discussed with this completely editable template. It is available for immediate download depending on the needs and requirements of the user.
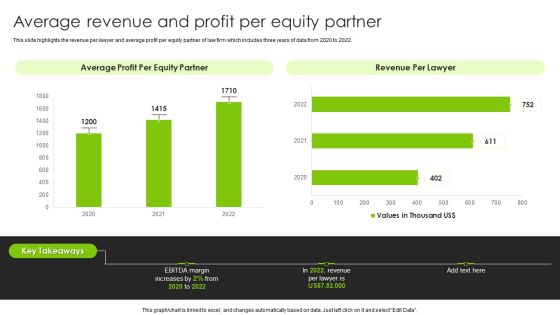
International Legal And Business Services Company Profile Average Revenue And Profit Per Equity Partner Diagrams PDF
This slide highlights the revenue per lawyer and average profit per equity partner of law firm which includes three years of data from 2020 to 2022. Deliver an awe inspiring pitch with this creative International Legal And Business Services Company Profile Average Revenue And Profit Per Equity Partner Diagrams PDF bundle. Topics like Revenue Per Lawyer, Average Profit, Equity Partner can be discussed with this completely editable template. It is available for immediate download depending on the needs and requirements of the user.
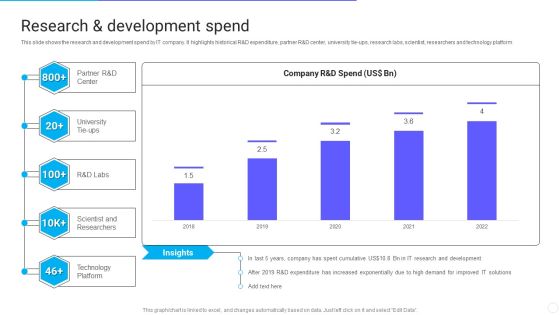
IT Application Services Company Outline Research And Development Spend Diagrams PDF
This slide shows the research and development spend by IT company. It highlights historical R and D expenditure, partner R and D center, university tie ups, research labs, scientist, researchers and technology platform. Deliver an awe inspiring pitch with this creative IT Application Services Company Outline Research And Development Spend Diagrams PDF bundle. Topics like Expenditure, Demand, Development can be discussed with this completely editable template. It is available for immediate download depending on the needs and requirements of the user.

Vendor Procurement Cycle And Expenses Management Dashboard Vendor Management Strategies Diagrams PDF
The following slide illustrates supplier procurement cycle and expenses management dashboard. It provides information about conracted, unlisted, top suppliers, spending, savings, procurement cycle time, etc.Deliver an awe inspiring pitch with this creative Vendor Procurement Cycle And Expenses Management Dashboard Vendor Management Strategies Diagrams PDF bundle. Topics like Contracted, Unlisted, Vendors Procurement can be discussed with this completely editable template. It is available for immediate download depending on the needs and requirements of the user.
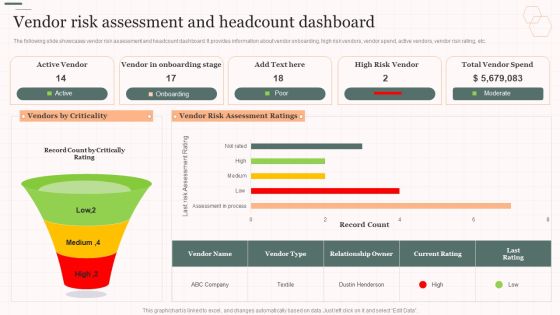
Vendor Risk Assessment And Headcount Dashboard Vendor Management Strategies Diagrams PDF
The following slide showcases vendor risk assessment and headcount dashboard. It provides information about vendor onboarding, high risk vendors, vendor spend, active vendors, vendor risk rating, etc. Deliver and pitch your topic in the best possible manner with this Vendor Risk Assessment And Headcount Dashboard Vendor Management Strategies Diagrams PDF. Use them to share invaluable insights on Assessment Ratings, Vendors Criticality, Vendor Onboarding and impress your audience. This template can be altered and modified as per your expectations. So, grab it now.

Strategic Management Consultancy Business Profile Employee Count And Breakdown Diagrams PDF
This slide represents the employee count for last five years from 2018 to 2022. It also includes employee split by geography and gender. Deliver an awe inspiring pitch with this creative Strategic Management Consultancy Business Profile Employee Count And Breakdown Diagrams PDF bundle. Topics like Employee Split By Gender, Employee Split By Geography, Employee Count can be discussed with this completely editable template. It is available for immediate download depending on the needs and requirements of the user.
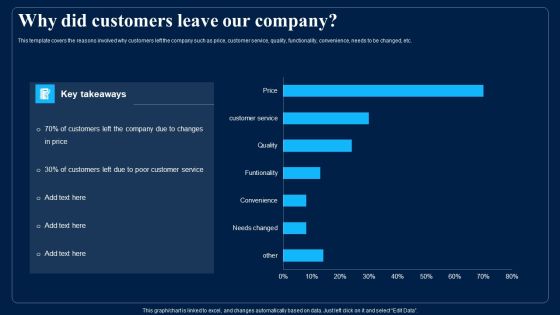
Identifying Optimum Pricing Methods For Business Why Did Customers Leave Our Company Diagrams PDF
This template covers the reasons involved why customers left the company such as price, customer service, quality, functionality, convenience, needs to be changed, etc. Deliver and pitch your topic in the best possible manner with this Identifying Optimum Pricing Methods For Business Why Did Customers Leave Our Company Diagrams PDF. Use them to share invaluable insights on Quality, Customer Service, Price and impress your audience. This template can be altered and modified as per your expectations. So, grab it now.

Organizational Change Management Process Flow Dashboard Ppt PowerPoint Presentation Diagram PDF
This slide covers Business change management lifecycle dashboard. It involves overall health, customer data, financials and operational efficiency. Pitch your topic with ease and precision using this Organizational Change Management Process Flow Dashboard Ppt PowerPoint Presentation Diagram PDF. This layout presents information on Financial Data, Operational Efficiency, Consumer Data. It is also available for immediate download and adjustment. So, changes can be made in the color, design, graphics or any other component to create a unique layout.
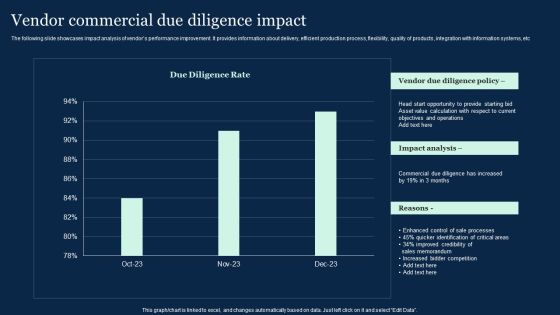
Vendor Commercial Due Diligence Impact Effective Vendor Management For Enhancing Diagrams PDF
The following slide showcases impact analysis of vendors performance improvement. It provides information about delivery, efficient production process, flexibility, quality of products, integration with information systems, etc. There are so many reasons you need a Vendor Commercial Due Diligence Impact Effective Vendor Management For Enhancing Diagrams PDF. The first reason is you can not spend time making everything from scratch, Thus, Slidegeeks has made presentation templates for you too. You can easily download these templates from our website easily.

Target Customer Analysis Evaluating Growth Rate Of Target Market Diagrams PDF
This slide showcases graph that can help organization to evaluate growth rate of target market. It can help company to identify potential and suitability of target market for expanding operations globally. There are so many reasons you need a Target Customer Analysis Evaluating Growth Rate Of Target Market Diagrams PDF. The first reason is you cant spend time making everything from scratch, Thus, Slidegeeks has made presentation templates for you too. You can easily download these templates from our website easily.

Boosting Customer Base Through Effective Dashboard Depicting Customer Service Insights Diagrams PDF
This slide shows the dashboard that depicts customer service insights which includes number of solved tickets, average resolution and response time, customer feedback, total visitors and chats. There are so many reasons you need a Boosting Customer Base Through Effective Dashboard Depicting Customer Service Insights Diagrams PDF. The first reason is you cant spend time making everything from scratch, Thus, Slidegeeks has made presentation templates for you too. You can easily download these templates from our website easily.
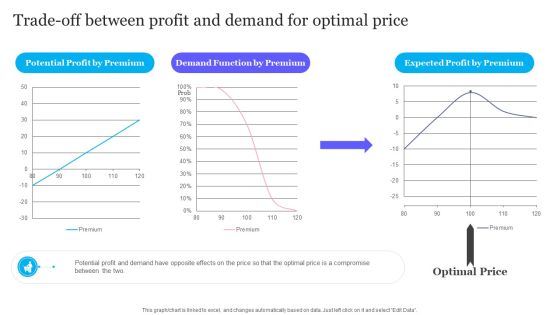
Trade Off Between Profit And Demand For Optimal Price Diagrams PDF
From laying roadmaps to briefing everything in detail, our templates are perfect for you. You can set the stage with your presentation slides. All you have to do is download these easy to edit and customizable templates. Trade Off Between Profit And Demand For Optimal Price Diagrams PDF will help you deliver an outstanding performance that everyone would remember and praise you for. Do download this presentation today.
 Home
Home