Finance Icons
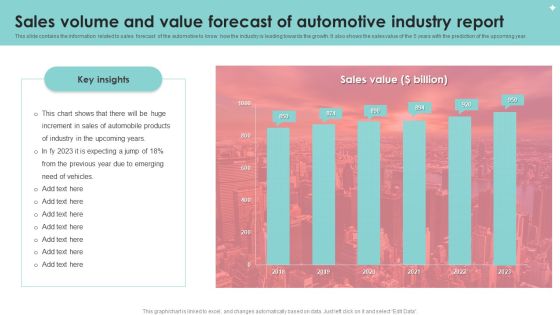
Sales Volume And Value Forecast Of Automotive Industry Report Diagrams PDF
This slide contains the information related to sales forecast of the automotive to know how the industry is leading towards the growth. It also shows the sales value of the 5 years with the prediction of the upcoming year. Showcasing this set of slides titled Sales Volume And Value Forecast Of Automotive Industry Report Diagrams PDF. The topics addressed in these templates are Sales Volume, Value Forecast, Automotive Industry Report. All the content presented in this PPT design is completely editable. Download it and make adjustments in color, background, font etc. as per your unique business setting.

Insider Threat In Cyber Security Detection And Prevention Dashboard Diagrams PDF
This slide shows dashboard for detecting and preventing insider threats. It provides details about antivirus, vector detection, patch, admin access, email security, network and endpoint threat, etc. Pitch your topic with ease and precision using this Insider Threat In Cyber Security Detection And Prevention Dashboard Diagrams PDF. This layout presents information on Active Clients, Network Threat Prevention, Endpoint Threat Prevention. It is also available for immediate download and adjustment. So, changes can be made in the color, design, graphics or any other component to create a unique layout.

Company Top Consulting Projects Progress Status Report Comparison Summary Diagrams PDF
The following slide showcases the status of two projects of a consulting services firm. The slide covers new, opened, in progress, completed and projects kept on hold. Pitch your topic with ease and precision using this Company Top Consulting Projects Progress Status Report Comparison Summary Diagrams PDF. This layout presents information on Company Top Consulting Projects Progress, Status Report Comparison Summary. It is also available for immediate download and adjustment. So, changes can be made in the color, design, graphics or any other component to create a unique layout.
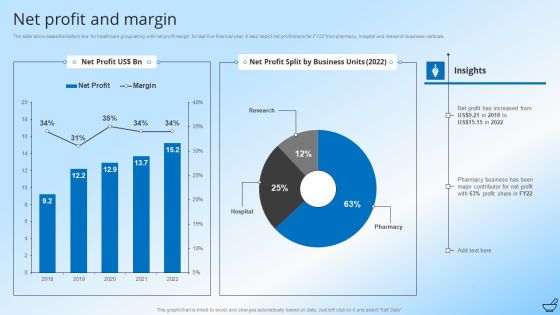
Pharmaceutical And Clinical Research Summary Net Profit And Margin Diagrams PDF
The slide showcases the bottom line for healthcare group along with net profit margin for last five financial year. It also depict net profit share for FY22 from pharmacy, hospital and research business verticals. Deliver an awe inspiring pitch with this creative Pharmaceutical And Clinical Research Summary Net Profit And Margin Diagrams PDF bundle. Topics like Pharmacy Business, Profit Share, Business Units can be discussed with this completely editable template. It is available for immediate download depending on the needs and requirements of the user.
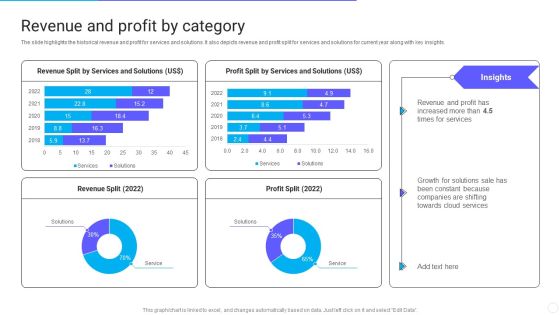
IT Application Services Company Outline Revenue And Profit By Category Diagrams PDF
The slide highlights the historical revenue and profit for services and solutions. It also depicts revenue and profit split for services and solutions for current year along with key insights. Deliver and pitch your topic in the best possible manner with this IT Application Services Company Outline Revenue And Profit By Category Diagrams PDF. Use them to share invaluable insights on Revenue Split, Profit Split, Services and impress your audience. This template can be altered and modified as per your expectations. So, grab it now.

Merger And Acquisition Buying Strategy For Business Growth Overview Of The Target Companys Operations Diagrams PDF
This slide gives an overview of the target companys operations. For the last five years, a business summary contains a firm introduction, mission and vision statement, financial highlights, and non performing assets. Deliver and pitch your topic in the best possible manner with this Merger And Acquisition Buying Strategy For Business Growth Overview Of The Target Companys Operations Diagrams PDF. Use them to share invaluable insights on Customers, Financial Highlights, Enterprises and impress your audience. This template can be altered and modified as per your expectations. So, grab it now.

Strategic Management Consultancy Business Profile Revenue Split By Geography And Business Areas Diagrams PDF
This slide showcases the revenue breakdown by geography such as Asia, North America, Australia, etc. It also covers business areas revenue split such as management consulting, IT consulting, etc. Deliver and pitch your topic in the best possible manner with this Strategic Management Consultancy Business Profile Revenue Split By Geography And Business Areas Diagrams PDF. Use them to share invaluable insights on Demand For Management, Consulting Services, Revenue and impress your audience. This template can be altered and modified as per your expectations. So, grab it now.

Buy Side Merger And Acquisition Pitch Book Overview Of The Target Companys Operations Diagrams PDF
This slide gives an overview of the target companys operations. For the last five years, a business summary contains a firm introduction, mission and vision statement, financial highlights, and non performing assets. Deliver and pitch your topic in the best possible manner with this Buy Side Merger And Acquisition Pitch Book Overview Of The Target Companys Operations Diagrams PDF. Use them to share invaluable insights on Financial Highlights, Enterprises, Customers and impress your audience. This template can be altered and modified as per your expectations. So, grab it now.
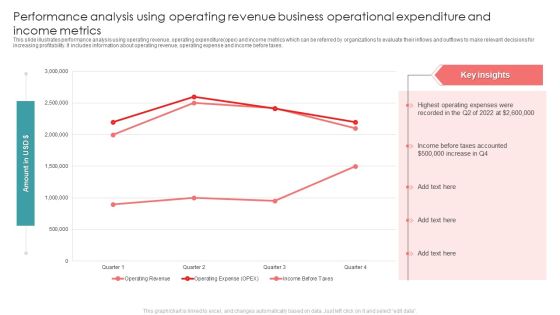
Performance Analysis Using Operating Revenue Business Operational Expenditure And Income Metrics Diagrams PDF
This slide illustrates performance analysis using operating revenue, operating expenditure opex and income metrics which can be referred by organizations to evaluate their inflows and outflows to make relevant decisions for increasing profitability. It includes information about operating revenue, operating expense and income before taxes. Pitch your topic with ease and precision using this Performance Analysis Using Operating Revenue Business Operational Expenditure And Income Metrics Diagrams PDF. This layout presents information on Taxes, Highest Operating, Recorded. It is also available for immediate download and adjustment. So, changes can be made in the color, design, graphics or any other component to create a unique layout.

COVID Impact Analysis On Food And Transportation Industry Ppt Infographic Template Diagrams PDF
This slide depicts impact of COVID-19 on multiple services of travel and tourism industry. It includes operations such as food services, lodging, air transportation, retail, recreation and amusement. Showcasing this set of slides titled COVID Impact Analysis On Food And Transportation Industry Ppt Infographic Template Diagrams PDF. The topics addressed in these templates are Food Services, Air Transportation Faced, Restrictions Travel Policy. All the content presented in this PPT design is completely editable. Download it and make adjustments in color, background, font etc. as per your unique business setting.

Impact On Customers Due To Poor Product Pricing Strategy Pricing Strategies For New Diagrams PDF
This template covers the high customer churn rate in the company due to poor product pricing strategy involved within the organization.Present like a pro with Impact On Customers Due To Poor Product Pricing Strategy Pricing Strategies For New Diagrams PDF Create beautiful presentations together with your team, using our easy-to-use presentation slides. Share your ideas in real-time and make changes on the fly by downloading our templates. So whether you are in the office, on the go, or in a remote location, you can stay in sync with your team and present your ideas with confidence. With Slidegeeks presentation got a whole lot easier. Grab these presentations today.

Brand Engagement Promotional Campaign Implementation Key Impact Of Promotional Event For Brand Awareness Diagrams PDF
This slide represents key impacts for promotional event. It covers site traffic, ROAS, customer lifetime value, engaged visit rate, page value etc. Find a pre designed and impeccable Brand Engagement Promotional Campaign Implementation Key Impact Of Promotional Event For Brand Awareness Diagrams PDF. The templates can ace your presentation without additional effort. You can download these easy to edit presentation templates to make your presentation stand out from others. So, what are you waiting for Download the template from Slidegeeks today and give a unique touch to your presentation.

Ad And Media Agency Company Profile Revenue And Net Profits Diagrams PDF
This slide focuses on financial highlights of advertising agency which represents revenue and net profits for last five years from 2018 to 2022. Welcome to our selection of the Ad And Media Agency Company Profile Revenue And Net Profits Diagrams PDF. These are designed to help you showcase your creativity and bring your sphere to life. Planning and Innovation are essential for any business that is just starting out. This collection contains the designs that you need for your everyday presentations. All of our PowerPoints are 100 percent editable, so you can customize them to suit your needs. This multi-purpose template can be used in various situations. Grab these presentation templates today.
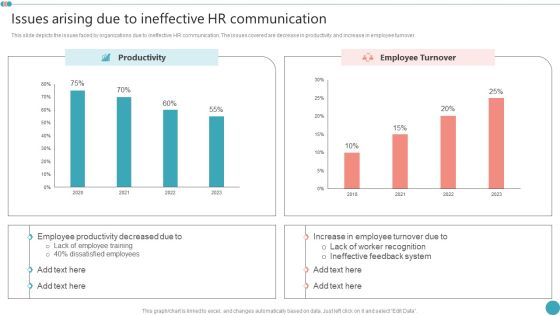
Issues Arising Due To Ineffective HR Communication Employee Engagement HR Strategy At Organization Diagrams PDF
This slide depicts the issues faced by organizations due to ineffective HR communication. The issues covered are decrease in productivity and increase in employee turnover.Want to ace your presentation in front of a live audience Our Issues Arising Due To Ineffective HR Communication Employee Engagement HR Strategy At Organization Diagrams PDF can help you do that by engaging all the users towards you.. Slidegeeks experts have put their efforts and expertise into creating these impeccable powerpoint presentations so that you can communicate your ideas clearly. Moreover, all the templates are customizable, and easy-to-edit and downloadable. Use these for both personal and commercial use.
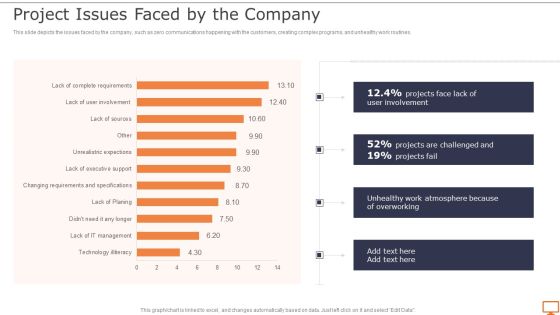
Deploying XP Practices To Enhance Operational Efficiency Project Issues Faced By The Company Diagrams PDF
This slide depicts the issues faced by the company, such as zero communications happening with the customers, creating complex programs, and unhealthy work routines.Want to ace your presentation in front of a live audience Our Deploying XP Practices To Enhance Operational Efficiency Project Issues Faced By The Company Diagrams PDF can help you do that by engaging all the users towards you.. Slidegeeks experts have put their efforts and expertise into creating these impeccable powerpoint presentations so that you can communicate your ideas clearly. Moreover, all the templates are customizable, and easy-to-edit and downloadable. Use these for both personal and commercial use.

Strategic Risk Management And Mitigation Plan Enterprise Cyber Risk Management Dashboard Diagrams PDF
This slide represents dashboard representing details related to management of strategic risks in the organization. It includes details related to risk rating breakdown, risk heat map, top 5 vulnerabilities etc. From laying roadmaps to briefing everything in detail, our templates are perfect for you. You can set the stage with your presentation slides. All you have to do is download these easy to edit and customizable templates. Strategic Risk Management And Mitigation Plan Enterprise Cyber Risk Management Dashboard Diagrams PDF will help you deliver an outstanding performance that everyone would remember and praise you for. Do download this presentation today.

Financial Kpi Dashboard To Evaluate Fundraising Impact Developing Fundraising Techniques Diagrams PDF
This slide showcases dashboard that can help organization to evaluate key changes in financial KPIs post fundraising. Its key components are net profit margin, revenue, gross profit margin, debt to equity and return on equity. From laying roadmaps to briefing everything in detail, our templates are perfect for you. You can set the stage with your presentation slides. All you have to do is download these easy-to-edit and customizable templates. Financial Kpi Dashboard To Evaluate Fundraising Impact Developing Fundraising Techniques Diagrams PDF will help you deliver an outstanding performance that everyone would remember and praise you for. Do download this presentation today.
Process Enhancement Plan To Boost Sales Performance Website Performance Tracking And Monitoring Dashboard Diagrams PDF
The following slide showcases a dashboard to track and measure website performance. It includes key elements such as visits, average session duration, bounce rate, page views, goal conversion, visits by week, traffic sources, top channels by conversions, etc. From laying roadmaps to briefing everything in detail, our templates are perfect for you. You can set the stage with your presentation slides. All you have to do is download these easy to edit and customizable templates. Process Enhancement Plan To Boost Sales Performance Website Performance Tracking And Monitoring Dashboard Diagrams PDF will help you deliver an outstanding performance that everyone would remember and praise you for. Do download this presentation today.
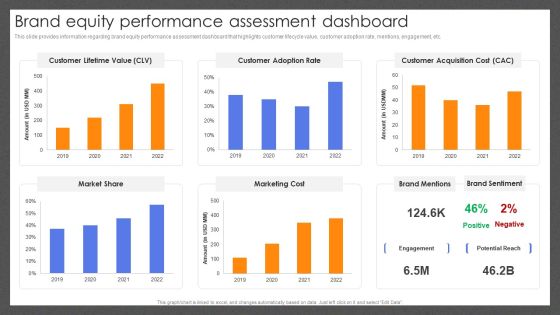
Guide For Effective Brand Brand Equity Performance Assessment Dashboard Diagrams PDF
This slide provides information regarding brand equity performance assessment dashboard that highlights customer lifecycle value, customer adoption rate, mentions, engagement, etc. Present like a pro with Guide For Effective Brand Brand Equity Performance Assessment Dashboard Diagrams PDF Create beautiful presentations together with your team, using our easy-to-use presentation slides. Share your ideas in real-time and make changes on the fly by downloading our templates. So whether youre in the office, on the go, or in a remote location, you can stay in sync with your team and present your ideas with confidence. With Slidegeeks presentation got a whole lot easier. Grab these presentations today.

Personal Branding Plan For Executives Metrics Addressing Social Media Followers Diagrams PDF
This slide illustrates key metrics that can be used by an influencer for addressing their social media followers over different channels such as Facebook, Twitter, Instagram along with their demographics. The Personal Branding Plan For Executives Metrics Addressing Social Media Followers Diagrams PDF is a compilation of the most recent design trends as a series of slides. It is suitable for any subject or industry presentation, containing attractive visuals and photo spots for businesses to clearly express their messages. This template contains a variety of slides for the user to input data, such as structures to contrast two elements, bullet points, and slides for written information. Slidegeeks is prepared to create an impression.

IOS Application Development Revenue Generated Through Developed Apps In 2022 Diagrams PDF
This slide demonstrates the profit generated by our developed apps for the clients in 2021, which is in billion US dollars. Slidegeeks has constructed IOS Application Development Revenue Generated Through Developed Apps In 2022 Diagrams PDF after conducting extensive research and examination. These presentation templates are constantly being generated and modified based on user preferences and critiques from editors. Here, you will find the most attractive templates for a range of purposes while taking into account ratings and remarks from users regarding the content. This is an excellent jumping off point to explore our content and will give new users an insight into our top notch PowerPoint Templates.

You Tube Advertising Influence Survey On Different Age Groups Ppt Diagram Ppt PDF
This slide represents the survey conducted by an organization in order to study the influence or effect which the you tube marketing has on various age groups of the country. Pitch your topic with ease and precision using this You Tube Advertising Influence Survey On Different Age Groups Ppt Diagram Ppt PDF. This layout presents information on Larger Influence, You Tube Marketing, Young Generation. It is also available for immediate download and adjustment. So, changes can be made in the color, design, graphics or any other component to create a unique layout.

Market Demand Equilibrium Gap Of Global Crude Oil Market Diagrams PDF
This slide showcase the effect on demand and supply in retail market.it also explain multiple factor that impacts demand and supply of different products in retail market. It includes consumer income, product price, number of supplier, technology advancement. Pitch your topic with ease and precision using this Market Demand Equilibrium Gap Of Global Crude Oil Market Diagrams PDF. This layout presents information on Demand And Supply, Production Rate, Average. It is also available for immediate download and adjustment. So, changes can be made in the color, design, graphics or any other component to create a unique layout.

Customer Support Center Call Center Action Plan Dashboard Highlighting Agent Diagrams PDF
This slide showcases dashboard for call center action plan which includes total calls, average answer speed, abandon rate, average calls per minute with agent performance and overall customer satisfaction score. Want to ace your presentation in front of a live audience Our Customer Support Center Call Center Action Plan Dashboard Highlighting Agent Diagrams PDF can help you do that by engaging all the users towards you.. Slidegeeks experts have put their efforts and expertise into creating these impeccable powerpoint presentations so that you can communicate your ideas clearly. Moreover, all the templates are customizable, and easy-to-edit and downloadable. Use these for both personal and commercial use.

Comprehensive Market Research Guide Growth Opportunities In Market Research Industry Diagrams PDF
The following slide outlines market size of global market research industry. Information covered in this slide is related to projected revenue from 2022 to 2030 and compound annual growth rate CAGR. Make sure to capture your audiences attention in your business displays with our gratis customizable Comprehensive Market Research Guide Growth Opportunities In Market Research Industry Diagrams PDF. These are great for business strategies, office conferences, capital raising or task suggestions. If you desire to acquire more customers for your tech business and ensure they stay satisfied, create your own sales presentation with these plain slides.

B2B And B2C Startups Marketing Mix Strategies 70 20 10 Rule Social Media Marketing Diagrams PDF
Purpose of the following slide is to display the best practices of utilizing social media marketing. It displays the 70 20 10 rule which defines the type of content to be posted on various social media platforms. Find a pre designed and impeccable B2B And B2C Startups Marketing Mix Strategies 70 20 10 Rule Social Media Marketing Diagrams PDF. The templates can ace your presentation without additional effort. You can download these easy to edit presentation templates to make your presentation stand out from others. So, what are you waiting for Download the template from Slidegeeks today and give a unique touch to your presentation.
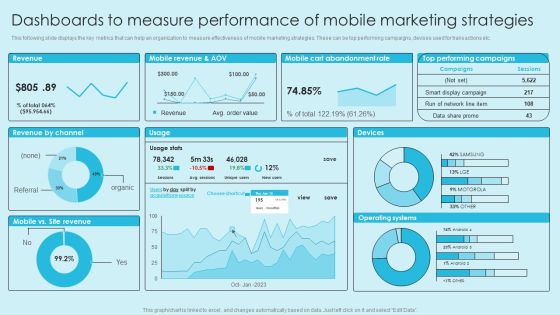
Online Marketing Techniques For Acquiring Clients Dashboards To Measure Performance Of Mobile Marketing Diagrams PDF
This following slide displays the key metrics that can help an organization to measure effectiveness of mobile marketing strategies. These can be top performing campaigns, devises used for transactions etc. Find a pre designed and impeccable Online Marketing Techniques For Acquiring Clients Dashboards To Measure Performance Of Mobile Marketing Diagrams PDF. The templates can ace your presentation without additional effort. You can download these easy to edit presentation templates to make your presentation stand out from others. So, what are you waiting for. Download the template from Slidegeeks today and give a unique touch to your presentation.

Crystal Methods In Agile Framework Impact Of Traditional Model Issues On Business Diagrams PDF
This slide depicts the impacts of the traditional model issues on the business, such as revenue loss and customer loss, by describing the number monthly from January to December. Take your projects to the next level with our ultimate collection of Crystal Methods In Agile Framework Impact Of Traditional Model Issues On Business Diagrams PDF. Slidegeeks has designed a range of layouts that are perfect for representing task or activity duration, keeping track of all your deadlines at a glance. Tailor these designs to your exact needs and give them a truly corporate look with your own brand colors they will make your projects stand out from the rest.
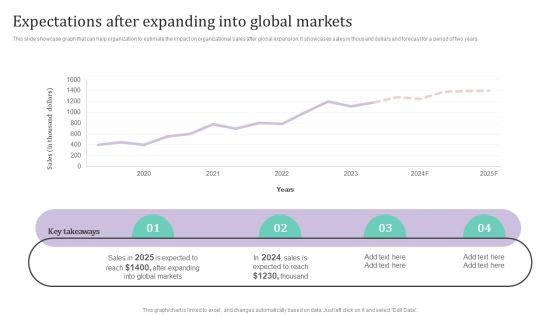
Expectations After Expanding Into Global Markets Ppt PowerPoint Presentation Diagram Lists PDF
This slide showcase graph that can help organization to estimate the impact on organizational sales after global expansion. It showcases sales in thousand dollars and forecast for a period of two years.Want to ace your presentation in front of a live audience Our Expectations After Expanding Into Global Markets Ppt PowerPoint Presentation Diagram Lists PDF can help you do that by engaging all the users towards you.. Slidegeeks experts have put their efforts and expertise into creating these impeccable powerpoint presentations so that you can communicate your ideas clearly. Moreover, all the templates are customizable, and easy-to-edit and downloadable. Use these for both personal and commercial use.

Social Media Influencer Marketing Upcoming Trends Ppt PowerPoint Presentation Diagram Templates PDF
This slide shows the statistical data of the survey conducted for gathering data related to the latest upcoming trends in the field of social media influencer marketing.Showcasing this set of slides titled Social Media Influencer Marketing Upcoming Trends Ppt PowerPoint Presentation Diagram Templates PDF. The topics addressed in these templates are Maintenance Transparency, Better Data Metrics, Integrate Influencers. All the content presented in this PPT design is completely editable. Download it and make adjustments in color, background, font etc. as per your unique business setting.

Successful Corporate Technique Enhancing Firms Performance Corporate Financial Performance Diagrams PDF
This slide provides information regarding dashboard utilized by firm to monitor financial performance. The performance is tracked through revenues generated, vendors associated, profit generated, etc. Find a pre designed and impeccable Successful Corporate Technique Enhancing Firms Performance Corporate Financial Performance Diagrams PDF. The templates can ace your presentation without additional effort. You can download these easy to edit presentation templates to make your presentation stand out from others. So, what are you waiting for Download the template from Slidegeeks today and give a unique touch to your presentation.
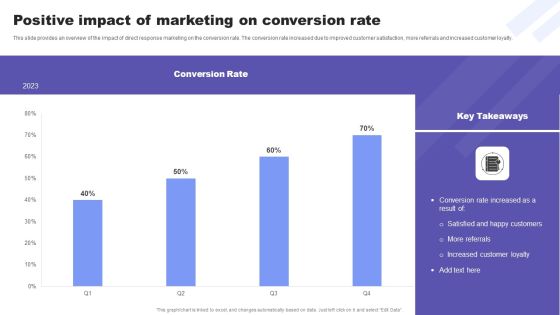
Direct Response Marketing Guide Ultimate Success Positive Impact Of Marketing On Diagrams PDF
This slide provides an overview of the impact of direct response marketing on the conversion rate. The conversion rate increased due to improved customer satisfaction, more referrals and increased customer loyalty. Make sure to capture your audiences attention in your business displays with our gratis customizable Direct Response Marketing Guide Ultimate Success Positive Impact Of Marketing On Diagrams PDF. These are great for business strategies, office conferences, capital raising or task suggestions. If you desire to acquire more customers for your tech business and ensure they stay satisfied, create your own sales presentation with these plain slides.
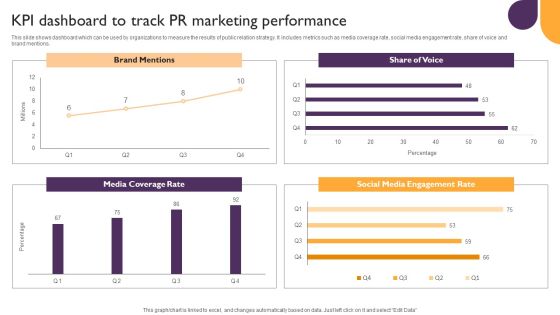
Public Relations Guide To Enhance Brand Credibility KPI Dashboard To Track PR Marketing Performance Diagrams PDF
This slide shows dashboard which can be used by organizations to measure the results of public relation strategy. It includes metrics such as media coverage rate, social media engagement rate, share of voice and brand mentions. Make sure to capture your audiences attention in your business displays with our gratis customizable Public Relations Guide To Enhance Brand Credibility KPI Dashboard To Track PR Marketing Performance Diagrams PDF. These are great for business strategies, office conferences, capital raising or task suggestions. If you desire to acquire more customers for your tech business and ensure they stay satisfied, create your own sales presentation with these plain slides.

Identifying And Increasing Brand Awareness Current Issues Faced By Company Diagrams PDF
This slide covers the current issues faced by company such as rise in bounce rate and low conversion rate due to low-quality content, slow loading time, ad heavy images, lack of sufficient information, poor website performance, etc. Want to ace your presentation in front of a live audience Our Identifying And Increasing Brand Awareness Current Issues Faced By Company Diagrams PDF can help you do that by engaging all the users towards you.. Slidegeeks experts have put their efforts and expertise into creating these impeccable powerpoint presentations so that you can communicate your ideas clearly. Moreover, all the templates are customizable, and easy-to-edit and downloadable. Use these for both personal and commercial use.
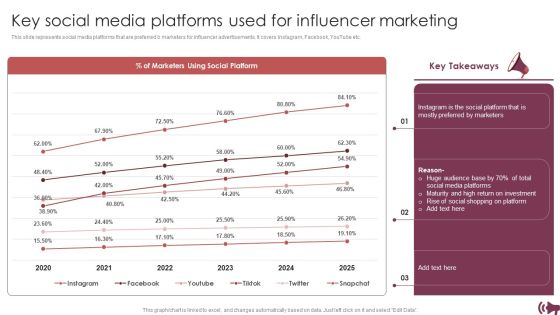
Guide Digital Advertising Optimize Lead Targeting Key Social Media Platforms Used For Influencer Marketing Diagrams PDF
This slide represents social media platforms that are preferred b marketers for influencer advertisements. It covers Instagram, Facebook, YouTube etc. Find a pre designed and impeccable Guide Digital Advertising Optimize Lead Targeting Key Social Media Platforms Used For Influencer Marketing Diagrams PDF. The templates can ace your presentation without additional effort. You can download these easy to edit presentation templates to make your presentation stand out from others. So, what are you waiting for Download the template from Slidegeeks today and give a unique touch to your presentation.

Showcasing The Results Of Resolving Employees Conflict Third Party Training Program Diagrams PDF
The purpose of this slide is to outline results of conflict management training program. The statistics covered in this slide is related to before and after impact of training program on employees performance. From laying roadmaps to briefing everything in detail, our templates are perfect for you. You can set the stage with your presentation slides. All you have to do is download these easy to edit and customizable templates. Showcasing The Results Of Resolving Employees Conflict Third Party Training Program Diagrams PDF will help you deliver an outstanding performance that everyone would remember and praise you for. Do download this presentation today.

Buy Side Merger And Acquisition Advisory Other Sectors Top Clients And Total Revenue Diagrams PDF
The slide identifies a list of companys clients in various other sectors manufacturing, construction, financials services, energy. Mining, automobile etc. along with the total revenue from each sector for the year 2021. Take your projects to the next level with our ultimate collection of Buy Side Merger And Acquisition Advisory Other Sectors Top Clients And Total Revenue Diagrams PDF. Slidegeeks has designed a range of layouts that are perfect for representing task or activity duration, keeping track of all your deadlines at a glance. Tailor these designs to your exact needs and give them a truly corporate look with your own brand colors they will make your projects stand out from the rest.
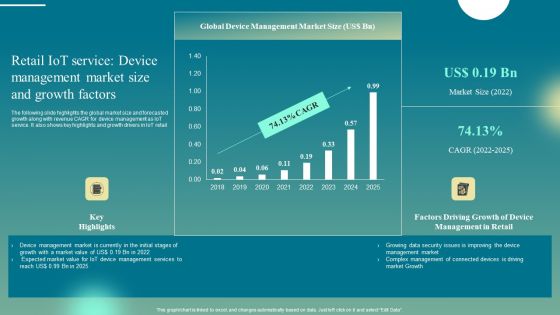
Retail Iot Service Device Management Market Size And Growth Factors Diagrams PDF
The following slide highlights the global market size and forecasted growth along with revenue CAGR for device management as IoT service. It also shows key highlights and growth drivers in IoT retail. If your project calls for a presentation, then Slidegeeks is your go-to partner because we have professionally designed, easy-to-edit templates that are perfect for any presentation. After downloading, you can easily edit Retail Iot Service Device Management Market Size And Growth Factors Diagrams PDF and make the changes accordingly. You can rearrange slides or fill them with different images. Check out all the handy templates
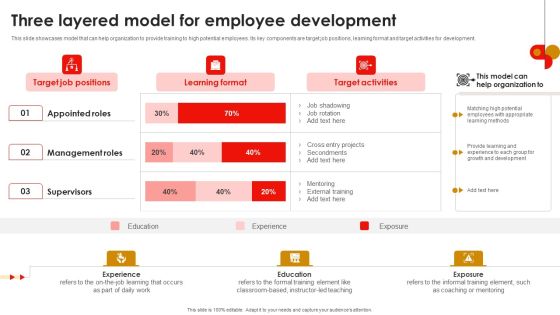
Strategic Talent Development Three Layered Model For Employee Development Diagrams PDF
This slide showcases model that can help organization to provide training to high potential employees. Its key components are target job positions, learning format and target activities for development. From laying roadmaps to briefing everything in detail, our templates are perfect for you. You can set the stage with your presentation slides. All you have to do is download these easy-to-edit and customizable templates. Strategic Talent Development Three Layered Model For Employee Development Diagrams PDF will help you deliver an outstanding performance that everyone would remember and praise you for. Do download this presentation today.
Facebook Advertising Campaign Performance Tracking Report Ppt PowerPoint Presentation Diagram Images PDF
This slide represents the dashboard to track and monitor the performance and effectiveness of Facebook advertising campaign. It includes details related to KPIs such as Facebook Ads amount spent, FB ads websites conversion etc. Make sure to capture your audiences attention in your business displays with our gratis customizable Facebook Advertising Campaign Performance Tracking Report Ppt PowerPoint Presentation Diagram Images PDF. These are great for business strategies, office conferences, capital raising or task suggestions. If you desire to acquire more customers for your tech business and ensure they stay satisfied, create your own sales presentation with these plain slides.

Average Customer Spending In Shopping Malls Ppt PowerPoint Presentation Diagram Images PDF
This slide represents average spending by customers in shopping malls on products and services. It covers information regarding customer buying behavior, sensory emotions, merchandizing offering etc. qIf your project calls for a presentation, then Slidegeeks is your go to partner because we have professionally designed, easy to edit templates that are perfect for any presentation. After downloading, you can easily edit Average Customer Spending In Shopping Malls Ppt PowerPoint Presentation Diagram Images PDF and make the changes accordingly. You can rearrange slides or fill them with different images. Check out all the handy templates

Coffee Cafe Company Profile Business Annual Net Profits And Margin Diagrams PDF
Following slide provides insights into Starbucks business net profits from previous five years. It includes yearly net profit, margin in percentage, and key takeaways. Want to ace your presentation in front of a live audience Our Coffee Cafe Company Profile Business Annual Net Profits And Margin Diagrams PDF can help you do that by engaging all the users towards you. Slidegeeks experts have put their efforts and expertise into creating these impeccable powerpoint presentations so that you can communicate your ideas clearly. Moreover, all the templates are customizable, and easy to edit and downloadable. Use these for both personal and commercial use.

Criteria Checklist To Select Billing Software For Businesses Ppt PowerPoint Presentation Diagram Templates PDF
Following slide shows checklist to select suitable software based on various features. It includes pointers such as data storing, automate multiple payments, data backup, reporting mechanisms etc. Make sure to capture your audiences attention in your business displays with our gratis customizable Criteria Checklist To Select Billing Software For Businesses Ppt PowerPoint Presentation Diagram Templates PDF. These are great for business strategies, office conferences, capital raising or task suggestions. If you desire to acquire more customers for your tech business and ensure they stay satisfied, create your own sales presentation with these plain slides.

Digital Media Streaming Platform Company Profile Disney User Demographics US Diagrams PDF
The following slide highlights the segregation of Disney users based on the individual age and ethnicity for US population. It help streaming platform to develop future strategies based on demographics data analysis Take your projects to the next level with our ultimate collection of Digital Media Streaming Platform Company Profile Disney User Demographics US Diagrams PDF. Slidegeeks has designed a range of layouts that are perfect for representing task or activity duration, keeping track of all your deadlines at a glance. Tailor these designs to your exact needs and give them a truly corporate look with your own brand colors they will make your projects stand out from the rest.
Providing Efficient Client Services Kpi Dashboard For Tracking Customer Retention Diagrams PDF
This slide covers the dashboard for analyzing customer loyalty with metrics such as NPS, loyal customer rate, premium users, CLV, customer churn, revenue churn, net retention, MRR growth, etc. Take your projects to the next level with our ultimate collection of Providing Efficient Client Services Kpi Dashboard For Tracking Customer Retention Diagrams PDF. Slidegeeks has designed a range of layouts that are perfect for representing task or activity duration, keeping track of all your deadlines at a glance. Tailor these designs to your exact needs and give them a truly corporate look with your own brand colors they will make your projects stand out from the rest.

Apparel Ecommerce Business Strategy Ecommerce Apparel Market Insights And Overview Diagrams PDF
This slide provides an overview of ecommerce apparel market. It includes market size value, revenue forecasted, CAGR and expected growth in mens apparel. Want to ace your presentation in front of a live audience Our Apparel Ecommerce Business Strategy Ecommerce Apparel Market Insights And Overview Diagrams PDF can help you do that by engaging all the users towards you. Slidegeeks experts have put their efforts and expertise into creating these impeccable powerpoint presentations so that you can communicate your ideas clearly. Moreover, all the templates are customizable, and easy to edit and downloadable. Use these for both personal and commercial use.

Concerns Regarding Poor Customer Service Ppt PowerPoint Presentation Diagram Images PDF
Are you in need of a template that can accommodate all of your creative concepts This one is crafted professionally and can be altered to fit any style. Use it with Google Slides or PowerPoint. Include striking photographs, symbols, depictions, and other visuals. Fill, move around, or remove text boxes as desired. Test out color palettes and font mixtures. Edit and save your work, or work with colleagues. Download Concerns Regarding Poor Customer Service Ppt PowerPoint Presentation Diagram Images PDF and observe how to make your presentation outstanding. Give an impeccable presentation to your group and make your presentation unforgettable.
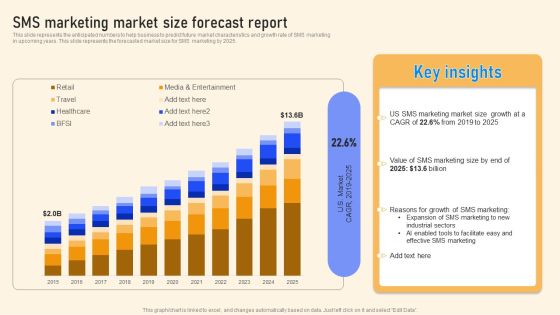
SMS Marketing Market Size Forecast Report Ppt PowerPoint Presentation File Diagrams PDF
This slide represents the anticipated numbers to help business to predict future market characteristics and growth rate of SMS marketing in upcoming years. This slide represents the forecasted market size for SMS marketing by 2025. From laying roadmaps to briefing everything in detail, our templates are perfect for you. You can set the stage with your presentation slides. All you have to do is download these easy to edit and customizable templates. SMS Marketing Market Size Forecast Report Ppt PowerPoint Presentation File Diagrams PDF will help you deliver an outstanding performance that everyone would remember and praise you for. Do download this presentation today.

Corporate Financial KPI Dashboard To Statement Cash Flow Of Company Diagrams PDF
This slide presents a financial dashboard of an enterprise which is being used to report the total spending power of a company. Key performing indicators include cash burn rate, monthly expenses, solvency etc. Showcasing this set of slides titled Corporate Financial KPI Dashboard To Statement Cash Flow Of Company Diagrams PDF. The topics addressed in these templates are Solvency, Debtors, Monthly Expenses. All the content presented in this PPT design is completely editable. Download it and make adjustments in color, background, font etc. as per your unique business setting.
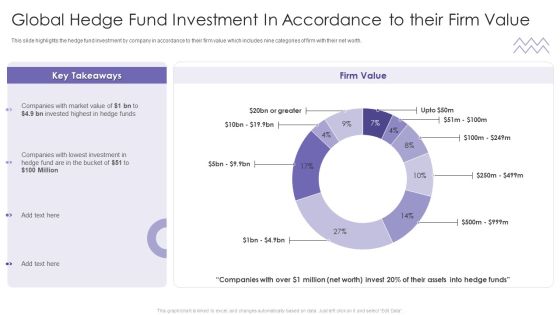
Evaluating Hedge Funds For Greater ROI Global Hedge Fund Investment In Accordance Rules PDF
This slide highlights the hedge fund investment by company in accordance to their firm value which includes nine categories of firm with their net worth. Deliver an awe inspiring pitch with this creative Evaluating Hedge Funds For Greater ROI Global Hedge Fund Investment In Accordance Rules PDF bundle. Topics like Firm Value, Companies, Market Value, Invested Highest can be discussed with this completely editable template. It is available for immediate download depending on the needs and requirements of the user.

Hedge Fund Risk Management Global Hedge Fund Investment In Accordance To Their Firm Value Microsoft PDF
This slide highlights the hedge fund investment by company in accordance to their firm value which includes nine categories of firm with their net worth. Deliver an awe inspiring pitch with this creative Hedge Fund Risk Management Global Hedge Fund Investment In Accordance To Their Firm Value Microsoft PDF bundle. Topics like Market Value, Investment, Global Hedge can be discussed with this completely editable template. It is available for immediate download depending on the needs and requirements of the user.
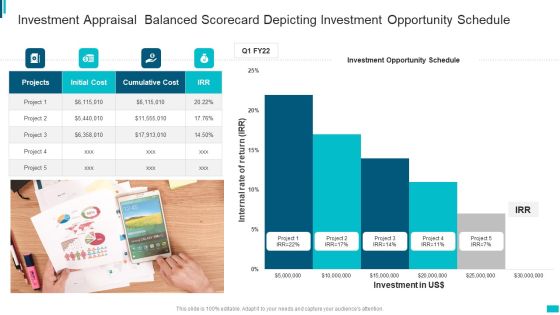
Investment Appraisal Balanced Scorecard Depicting Investment Opportunity Schedule Formats PDF
Deliver an awe inspiring pitch with this creative Investment Appraisal Balanced Scorecard Depicting Investment Opportunity Schedule Formats PDF bundle. Topics like Investment, Opportunity, Initial Cost, Cumulative Cost can be discussed with this completely editable template. It is available for immediate download depending on the needs and requirements of the user.

Strategic Sourcing And Supplier Quality Performance Analysis Of Business Suppliers Diagrams PDF
The slide represents the dashboard to illustrates the existing performance of business suppliers. It includes information regarding the suppliers availability, defect rate, compliance rate, sourcing time along with the efficiency details.Welcome to our selection of the Strategic Sourcing And Supplier Quality Performance Analysis Of Business Suppliers Diagrams PDF. These are designed to help you showcase your creativity and bring your sphere to life. Planning and Innovation are essential for any business that is just starting out. This collection contains the designs that you need for your everyday presentations. All of our PowerPoints are 100precent editable, so you can customize them to suit your needs. This multi-purpose template can be used in various situations. Grab these presentation templates today.
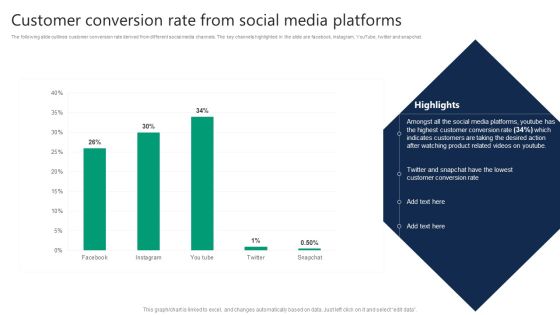
Formulating Video Marketing Strategies To Enhance Sales Customer Conversion Rate From Social Media Platforms Diagrams PDF
The following slide outlines customer conversion rate derived from different social media channels. The key channels highlighted in the slide are facebook, instagram, YouTube, twitter and snapchat. Are you in need of a template that can accommodate all of your creative concepts This one is crafted professionally and can be altered to fit any style. Use it with Google Slides or PowerPoint. Include striking photographs, symbols, depictions, and other visuals. Fill, move around, or remove text boxes as desired. Test out color palettes and font mixtures. Edit and save your work, or work with colleagues. Download Formulating Video Marketing Strategies To Enhance Sales Customer Conversion Rate From Social Media Platforms Diagrams PDF and observe how to make your presentation outstanding. Give an impeccable presentation to your group and make your presentation unforgettable.

Manufacturing Process Automation For Enhancing Productivity Supply Chain And Logistics RPA Management Dashboard Diagrams PDF
This slide illustrates supply chain and logistics robotic process automation RPA management dashboard. It provides information about active bots, bot hours, carton pickup, pickup productivity, etc. Present like a pro with Manufacturing Process Automation For Enhancing Productivity Supply Chain And Logistics RPA Management Dashboard Diagrams PDF Create beautiful presentations together with your team, using our easy to use presentation slides. Share your ideas in real time and make changes on the fly by downloading our templates. So whether you are in the office, on the go, or in a remote location, you can stay in sync with your team and present your ideas with confidence. With Slidegeeks presentation got a whole lot easier. Grab these presentations today.

Nielsen Business Profile Revenue And Operating Income Ppt PowerPoint Presentation Diagram PDF
This slide highlights the Nielsen company revenue and operating income for the last 3 years. It includes the data in million of US dollars with a key takeaways section. This Nielsen Business Profile Revenue And Operating Income Ppt PowerPoint Presentation Diagram PDF from Slidegeeks makes it easy to present information on your topic with precision. It provides customization options, so you can make changes to the colors, design, graphics, or any other component to create a unique layout. It is also available for immediate download, so you can begin using it right away. Slidegeeks has done good research to ensure that you have everything you need to make your presentation stand out. Make a name out there for a brilliant performance.
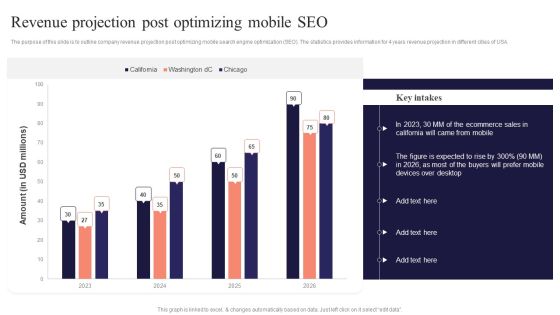
Revenue Projection Post Optimizing Mobile SEO Performing Mobile SEO Audit To Analyze Web Traffic Diagrams PDF
The purpose of this slide is to outline company revenue projection post optimizing mobile search engine optimization SEO. The statistics provides information for 4 years revenue projection in different cities of USA.Welcome to our selection of the Revenue Projection Post Optimizing Mobile SEO Performing Mobile SEO Audit To Analyze Web Traffic Diagrams PDF. These are designed to help you showcase your creativity and bring your sphere to life. Planning and Innovation are essential for any business that is just starting out. This collection contains the designs that you need for your everyday presentations. All of our PowerPoints are 100 precent editable, so you can customize them to suit your needs. This multi-purpose template can be used in various situations. Grab these presentation templates today.

New Product Launch Event Management Activities Event Planning Industry And Market Overview Diagrams PDF
This slide provides an overview of event planning industry. It includes facts and figures, industry market by type and region.Are you in need of a template that can accommodate all of your creative concepts This one is crafted professionally and can be altered to fit any style. Use it with Google Slides or PowerPoint. Include striking photographs, symbols, depictions, and other visuals. Fill, move around, or remove text boxes as desired. Test out color palettes and font mixtures. Edit and save your work, or work with colleagues. Download New Product Launch Event Management Activities Event Planning Industry And Market Overview Diagrams PDF and observe how to make your presentation outstanding. Give an impeccable presentation to your group and make your presentation unforgettable.
IT Business Alignment Framework Dashboard For Tracking Business And IT Alignment Diagrams PDF
This slide depicts the dashboard for business and IT alignment by covering details of total sales, customer support service, percentage of business operations aligned IT, usage of communication channels, and top performer associates.This IT Business Alignment Framework Dashboard For Tracking Business And IT Alignment Diagrams PDF from Slidegeeks makes it easy to present information on your topic with precision. It provides customization options, so you can make changes to the colors, design, graphics, or any other component to create a unique layout. It is also available for immediate download, so you can begin using it right away. Slidegeeks has done good research to ensure that you have everything you need to make your presentation stand out. Make a name out there for a brilliant performance.

Dashboard For Tracking Customer Service Team Performance Consumer Contact Point Guide Diagrams PDF
This slide covers the KPI dashboard for analyzing the performance of client support department. It includes metrics such as first call resolution, unresolved calls, average response rate, the best day to call, average time to solve issues, etc. The Dashboard For Tracking Customer Service Team Performance Consumer Contact Point Guide Diagrams PDF is a compilation of the most recent design trends as a series of slides. It is suitable for any subject or industry presentation, containing attractive visuals and photo spots for businesses to clearly express their messages. This template contains a variety of slides for the user to input data, such as structures to contrast two elements, bullet points, and slides for written information. Slidegeeks is prepared to create an impression.
 Home
Home