AI PPT Maker
Templates
PPT Bundles
Design Services
Business PPTs
Business Plan
Management
Strategy
Introduction PPT
Roadmap
Self Introduction
Timelines
Process
Marketing
Agenda
Technology
Medical
Startup Business Plan
Cyber Security
Dashboards
SWOT
Proposals
Education
Pitch Deck
Digital Marketing
KPIs
Project Management
Product Management
Artificial Intelligence
Target Market
Communication
Supply Chain
Google Slides
Research Services
 One Pagers
All Categories
-
Home
- Customer Favorites
- Figures
Figures

Arrow Drawing With Text Holders Ppt PowerPoint Presentation Icon Influencers
This is a arrow drawing with text holders ppt powerpoint presentation icon influencers. This is a one stage process. The stages in this process are hand drawn arrow, hand outlined arrow, hand designed.
Downward Curved Arrow Drawing Ppt PowerPoint Presentation Visual Aids Gallery
This is a downward curved arrow drawing ppt powerpoint presentation visual aids gallery. This is a one stage process. The stages in this process are hand drawn arrow, hand outlined arrow, hand designed.
Drawing Of Down Arrow Ppt PowerPoint Presentation Infographics Maker
This is a drawing of down arrow ppt powerpoint presentation infographics maker. This is a stage process. The stages in this process are hand drawn arrow, hand outlined arrow, hand designed.

Chart With Magnifying Glass For Business Research Ppt PowerPoint Presentation Inspiration Shapes
This is a chart with magnifying glass for business research ppt powerpoint presentation inspiration shapes. This is a two stage process. The stages in this process are metrics icon, kpis icon, statistics icon.

Demographic Statistics Icon Presenting Statistics Of People Graphics PDF
Showcasing this set of slides titled Demographic Statistics Icon Presenting Statistics Of People Graphics PDF. The topics addressed in these templates are Demographic Statistics, Icon Presenting, Statistic People. All the content presented in this PPT design is completely editable. Download it and make adjustments in color, background, font etc. as per your unique business setting.

Magnifying Glass Ppt PowerPoint Presentation Outline Clipart Images
This is a magnifying glass ppt powerpoint presentation outline clipart images. This is a one stage process. The stages in this process are business, marketing, success, data analysis, technology.

Statistics Graph Business PowerPoint Templates And PowerPoint Themes 0612
Statistics Graph Business PowerPoint Templates And PowerPoint Themes Business PPT-Microsoft Powerpoint Templates and Background with colorful stats icon

Statistical Data Analysis In Marketing PowerPoint Templates Ppt Backgrounds For Slides 0313
We present our Statistical Data Analysis In Marketing PowerPoint Templates PPT Backgrounds For Slides 0313.Download our Marketing PowerPoint Templates because Our PowerPoint Templates and Slides will let you Clearly mark the path for others to follow. Download our Success PowerPoint Templates because You have gained great respect for your brilliant ideas. Use our PowerPoint Templates and Slides to strengthen and enhance your reputation. Use our Finance PowerPoint Templates because Our PowerPoint Templates and Slides has conjured up a web of all you need with the help of our great team. Use them to string together your glistening ideas. Download our Business PowerPoint Templates because Our PowerPoint Templates and Slides help you pinpoint your timelines. Highlight the reasons for your deadlines with their use. Use our Shapes PowerPoint Templates because Our PowerPoint Templates and Slides ensures Effective communication. They help you put across your views with precision and clarity.Use these PowerPoint slides for presentations relating to The diagramme which shows the statistical data, marketing, success, business, shapes, finance. The prominent colors used in the PowerPoint template are Green, Red, Yellow.

Commercial And Urban Architect Business Profile Business Statistics Mockup PDF
This slide highlights the architecture company statistics which include public and private clients, total projects finalized, free cash flow, client satisfaction and sustainable contribution. Deliver an awe inspiring pitch with this creative Commercial And Urban Architect Business Profile Business Statistics Mockup PDF bundle. Topics like Revenue Contribution, Employees, Business Statistics can be discussed with this completely editable template. It is available for immediate download depending on the needs and requirements of the user.

Business Research And Analytics Vector Icon Ppt PowerPoint Presentation Professional Show
Presenting this set of slides with name business research and analytics vector icon ppt powerpoint presentation professional show. This is a three stage process. The stages in this process are data visualization icon, research analysis, business focus. This is a completely editable PowerPoint presentation and is available for immediate download. Download now and impress your audience.

Colorful Pie Chart Statistical Data PowerPoint Templates Ppt Backgrounds For Slides 0313
We present our Colorful Pie Chart Statistical Data PowerPoint Templates PPT Backgrounds For Slides 0313.Present our Pie Charts PowerPoint Templates because Our PowerPoint Templates and Slides offer you the needful to organise your thoughts. Use them to list out your views in a logical sequence. Present our Business PowerPoint Templates because It can Bubble and burst with your ideas. Use our Shapes PowerPoint Templates because Your audience will believe you are the cats whiskers. Present our Marketing PowerPoint Templates because It can be used to Set your controls for the heart of the sun. Our PowerPoint Templates and Slides will be the propellant to get you there. Download our Future PowerPoint Templates because Our PowerPoint Templates and Slides provide you with a vast range of viable options. Select the appropriate ones and just fill in your text. Use these PowerPoint slides for presentations relating to Development illustration of pie chart, pie charts, business, marketing, future, shapes. The prominent colors used in the PowerPoint template are Green, Red, Blue.
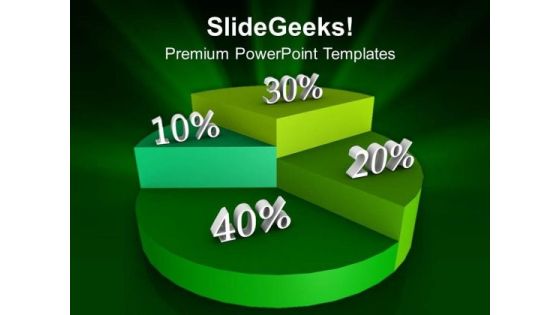
Statistical Data Analysis Marketing PowerPoint Templates Ppt Backgrounds For Slides 0313
We present our Statistical Data Analysis Marketing PowerPoint Templates PPT Backgrounds For Slides 0313.Download and present our Pie charts PowerPoint Templates because It will Raise the bar of your Thoughts. They are programmed to take you to the next level. Download our Signs PowerPoint Templates because You canTake a leap off the starting blocks with our PowerPoint Templates and Slides. They will put you ahead of the competition in quick time. Use our Shapes PowerPoint Templates because Our PowerPoint Templates and Slides are effectively colour coded to prioritise your plans They automatically highlight the sequence of events you desire. Download and present our Business PowerPoint Templates because You can Be the star of the show with our PowerPoint Templates and Slides. Rock the stage with your ideas. Download our Marketing PowerPoint Templates because You canTake a leap off the starting blocks with our PowerPoint Templates and Slides. They will put you ahead of the competition in quick time.Use these PowerPoint slides for presentations relating to Pie chart, Signs, Shapes, pie charts, business, marketing. The prominent colors used in the PowerPoint template are Green, Green lime , White.
Key Statistics Of Marketing Key Statistics Of Marketing Icons Slide Ppt PowerPoint Presentation Ideas Portrait PDF
Help your business to create an attention-grabbing presentation using our key statistics of marketing key statistics of marketing icons slide ppt powerpoint presentation ideas portrait pdf set of slides. The slide contains innovative icons that can be flexibly edited. Choose this key statistics of marketing key statistics of marketing icons slide ppt powerpoint presentation ideas portrait pdf template to create a satisfactory experience for your customers. Go ahead and click the download button.

Business Statistics Ppt Layout Ppt Slide Templates
This is a business statistics ppt layout ppt slide templates. This is a five stage process. The stages in this process are statistics and data mining, operations research, information systems, domain knowledge, it database.

Overview Of Key Insights From Cyber Threat Statistics Themes PDF
This slide covers statistics based on cyber crime trends. It includes stats on data thefts, mobile securities, security skills, data breach cost, etc. Showcasing this set of slides titled Overview Of Key Insights From Cyber Threat Statistics Themes PDF. The topics addressed in these templates are Overview Of Key Insights, Cyber Threat Statistics . All the content presented in this PPT design is completely editable. Download it and make adjustments in color, background, font etc. as per your unique business setting.

Data Statistics Charts And Key Performance Indicators Ppt Powerpoint Presentation Layouts Guide
This is a data statistics charts and key performance indicators ppt powerpoint presentation layouts guide. This is a four stage process. The stages in this process are business metrics, business kpi, business dashboard.

Country Profile Statistics Of Argentina Dashboard Ppt Ideas Clipart PDF
Presenting Country Profile Statistics Of Argentina Dashboard Ppt Ideas Clipart PDF to dispense important information. This template comprises one stages. It also presents valuable insights into the topics including Human Development Index, Global Ghg Emissions, GDP Per Capita. This is a completely customizable PowerPoint theme that can be put to use immediately. So, download it and address the topic impactfully.

Dashboard Of China Country Profile Statistics Ppt Gallery Vector PDF
Presenting Dashboard Of China Country Profile Statistics Ppt Gallery Vector PDF to dispense important information. This template comprises one stages. It also presents valuable insights into the topics including Development Index, GDP Per Capita, Global Adaptation Initiative. This is a completely customizable PowerPoint theme that can be put to use immediately. So, download it and address the topic impactfully.

United Kingdom Country Profile Statistics Dashboard Ppt Show Layout PDF
Presenting United Kingdom Country Profile Statistics Dashboard Ppt Show Layout PDF to dispense important information. This template comprises one stages. It also presents valuable insights into the topics including Human Development Index, GDP Per Capita, GHG Emissions. This is a completely customizable PowerPoint theme that can be put to use immediately. So, download it and address the topic impactfully.

France Country Profile Statistics With Human Development Index Introduction PDF
Presenting France Country Profile Statistics With Human Development Index Introduction PDF to dispense important information. This template comprises one stages. It also presents valuable insights into the topics including Global Ghg Emissions, Human Development Index, GDP Per Capita. This is a completely customizable PowerPoint theme that can be put to use immediately. So, download it and address the topic impactfully.

B2B Social Media Marketing Strategy Ppt PowerPoint Presentation Outline Influencers
This is a b2b social media marketing strategy ppt powerpoint presentation outline influencers. This is a three stage process. The stages in this process are b2b social media marketing strategy.
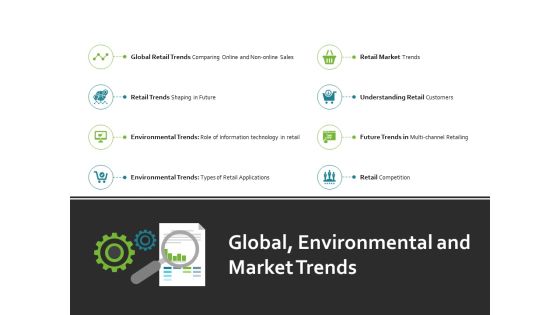
Global Environmental And Market Trends Ppt PowerPoint Presentation File Outline
This is a global environmental and market trends ppt powerpoint presentation file outline. This is a eight stage process. The stages in this process are retail competition, retail market, environmental trends, marketing, planning.

Business Diagram 3d Colorful Pie Graph With Magnifier Data Search PowerPoint Slide
This business slide displays 3d colorful pie graph with magnifier. This diagram is a data visualization tool that gives you a simple way to present statistical information. This slide helps your audience examine and interpret the data you present.

Business Diagram Data Driven Pie Chart Inside The Magnifier PowerPoint Slide
This business slide displays 3d colorful pie graph with magnifier. This diagram is a data visualization tool that gives you a simple way to present statistical information. This slide helps your audience examine and interpret the data you present.

Consumer Risk Assessment Reporting Icon Ppt Outline Graphics Design PDF
Presenting Consumer Risk Assessment Reporting Icon Ppt Outline Graphics Design PDF to dispense important information. This template comprises three stages. It also presents valuable insights into the topics including Consumer, Risk Assessment Reporting, Icon. This is a completely customizable PowerPoint theme that can be put to use immediately. So, download it and address the topic impactfully.

Cobots Global Statistics Global Statistics Of Collaborative Robots Mockup PDF
This slide depicts the global statistics of collaborative robots, such as their growth rate by 2025, up and down of selling price, total sale rate by 2025, and rate of orders throughout the different industries. Are you in need of a template that can accommodate all of your creative concepts This one is crafted professionally and can be altered to fit any style. Use it with Google Slides or PowerPoint. Include striking photographs, symbols, depictions, and other visuals. Fill, move around, or remove text boxes as desired. Test out color palettes and font mixtures. Edit and save your work, or work with colleagues. Download Cobots Global Statistics Global Statistics Of Collaborative Robots Mockup PDF and observe how to make your presentation outstanding. Give an impeccable presentation to your group and make your presentation unforgettable.
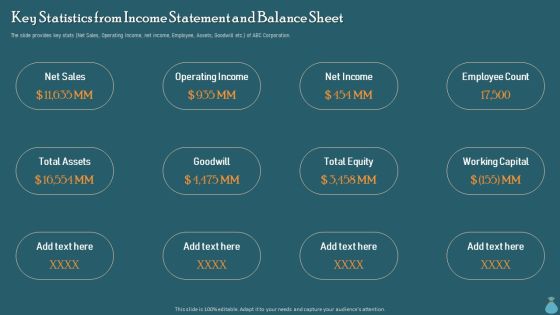
Financial Data Revelation To Varied Stakeholders Key Statistics From Income Statement And Balance Sheet Designs PDF
The slide provides key stats Net Sales, Operating Income, net income, Employee, Assets, Goodwill etc. of ABC Corporation. Do you have to make sure that everyone on your team knows about any specific topic I yes, then you should give Financial Data Revelation To Varied Stakeholders Key Statistics From Income Statement And Balance Sheet Designs PDF a try. Our experts have put a lot of knowledge and effort into creating this impeccable Financial Data Revelation To Varied Stakeholders Key Statistics From Income Statement And Balance Sheet Designs PDF. You can use this template for your upcoming presentations, as the slides are perfect to represent even the tiniest detail. You can download these templates from the Slidegeeks website and these are easy to edit. So grab these today.
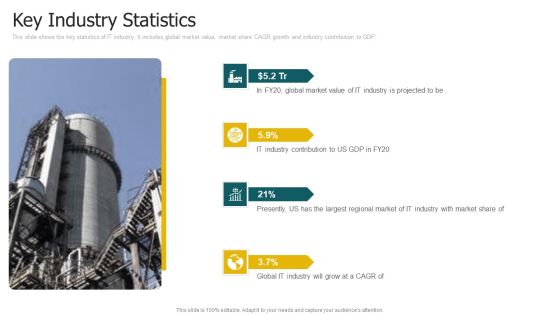
Key Industry Statistics Guidelines PDF
This slide shows the key statistics of IT industry. It includes global market value, market share CAGR growth and industry contribution to GDP. Deliver an awe inspiring pitch with this creative key industry statistics guidelines pdf bundle. Topics like key industry statistics can be discussed with this completely editable template. It is available for immediate download depending on the needs and requirements of the user.

South Africa Country Profile Statistics Dashboard Ppt Infographics Diagrams PDF
Persuade your audience using this South Africa Country Profile Statistics Dashboard Ppt Infographics Diagrams PDF. This PPT design covers one stages, thus making it a great tool to use. It also caters to a variety of topics including Human Development Index, GDP Per Capita, GHG Emissions. Download this PPT design now to present a convincing pitch that not only emphasizes the topic but also showcases your presentation skills.

Customer Engagement Statistics Diagram Ideas
This is a customer engagement statistics diagram ideas. This is a six stage process. The stages in this process are share, add as friend, follow me, like, comment.
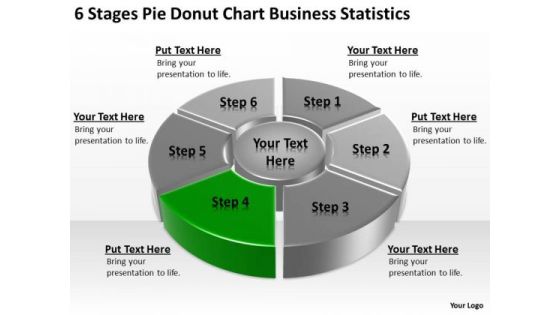
Business PowerPoint Templates Statistics Easy Plan
We present our business powerpoint templates statistics easy plan.Download our Communication PowerPoint Templates because You have the co-ordinates for your destination of success. Let our PowerPoint Templates and Slides map out your journey. Use our Finance PowerPoint Templates because Our PowerPoint Templates and Slides offer you the needful to organise your thoughts. Use them to list out your views in a logical sequence. Download and present our Business PowerPoint Templates because Our PowerPoint Templates and Slides are effectively colour coded to prioritise your plans They automatically highlight the sequence of events you desire. Present our Circle Charts PowerPoint Templates because Our PowerPoint Templates and Slides will let you Clearly mark the path for others to follow. Present our Shapes PowerPoint Templates because Our PowerPoint Templates and Slides are conceived by a dedicated team. Use them and give form to your wondrous ideas.Use these PowerPoint slides for presentations relating to Chart, wheel, pie, graph, vector, process, marketing, diagram, business, catalog, website, network, statistics, model, document, junction, plan, presentation, template, circle, brochure, data, stock, management, box, options, direction, design, company, navigation, financial, structure, button, goals, results. The prominent colors used in the PowerPoint template are Black, White, Green.
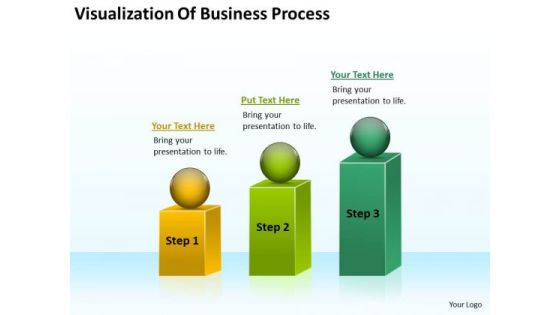
Visualization Of Business Process Ppt Plan PowerPoint Templates
We present our visualization of business process ppt plan PowerPoint templates.Present our Process and Flows PowerPoint Templates because Our PowerPoint Templates and Slides will Embellish your thoughts. They will help you illustrate the brilliance of your ideas. Download and present our Spheres PowerPoint Templates because It will Raise the bar of your Thoughts. They are programmed to take you to the next level. Use our Flow Charts PowerPoint Templates because Our PowerPoint Templates and Slides are conceived by a dedicated team. Use them and give form to your wondrous ideas. Use our Shapes PowerPoint Templates because Our PowerPoint Templates and Slides has conjured up a web of all you need with the help of our great team. Use them to string together your glistening ideas. Download and present our Marketing PowerPoint Templates because Our PowerPoint Templates and Slides will let you Leave a lasting impression to your audiences. They possess an inherent longstanding recall factor.Use these PowerPoint slides for presentations relating to Diagram, chart, market, statistics, square, grow, infograph, bar, corporate, business, vector, success, presentation, growing, circle, finance,analyst, goal, report, marketing, different, accounting, management, graph, illustration, geometric, sphere, design, growth, infographic, progress, profit,information, increase, aim, analyze, financial, rising, measure, block. The prominent colors used in the PowerPoint template are Green, Green lime, Yellow.
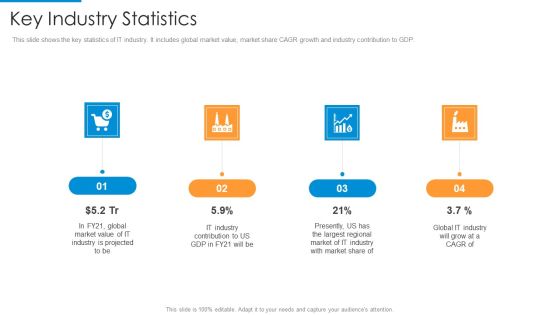
Key Industry Statistics Formats PDF
Presenting key industry statistics formats pdf to provide visual cues and insights. Share and navigate important information on four stages that need your due attention. This template can be used to pitch topics like key industry statistics. In addtion, this PPT design contains high resolution images, graphics, etc, that are easily editable and available for immediate download.
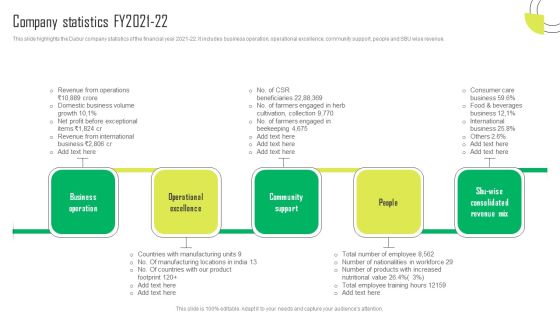
Herbal Products Company Profile Company Statistics FY2021 22 Pictures PDF
This slide highlights the Dabur company statistics of the financial year 2021-22. It includes business operation, operational excellence, community support, people and SBU wise revenue. Are you in need of a template that can accommodate all of your creative concepts This one is crafted professionally and can be altered to fit any style. Use it with Google Slides or PowerPoint. Include striking photographs, symbols, depictions, and other visuals. Fill, move around, or remove text boxes as desired. Test out color palettes and font mixtures. Edit and save your work, or work with colleagues. Download Herbal Products Company Profile Company Statistics FY2021 22 Pictures PDF and observe how to make your presentation outstanding. Give an impeccable presentation to your group and make your presentation unforgettable.

Statistical Research Template Presentation Ideas
This is a statistical research template presentation ideas. This is a five stage process. The stages in this process are general information, collect and capture, legal aspects, manage and preserve, release and publish.
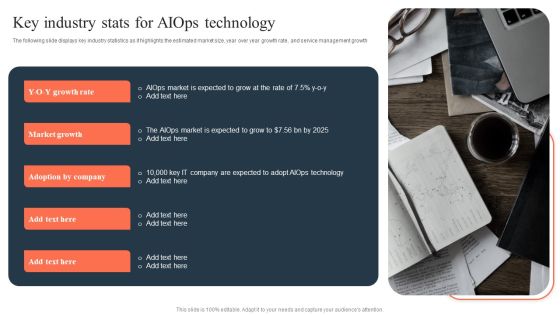
Ml And Big Data In Information Technology Processes Key Industry Stats For Aiops Technology Background PDF
The following slide displays key industry statistics as it highlights the estimated market size, year over year growth rate, and service management growth The best PPT templates are a great way to save time, energy, and resources. Slidegeeks have 100 percent editable powerpoint slides making them incredibly versatile. With these quality presentation templates, you can create a captivating and memorable presentation by combining visually appealing slides and effectively communicating your message. Download Ml And Big Data In Information Technology Processes Key Industry Stats For Aiops Technology Background PDF from Slidegeeks and deliver a wonderful presentation.

Business Corporate Ecommerce Statistics Powerpoint Slides
This PowerPoint template contains three tags with numeric data. You may download this slide to display business, corporate and ecommerce statistics. You can easily customize this template to make it more unique as per your need.

Planned Statistics Assessment Template Ppt Diagrams
This is a planned statistics assessment template ppt diagrams. This is a eight stage process. The stages in this process are quality context, competitors, stakeholders and users, processes and data, resources, evaluation, tools and techniques, structure.

Planned Statistics Assessment Template Powerpoint Themes
This is a planned statistics assessment template powerpoint themes. This is a eight stage process. The stages in this process are cleanse, group, stakeholder and users, technology and infrastructure, process and data, analyze, validate, collect.
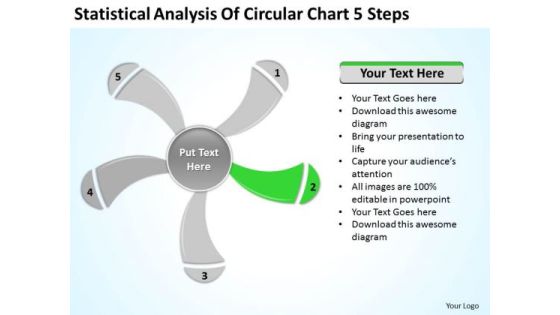
Statistical Analysis Of Circular Chart 5 Steps Ppt Business Plan PowerPoint Slide
We present our statistical analysis of circular chart 5 steps ppt business plan PowerPoint Slide.Download and present our Business PowerPoint Templates because Our PowerPoint Templates and Slides will definately Enhance the stature of your presentation. Adorn the beauty of your thoughts with their colourful backgrounds. Use our Signs PowerPoint Templates because Our PowerPoint Templates and Slides will give good value for money. They also have respect for the value of your time. Download our Shapes PowerPoint Templates because Our PowerPoint Templates and Slides team portray an attitude of elegance. Personify this quality by using them regularly. Use our Metaphors-Visual Concepts PowerPoint Templates because Our PowerPoint Templates and Slides will effectively help you save your valuable time. They are readymade to fit into any presentation structure. Use our Process and Flows PowerPoint Templates because our PowerPoint Templates and Slides are the string of your bow. Fire of your ideas and conquer the podium.Use these PowerPoint slides for presentations relating to graphically, graphic, vector, layout, business, computation, sign, infochart, visual, symbol, template, diagram, calculations, sector, data, revenue, schedule, element, analysis, drawing, report, technology, contour, classification, graph, modern, illustration, icon, comparison, object, chart, collection, science, color, growth, composition, professional, set, education, math, profits, information, symmetry, statistic, structure, infographics, button. The prominent colors used in the PowerPoint template are Green, Gray, White.

Statistical Analysis Of Circular Chart 5 Steps Ppt Business Plan PowerPoint Slides
We present our statistical analysis of circular chart 5 steps ppt business plan PowerPoint Slides.Download and present our Business PowerPoint Templates because Timeline crunches are a fact of life. Meet all deadlines using our PowerPoint Templates and Slides. Present our Signs PowerPoint Templates because You can Zap them with our PowerPoint Templates and Slides. See them reel under the impact. Use our Shapes PowerPoint Templates because It can Bubble and burst with your ideas. Download our Metaphors-Visual Concepts PowerPoint Templates because You can Create a matrix with our PowerPoint Templates and Slides. Feel the strength of your ideas click into place. Present our Process and Flows PowerPoint Templates because Our PowerPoint Templates and Slides has conjured up a web of all you need with the help of our great team. Use them to string together your glistening ideas.Use these PowerPoint slides for presentations relating to graphically, graphic, vector, layout, business, computation, sign, infochart, visual, symbol, template, diagram, calculations, sector, data, revenue, schedule, element, analysis, drawing, report, technology, contour, classification, graph, modern, illustration, icon, comparison, object, chart, collection, science, color, growth, composition, professional, set, education, math, profits, information, symmetry, statistic, structure, infographics, button. The prominent colors used in the PowerPoint template are Yellow, Gray, White.
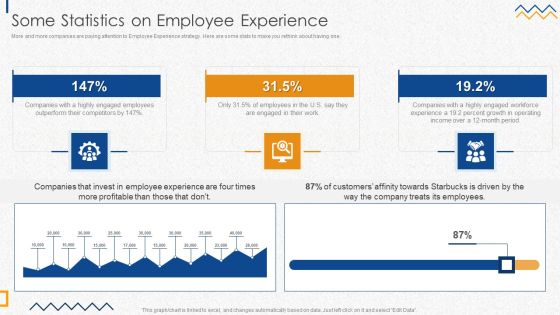
Some Statistics On Employee Experience Brochure PDF
More and more companies are paying attention to Employee Experience strategy. Here are some stats to make you rethink about having one.Deliver and pitch your topic in the best possible manner with this Some Statistics On Employee Experience Brochure PDF. Use them to share invaluable insights on Employee Experience, Treats Employees, Percent Growth and impress your audience. This template can be altered and modified as per your expectations. So, grab it now.

Bar Chart Business Analytics Vector Icon Ppt PowerPoint Presentation Layouts Shapes
Presenting this set of slides with name bar chart business analytics vector icon ppt powerpoint presentation layouts shapes. This is a three stage process. The stages in this process are data visualization icon, research analysis, business focus. This is a completely editable PowerPoint presentation and is available for immediate download. Download now and impress your audience.

Healthcare Industry Key Stats Ppt PowerPoint Presentation Show Shapes
Presenting this set of slides with name healthcare industry key stats ppt powerpoint presentation show shapes. The topics discussed in these slides are finance, marketing, management, investment, analysis. This is a completely editable PowerPoint presentation and is available for immediate download. Download now and impress your audience.

Country Profile Statistics Ppt PowerPoint Presentation Complete Deck With Slides
Boost your confidence and team morale with this well-structured Country Profile Statistics Ppt PowerPoint Presentation Complete Deck With Slides. This prefabricated set gives a voice to your presentation because of its well-researched content and graphics. Our experts have added all the components very carefully, thus helping you deliver great presentations with a single click. Not only that, it contains a set of thirteen slides that are designed using the right visuals, graphics, etc. Various topics can be discussed, and effective brainstorming sessions can be conducted using the wide variety of slides added in this complete deck. Apart from this, our PPT design contains clear instructions to help you restructure your presentations and create multiple variations. The color, format, design anything can be modified as deemed fit by the user. Not only this, it is available for immediate download. So, grab it now.
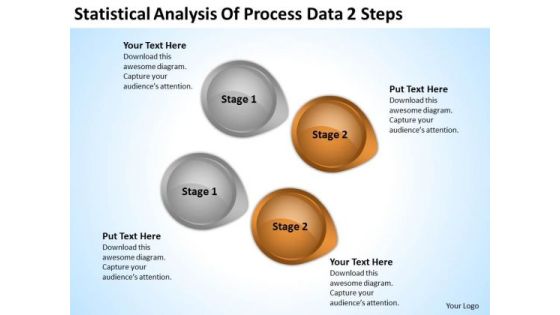
Arrow In PowerPoint Statistical Analysis Of Process Data 2 Steps Ppt Slide
We present our arrow in powerpoint statistical analysis of process data 2 steps ppt Slide.Download our Business PowerPoint Templates because Our PowerPoint Templates and Slides will weave a web of your great ideas. They are gauranteed to attract even the most critical of your colleagues. Use our Circle Charts PowerPoint Templates because Our PowerPoint Templates and Slides will let your words and thoughts hit bullseye everytime. Download our Arrows PowerPoint Templates because Our PowerPoint Templates and Slides will let you Hit the right notes. Watch your audience start singing to your tune. Download and present our Shapes PowerPoint Templates because You have the co-ordinates for your destination of success. Let our PowerPoint Templates and Slides map out your journey. Download and present our Signs PowerPoint Templates because It will let you Set new benchmarks with our PowerPoint Templates and Slides. They will keep your prospects well above par.Use these PowerPoint slides for presentations relating to 3d, abstract, analysis, arrow, background, business, button, chart, circle, circular, color, concept, conservation, cycle, development, diagram, direction, eco, ecology, energy, environment, flow, flowchart, globe, graphic, growing, growth, icon, internet, isolated, object, power, process, protection, recyclable, recycle, recycling, render, resource, saving, sign, solution, sphere, statistic, sustainable, symbol, technology, white. The prominent colors used in the PowerPoint template are Brown, Gray, Black. You can be sure our arrow in powerpoint statistical analysis of process data 2 steps ppt Slide are designed by professionals People tell us our button PowerPoint templates and PPT Slides will make the presenter look like a pro even if they are not computer savvy. You can be sure our arrow in powerpoint statistical analysis of process data 2 steps ppt Slide are designed by professionals Use our arrow PowerPoint templates and PPT Slides have awesome images to get your point across. Presenters tell us our arrow in powerpoint statistical analysis of process data 2 steps ppt Slide will make the presenter successul in his career/life. We assure you our arrow PowerPoint templates and PPT Slides are visually appealing.
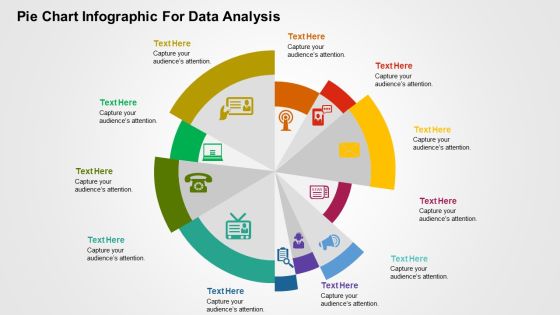
Pie Chart Infographic For Data Analysis PowerPoint Templates
This is one of the most downloaded PowerPoint template. This slide can be used for various purposes and to explain a number of processes. This can be included in your presentation to explain each step of a process and even include its relevance and importance in a single diagram. Using the uneven circular structure of the pie chart, the presenter can also explain random steps or highlight particular steps of process or parts of an organization or business that need special attention of any kind to the audience. Additionally, you can use this slide to show a transformation process or highlight key features of a product.

Healthcare Management Overview Trends Stats And Operational Areas Key Statistics Highlighting Most Common Website Issues Infographics PDF
The following slide showcases a graphical representation of major website issues faced by the healthcare organizations. No Hypertext Transfer Protocol HTTPS, broken links, outdated website design and slow load web page are the problems which are outlined in the slide. From laying roadmaps to briefing everything in detail, our templates are perfect for you. You can set the stage with your presentation slides. All you have to do is download these easy to edit and customizable templates. Healthcare Management Overview Trends Stats And Operational Areas Key Statistics Highlighting Most Common Website Issues Infographics PDF will help you deliver an outstanding performance that everyone would remember and praise you for. Do download this presentation today.
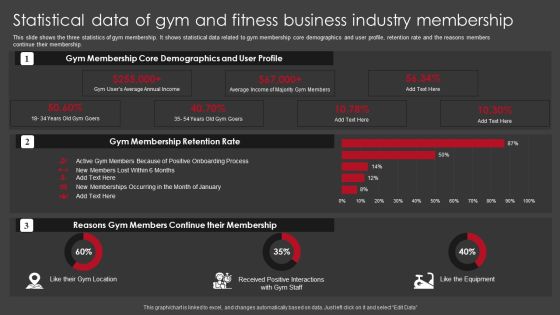
Statistical Data Of Gym And Fitness Business Industry Membership Brochure PDF
This slide shows the three statistics of gym membership. It shows statistical data related to gym membership core demographics and user profile, retention rate and the reasons members continue their membership. Showcasing this set of slides titled Statistical Data Of Gym And Fitness Business Industry Membership Brochure PDF. The topics addressed in these templates are Gym Membership Retention Rate, Reasons Gym Members, Continue Their Membership. All the content presented in this PPT design is completely editable. Download it and make adjustments in color, background, font etc. as per your unique business setting.
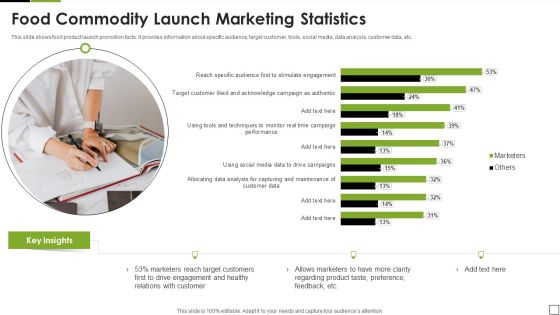
Food Commodity Launch Marketing Statistics Clipart PDF
This slide shows food product launch promotion facts. It provides information about specific audience, target customer, tools, social media, data analysis, customer data, etc. Showcasing this set of slides titled Food Commodity Launch Marketing Statistics Clipart PDF. The topics addressed in these templates are Target, Customers, Marketers. All the content presented in this PPT design is completely editable. Download it and make adjustments in color, background, font etc. as per your unique business setting.
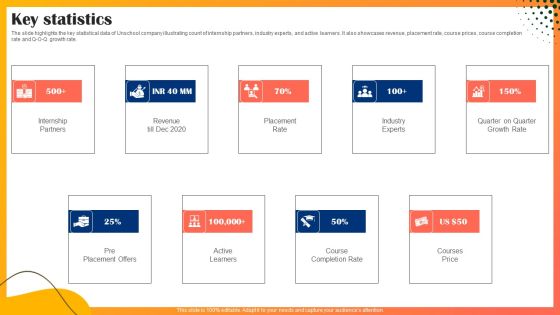
Educational Technology Company Outline Key Statistics Professional PDF
The slide highlights the key statistical data of Unschool company illustrating count of internship partners, industry experts, and active learners. It also showcases revenue, placement rate, course prices, course completion rate and Q-O-Q growth rate. Do you have to make sure that everyone on your team knows about any specific topic I yes, then you should give Educational Technology Company Outline Key Statistics Professional PDF a try. Our experts have put a lot of knowledge and effort into creating this impeccable Educational Technology Company Outline Key Statistics Professional PDF. You can use this template for your upcoming presentations, as the slides are perfect to represent even the tiniest detail. You can download these templates from the Slidegeeks website and these are easy to edit. So grab these today.
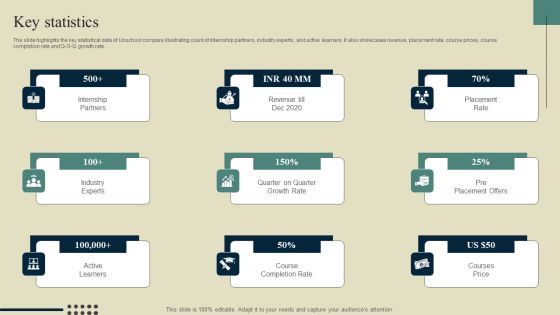
E Learning Platform Company Outline Key Statistics Brochure PDF
The slide highlights the key statistical data of Unschool company illustrating count of internship partners, industry experts, and active learners. It also showcases revenue, placement rate, course prices, course completion rate and Q-O-Q growth rate. Do you have to make sure that everyone on your team knows about any specific topic I yes, then you should give E Learning Platform Company Outline Key Statistics Brochure PDF a try. Our experts have put a lot of knowledge and effort into creating this impeccable E Learning Platform Company Outline Key Statistics Brochure PDF. You can use this template for your upcoming presentations, as the slides are perfect to represent even the tiniest detail. You can download these templates from the Slidegeeks website and these are easy to edit. So grab these today.
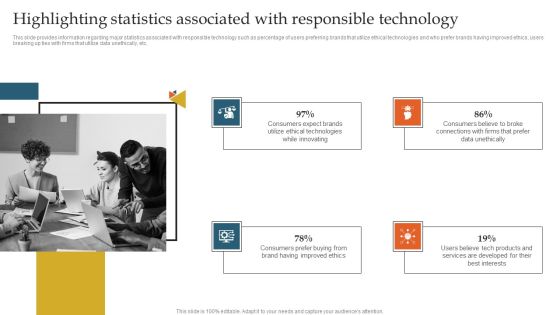
Highlighting Statistics Associated With Responsible Technology Ppt Outline PDF
This slide provides information regarding major statistics associated with responsible technology such as percentage of users preferring brands that utilize ethical technologies and who prefer brands having improved ethics, users breaking up ties with firms that utilize data unethically, etc. Formulating a presentation can take up a lot of effort and time, so the content and message should always be the primary focus. The visuals of the PowerPoint can enhance the presenters message, so our Highlighting Statistics Associated With Responsible Technology Ppt Outline PDF was created to help save time. Instead of worrying about the design, the presenter can concentrate on the message while our designers work on creating the ideal templates for whatever situation is needed. Slidegeeks has experts for everything from amazing designs to valuable content, we have put everything into Highlighting Statistics Associated With Responsible Technology Ppt Outline PDF.
Financial Risk Assessment Report For Startup Business Company Icon Portrait PDF
Presenting Financial Risk Assessment Report For Startup Business Company Icon Portrait PDF to dispense important information. This template comprises three stages. It also presents valuable insights into the topics including Financial Risk Assessment, Report For Startup, Business Company Icon. This is a completely customizable PowerPoint theme that can be put to use immediately. So, download it and address the topic impactfully.
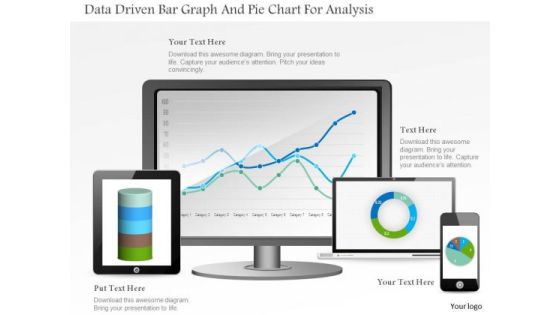
Business Diagram Data Driven Bar Graph And Pie Chart For Analysis PowerPoint Slide
This PowerPoint template displays technology gadgets with various business charts. Use this diagram slide, in your presentations to make business reports for statistical analysis. You may use this diagram to impart professional appearance to your presentations.
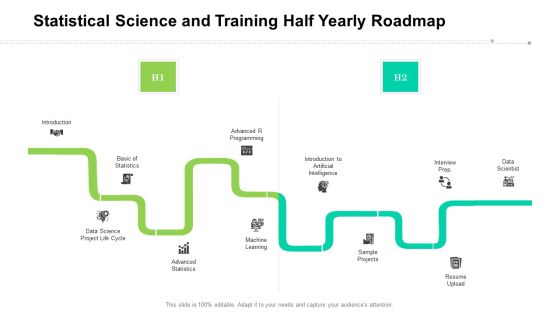
Statistical Science And Training Half Yearly Roadmap Portrait
Presenting our innovatively structured statistical science and training half yearly roadmap portrait Template. Showcase your roadmap process in different formats like PDF, PNG, and JPG by clicking the download button below. This PPT design is available in both Standard Screen and Widescreen aspect ratios. It can also be easily personalized and presented with modified font size, font type, color, and shapes to measure your progress in a clear way.

Key Informational Statistics On Workplace Conflict Portrait PDF
The purpose of this slide is to outline latest workplace conflict statistics. It covers information about employees experiencing verbal abuse, 6 month conflict between key stakeholders, employees feeling stress level etc. Take your projects to the next level with our ultimate collection of Key Informational Statistics On Workplace Conflict Portrait PDF. Slidegeeks has designed a range of layouts that are perfect for representing task or activity duration, keeping track of all your deadlines at a glance. Tailor these designs to your exact needs and give them a truly corporate look with your own brand colors they will make your projects stand out from the rest.

Marketing Agency Company Outline Company Website Engagement Statistics Guidelines PDF
The following slide depicts the digital engagement data of pureprofile company to monitor the business reach. It shows global traffic rank, monthly rank growth, visit duration, visit duration growth, page views, page views growth, bounce rate and bounce rate growth. Find highly impressive Marketing Agency Company Outline Company Website Engagement Statistics Guidelines PDF on Slidegeeks to deliver a meaningful presentation. You can save an ample amount of time using these presentation templates. No need to worry to prepare everything from scratch because Slidegeeks experts have already done a huge research and work for you. You need to download Marketing Agency Company Outline Company Website Engagement Statistics Guidelines PDF for your upcoming presentation. All the presentation templates are 100 percent editable and you can change the color and personalize the content accordingly. Download now.
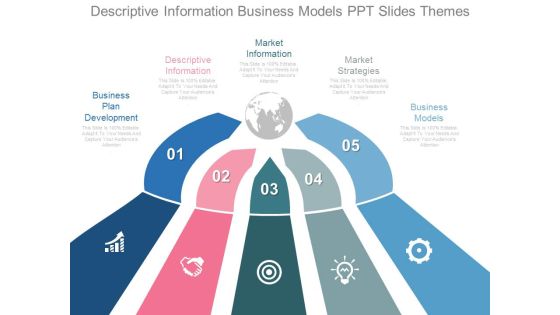
Descriptive Information Business Models Ppt Slides Themes
This is a descriptive information business models ppt slides themes. This is a five stage process. The stages in this process are globe, marketing, geographical.

Ramping Up Ppt PowerPoint Presentation Shapes
This is a ramping up ppt powerpoint presentation shapes. This is a four stage process. The stages in this process are business, strategy, management, process, arrow.
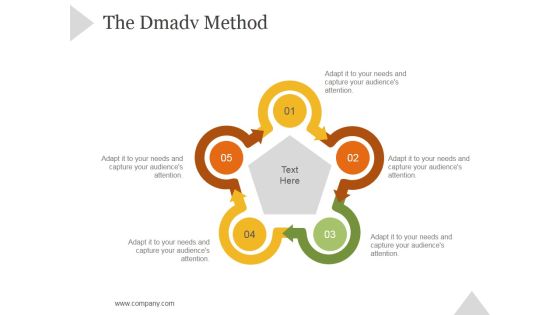
The Dmadv Method Ppt PowerPoint Presentation Shapes
This is a the dmadv method ppt powerpoint presentation shapes. This is a five stage process. The stages in this process are business, strategy, marketing, success.

Magnifying Glass Ppt PowerPoint Presentation Portfolio Shapes
This is a magnifying glass ppt powerpoint presentation portfolio shapes. This is a five stage process. The stages in this process are magnifier glass, research, business, marketing, focus.

Competitor Description Ppt PowerPoint Presentation Shapes
This is a competitor description ppt powerpoint presentation shapes. This is a four stage process. The stages in this process are turnover, top product, employees, sample product.

Drawing Book With Color Chart To Draw Creative Design Ppt PowerPoint Presentation File Outline PDF
Presenting drawing book with color chart to draw creative design ppt powerpoint presentation file outline pdf to dispense important information. This template comprises three stages. It also presents valuable insights into the topics including drawing book with color chart to draw creative design. This is a completely customizable PowerPoint theme that can be put to use immediately. So, download it and address the topic impactfully.
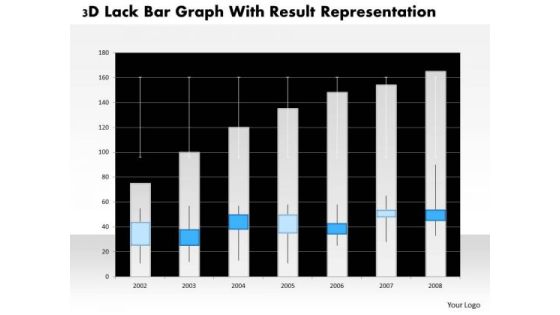
Business Diagram 3d Lack Bar Graph With Result Representation PowerPoint Slide
This business diagram has graphic of 3d lack bar graph. This diagram is a data visualization tool that gives you a simple way to present statistical information. This slide helps your audience examine and interpret the data you present.

Business Diagram Alarm Clock With Pie Chart For Result Analysis PowerPoint Slide
This business slide displays alarm clock with pie chart. This diagram is a data visualization tool that gives you a simple way to present statistical information. This slide helps your audience examine and interpret the data you present.

Business Diagram Battery Connected With Bulb For Idea Generation PowerPoint Slide
This business slide displays battery icon connected with bulb. This diagram is a data visualization tool that gives you a simple way to present statistical information. This slide helps your audience examine and interpret the data you present.
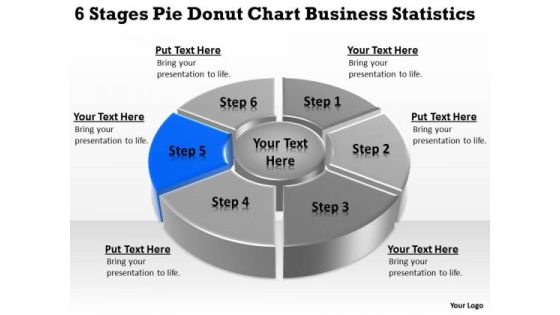
Templates Free Download Statistics Startup Business Plan Outline PowerPoint
We present our templates free download statistics startup business plan outline PowerPoint.Download our Process and Flows PowerPoint Templates because It can be used to Set your controls for the heart of the sun. Our PowerPoint Templates and Slides will be the propellant to get you there. Download our Circle Charts PowerPoint Templates because Our PowerPoint Templates and Slides will steer your racing mind. Hit the right buttons and spur on your audience. Present our Marketing PowerPoint Templates because You can Raise a toast with our PowerPoint Templates and Slides. Spread good cheer amongst your audience. Present our Flow Charts PowerPoint Templates because You can Double your output with our PowerPoint Templates and Slides. They make beating deadlines a piece of cake. Use our Business PowerPoint Templates because You can Rise to the occasion with our PowerPoint Templates and Slides. You will bring your audience on their feet in no time.Use these PowerPoint slides for presentations relating to Infographic, graph, chart, data, icon, diagram, progress, bar, line, download, button, pie, search, time, statistics, percent, segment, cloud, business, concept, sign,loading, symbol, template, circle, graphic, modern, status, visualization, roundabstract, management, mba, manage, illustration, weakness, strategy, project, clipart, guidelines, direction, design, organization, commerce, conceptual,heirarchy, resource, theoretical, action, goals, performance. The prominent colors used in the PowerPoint template are Blue, Gray, White.

Drawing Of Gear With Text Holders Ppt PowerPoint Presentation Infographics Brochure
This is a drawing of gear with text holders ppt powerpoint presentation infographics brochure. This is a one stage process. The stages in this process are drawing, sketch, outline.

Drawing Of Phone Receiver And Signals Ppt PowerPoint Presentation Professional Tips
This is a drawing of phone receiver and signals ppt powerpoint presentation professional tips. This is a one stage process. The stages in this process are drawing, sketch, outline.

Little Girl Drawing PowerPoint Icon C
adorable girl studying in the school a over white background

Little Girl Drawing PowerPoint Icon S
adorable girl studying in the school a over white background
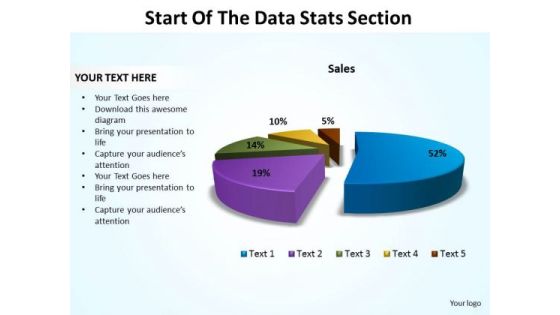
Business Marketing PowerPoint Templates Business Start Of The Data Stats Section Ppt Slides
Business Marketing PowerPoint Templates Business start of the data stats section PPT Slides-This Pie Chart is a simple template that provides a graphical, time-phased overview of a continuing sequence of stages, tasks, or events in a circular flow. You can divide a Pie Chart into segments for illustrating proportion-Business Marketing PowerPoint Templates Business start of the data stats section PPT Slides-This ppt can be used for concepts relating to-3d, Allocate, Allocation, Business, Chart, Circle, Data, Diagram, Divide, Division, Expensive, Financial, Graph Etc.

Big Strategic Database Driven Management Objectives Achievement Statistics Professional PDF
This slide covers different stats on data driven culture business goals. It also includes percentage value of goals achieved from management and analysis of big data, statistics on competitive advantage, improve profitability, etc.Showcasing this set of slides titled Big Strategic Database Driven Management Objectives Achievement Statistics Professional PDF. The topics addressed in these templates are Gain Competitive, Driving Increased, Revenue Opportunities. All the content presented in this PPT design is completely editable. Download it and make adjustments in color, background, font etc. as per your unique business setting.

Automobile OEM Export Trade Statistics Download PDF
This slide showcases statistical data on automobile original equipment manufacturer export sales. It shows exports by different manufacturers in fiscal years and their percentage growth. Showcasing this set of slides titled Automobile OEM Export Trade Statistics Download PDF. The topics addressed in these templates are The Swing, Hyundai India, Ford India. All the content presented in this PPT design is completely editable. Download it and make adjustments in color, background, font etc. as per your unique business setting.

Diversity And Inclusion Statistics For Workplace Job Positions Training Ppt
This slide represents the D and I data for various job profiles such as Top Executives, Senior Managers, Managers, Professionals, and Support Staff in the USA. It is important to know what message data gives us on the extent of D and I implementation across US organizations and their comparison with the world.
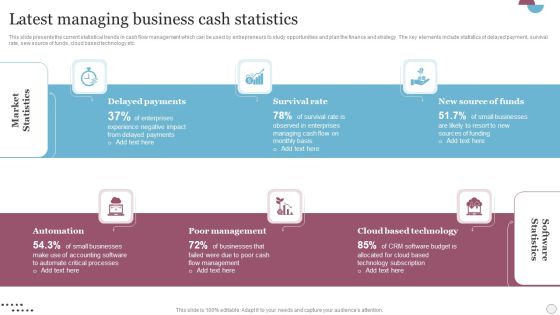
Latest Managing Business Cash Statistics Demonstration PDF
This slide presents the current statistical trends in cash flow management which can be used by entrepreneurs to study opportunities and plan the finance and strategy. The key elements include statistics of delayed payment, survival rate, sew source of funds, cloud based technology etc. Persuade your audience using this Latest Managing Business Cash Statistics Demonstration PDF. This PPT design covers two stages, thus making it a great tool to use. It also caters to a variety of topics including Delayed Payments, Automation, Cloud Based Technology. Download this PPT design now to present a convincing pitch that not only emphasizes the topic but also showcases your presentation skills.

Business Diagram Tablet With Pie And Business Bar Graph For Result Analysis PowerPoint Slide
This PowerPoint template displays technology gadgets with various business charts. Use this diagram slide, in your presentations to make business reports for statistical analysis. You may use this diagram to impart professional appearance to your presentations.
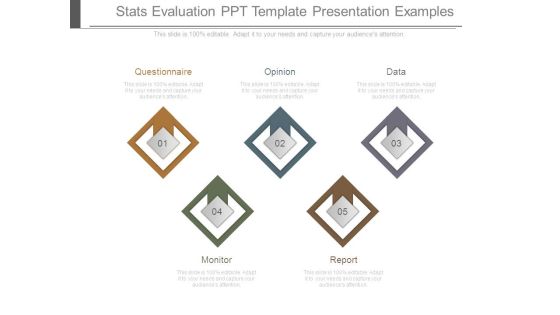
Stats Evaluation Ppt Template Presentation Examples
This is a stats evaluation ppt template presentation examples. This is a five stage process. The stages in this process are questionnaire, opinion, data, monitor, report.

Texting Platforms User Statistics For Marketers Portrait PDF
Showcasing this set of slides titled texting platforms user statistics for marketers portrait pdf. The topics addressed in these templates are texting platforms user statistics for marketers. All the content presented in this PPT design is completely editable. Download it and make adjustments in color, background, font etc. as per your unique business setting.
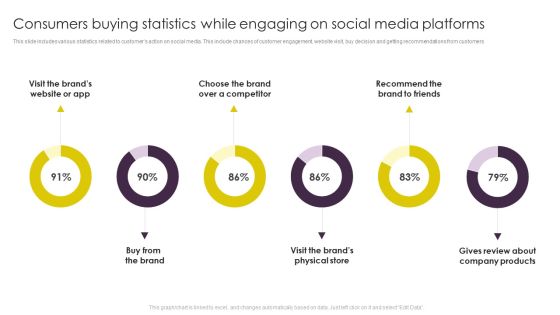
Implementing Digital Marketing Consumers Buying Statistics While Engaging Portrait PDF
This slide includes various statistics related to customers action on social media. This include chances of customer engagement, website visit, buy decision and getting recommendations from customers. Create an editable Implementing Digital Marketing Consumers Buying Statistics While Engaging Portrait PDF that communicates your idea and engages your audience. Whether youre presenting a business or an educational presentation, pre-designed presentation templates help save time. Implementing Digital Marketing Consumers Buying Statistics While Engaging Portrait PDF is highly customizable and very easy to edit, covering many different styles from creative to business presentations. Slidegeeks has creative team members who have crafted amazing templates. So, go and get them without any delay.

Accounting Industry Statistics Ppt PowerPoint Presentation Inspiration Portrait Cpb Pdf
Presenting this set of slides with name accounting industry statistics ppt powerpoint presentation inspiration portrait cpb pdf. This is an editable Powerpoint four stages graphic that deals with topics like accounting industry statistics to help convey your message better graphically. This product is a premium product available for immediate download and is 100 percent editable in Powerpoint. Download this now and use it in your presentations to impress your audience.

Statistics Related To Dcaas Summary PDF
Following slide brings forth various statistics which are related to data center as a service industry which can be used by business managers to take requisite actions. The key statistics related to cloud spending, artificial intelligence, video streaming, recovery services, user spending etc. Presenting Statistics Related To Dcaas Summary PDF to dispense important information. This template comprises six stages. It also presents valuable insights into the topics including Aggregate Spending, Streaming Market, Statistics Related. This is a completely customizable PowerPoint theme that can be put to use immediately. So, download it and address the topic impactfully.

Magnifying Glass Ppt PowerPoint Presentation Outline
This is a magnifying glass ppt powerpoint presentation outline. This is a six stage process. The stages in this process are magnifying glass, icons, process, marketing, business.

Data Organization Five Years Roadmap With Statistics And Machine Learning Guidelines
Introducing our data organization five years roadmap with statistics and machine learning guidelines. This PPT presentation is Google Slides compatible, therefore, you can share it easily with the collaborators for measuring the progress. Also, the presentation is available in both standard screen and widescreen aspect ratios. So edit the template design by modifying the font size, font type, color, and shapes as per your requirements. As this PPT design is fully editable it can be presented in PDF, JPG and PNG formats.
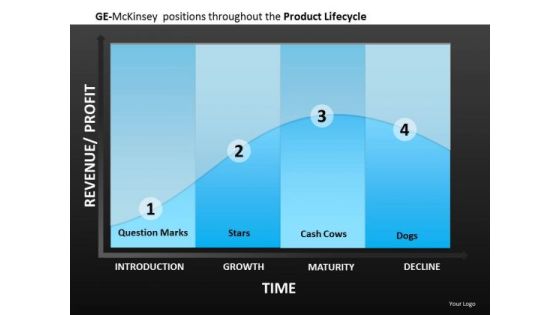
Ge Mckinsey Matrix Statistical Curve PowerPoint Templates
GE McKinsey Matrix Statistical Curve PowerPoint templates-These high quality, editable pre-designed powerpoint slides have been carefully created by our professional team to help you impress your audience. Each graphic in every slide is vector based and is 100% editable in powerpoint. Each and every property of any slide - color, size, shading etc can be modified to build an effective powerpoint presentation. Use these slides to convey complex business concepts in a simplified manner. Any text can be entered at any point in the powerpoint slide. Simply DOWNLOAD, TYPE and PRESENT!

SMM Statistics Ppt PowerPoint Presentation Summary Slide Portrait
Presenting this set of slides with name smm statistics ppt powerpoint presentation summary slide portrait. This is a five stage process. The stages in this process are business, management, planning, strategy, marketing. This is a completely editable PowerPoint presentation and is available for immediate download. Download now and impress your audience.
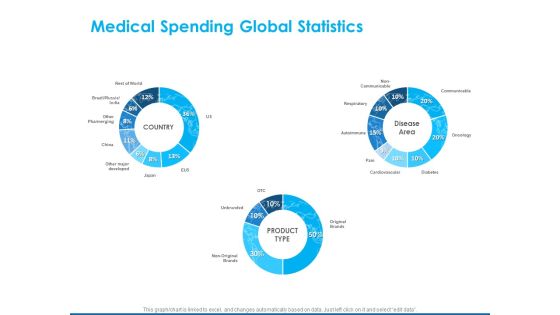
Overview Healthcare Business Management Medical Spending Global Statistics Portrait PDF
Presenting this set of slides with name overview healthcare business management medical spending global statistics portrait pdf. The topics discussed in these slides are communicable, oncology, diabetes, cardiovascular, autoimmune, respiratory, non communicable. This is a completely editable PowerPoint presentation and is available for immediate download. Download now and impress your audience.

Artificial Intelligence Key Statistics Ppt Slides Portrait PDF
Presenting this set of slides with name artificial intelligence key statistics ppt slides portrait pdf. This is a three stage process. The stages in this process are organization, strategy, revenue, technology, success. This is a completely editable PowerPoint presentation and is available for immediate download. Download now and impress your audience.
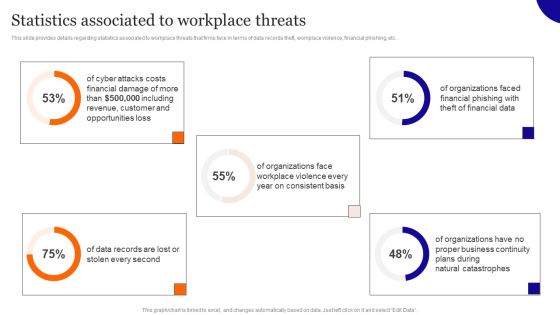
Statistics Associated To Workplace Threats Diagrams PDF
This slide provides details regarding statistics associated to workplace threats that firms face in terms of data records theft, workplace violence, financial phishing, etc. Get a simple yet stunning designed Statistics Associated To Workplace Threats Diagrams PDF. It is the best one to establish the tone in your meetings. It is an excellent way to make your presentations highly effective. So, download this PPT today from Slidegeeks and see the positive impacts. Our easy-to-edit Statistics Associated To Workplace Threats Diagrams PDF can be your go-to option for all upcoming conferences and meetings. So, what are you waiting for Grab this template today.

Employee Wellness Statistics Ppt PowerPoint Presentation Outline Gridlines
This is a employee wellness statistics ppt powerpoint presentation outline gridlines. This is a five stage process. The stages in this process are employee wellness statistics.

Advertising Industry Statistics Ppt PowerPoint Presentation Outline Diagrams Cpb
This is a advertising industry statistics ppt powerpoint presentation outline diagrams cpb. This is a four stage process. The stages in this process are advertising industry statistics.

Baby Boomers Statistics Ppt PowerPoint Presentation Outline Files Cpb
This is a baby boomers statistics ppt powerpoint presentation outline files cpb. This is a four stage process. The stages in this process are baby boomers statistics.

5 Concentric Shapes Statistical Researches Ppt How Business Plan PowerPoint Slides
We present our 5 concentric shapes statistical researches ppt how business plan PowerPoint Slides.Download our Business PowerPoint Templates because Our PowerPoint Templates and Slides are specially created by a professional team with vast experience. They diligently strive to come up with the right vehicle for your brilliant Ideas. Present our Marketing PowerPoint Templates because You have the co-ordinates for your destination of success. Let our PowerPoint Templates and Slides map out your journey. Present our Process and Flows PowerPoint Templates because Our PowerPoint Templates and Slides will let you Hit the right notes. Watch your audience start singing to your tune. Present our Shapes PowerPoint Templates because Our PowerPoint Templates and Slides are like the strings of a tennis racquet. Well strung to help you serve aces. Download and present our Flow Charts PowerPoint Templates because Our PowerPoint Templates and Slides will let you Clearly mark the path for others to follow.Use these PowerPoint slides for presentations relating to Star, icon, blue, website, isolated, business, concept, vector, sign, render, glossy, internet, shadow, value, element, security, equipment, cute, illustration, sale, web, real, info, information, conceptual, environment, button. The prominent colors used in the PowerPoint template are Blue, Blue light, Blue navy.

Data Analysis Template Driven Visualization Area Chart PowerPoint Slides Templates
Draw On The Energy Of Our data analysis template driven visualization area chart powerpoint slides Templates . Your Thoughts Will Perk Up.
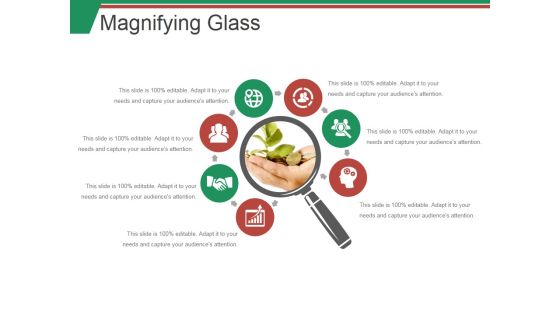
Magnifying Glass Ppt PowerPoint Presentation Slides Portrait
This is a magnifying glass ppt powerpoint presentation slides portrait. This is a seven stage process. The stages in this process are icons, business, magnify, strategy, planning.
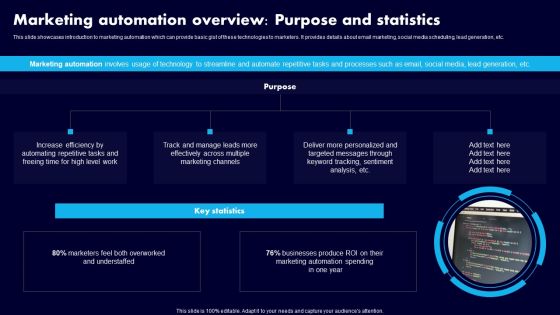
Marketing Automation Overview Purpose And Statistics Ppt Outline Template PDF
This slide showcases introduction to marketing automation which can provide basic gist of these technologies to marketers. It provides details about email marketing, social media scheduling, lead generation, etc. This modern and well-arranged Marketing Automation Overview Purpose And Statistics Ppt Outline Template PDF provides lots of creative possibilities. It is very simple to customize and edit with the Powerpoint Software. Just drag and drop your pictures into the shapes. All facets of this template can be edited with Powerpoint, no extra software is necessary. Add your own material, put your images in the places assigned for them, adjust the colors, and then you can show your slides to the world, with an animated slide included.

Global Organization Sustainability Reporting Statistics Inspiration PDF
This slide highlights statistical data of global business for sustainability reporting to provide transparency on the companys contribution to sustainable development. It includes key components such as global business, top companies, globally followed corporate practices, etc. Pitch your topic with ease and precision using this Global Organization Sustainability Reporting Statistics Inspiration PDF This layout presents information on Business Sustainability, Sustainability, Corporate Practice. It is also available for immediate download and adjustment. So, changes can be made in the color, design, graphics or any other component to create a unique layout.
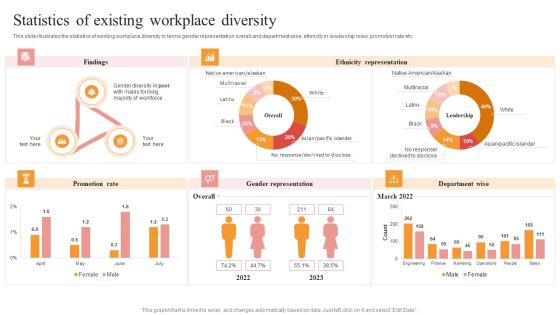
Statistics Of Existing Workplace Diversity Ideas PDF
This slide illustrates the statistics of existing workplace diversity in terms gender representation overall and department wise, ethnicity in leadership roles, promotion rate etc. The Statistics Of Existing Workplace Diversity Ideas PDF is a compilation of the most recent design trends as a series of slides. It is suitable for any subject or industry presentation, containing attractive visuals and photo spots for businesses to clearly express their messages. This template contains a variety of slides for the user to input data, such as structures to contrast two elements, bullet points, and slides for written information. Slidegeeks is prepared to create an impression.

Data Organization Three Months Roadmap With Statistics And Machine Learning Microsoft
Presenting our jaw dropping data organization three months roadmap with statistics and machine learning microsoft. You can alternate the color, font size, font type, and shapes of this PPT layout according to your strategic process. This PPT presentation is compatible with Google Slides and is available in both standard screen and widescreen aspect ratios. You can also download this well researched PowerPoint template design in different formats like PDF, JPG, and PNG. So utilize this visually appealing design by clicking the download button given below.

Live Streaming Marketing Overview And Statistics Ppt Ideas Portrait PDF
This slide provides an overview of live-streaming marketing and its key benefits to the company. Major benefits covered are encourage engagement, increase conversion rate, generate more leads, etc. Welcome to our selection of the Live Streaming Marketing Overview And Statistics Ppt Ideas Portrait PDF. These are designed to help you showcase your creativity and bring your sphere to life. Planning and Innovation are essential for any business that is just starting out. This collection contains the designs that you need for your everyday presentations. All of our PowerPoints are 100 percent editable, so you can customize them to suit your needs. This multi purpose template can be used in various situations. Grab these presentation templates today.

Data Administration Icon Data Collection Business Ppt PowerPoint Presentation Complete Deck
This data administration icon data collection business ppt powerpoint presentation complete deck acts as backup support for your ideas, vision, thoughts, etc. Use it to present a thorough understanding of the topic. This PPT slideshow can be utilized for both in-house and outside presentations depending upon your needs and business demands. Entailing twelve slides with a consistent design and theme, this template will make a solid use case. As it is intuitively designed, it suits every business vertical and industry. All you have to do is make a few tweaks in the content or any other component to design unique presentations. The biggest advantage of this complete deck is that it can be personalized multiple times once downloaded. The color, design, shapes, and other elements are free to modify to add personal touches. You can also insert your logo design in this PPT layout. Therefore a well-thought and crafted presentation can be delivered with ease and precision by downloading this data administration icon data collection business ppt powerpoint presentation complete deck PPT slideshow.

Data Analysis Programs 3d Bar Chart For Market Surveys PowerPoint Templates
Draw On The Experience Of Our data analysis programs 3d bar chart for market surveys Powerpoint Templates . They Imbibe From Past Masters.
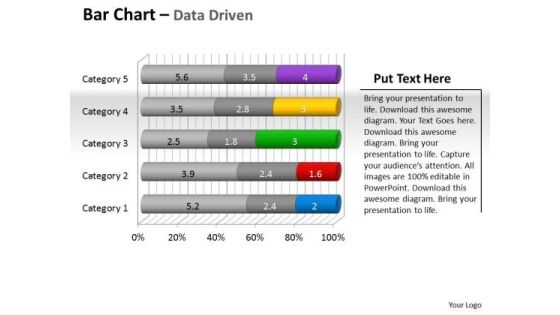
Data Analysis Programs 3d Bar Chart To Put Information PowerPoint Templates
Draw Up Your Agenda On Our data analysis programs 3d bar chart to put information Powerpoint Templates . Coax Your Audience Into Acceptance.

Data Science Big Data Analytics Ppt PowerPoint Presentation Gallery Shapes
This is a data science big data analytics ppt powerpoint presentation gallery shapes. This is a six stage process. The stages in this process are data science big data analytics.
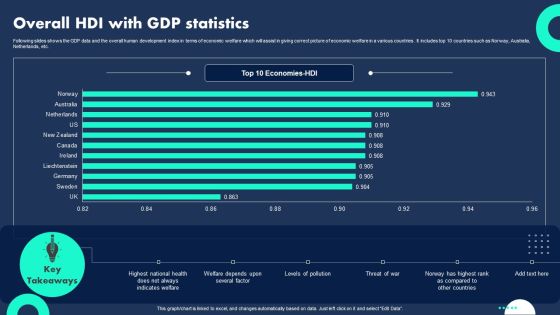
Overall HDI With Gdp Statistics Professional PDF
Following slides shows the GDP data and the overall human development index in terms of economic welfare which will assist in giving correct picture of economic welfare in a various countries . It includes top 10 countries such as Norway, Australia, Netherlands, etc. Showcasing this set of slides titled Overall HDI With Gdp Statistics Professional PDF. The topics addressed in these templates are Indicates Welfare, Welfare Depends, Levels Pollution. All the content presented in this PPT design is completely editable. Download it and make adjustments in color, background, font etc. as per your unique business setting.

Statistical Analysis Template 1 Ppt PowerPoint Presentation Outline Show
This is a statistical analysis template 1 ppt powerpoint presentation outline show. This is a four stage process. The stages in this process are treatment, error, total.
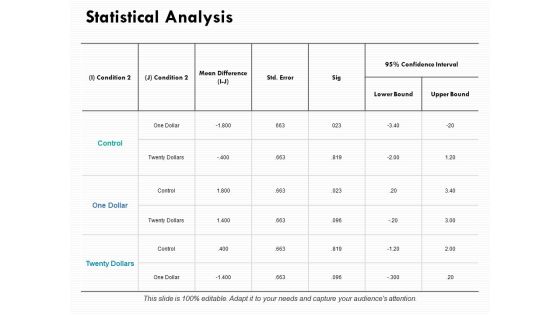
Statistical Analysis Slide Ppt PowerPoint Presentation Outline Themes
This is a statistical analysis slide ppt powerpoint presentation outline themes. This is a five stage process. The stages in this process are business, management, marketing.

Introduction Key Statistics Ppt PowerPoint Presentation Outline Smartart
This is a introduction key statistics ppt powerpoint presentation outline smartart. This is a four stage process. The stages in this process are planning, management, strategy, analysis, marketing.

Business Cards Info Ppt PowerPoint Presentation Show Slide Portrait Cpb
This is a business cards info ppt powerpoint presentation show slide portrait cpb. This is a six stage process. The stages in this process are business cards info.

Business Connection Network Company Outline Key Statistics Designs PDF
The slide highlights the key statistics of LinkedIn corporation to give abstract of company business. It shows global members by region, LinkedIn activity statistics, global community and financial statistics. Make sure to capture your audiences attention in your business displays with our gratis customizable Business Connection Network Company Outline Key Statistics Designs PDF. These are great for business strategies, office conferences, capital raising or task suggestions. If you desire to acquire more customers for your tech business and ensure they stay satisfied, create your own sales presentation with these plain slides.
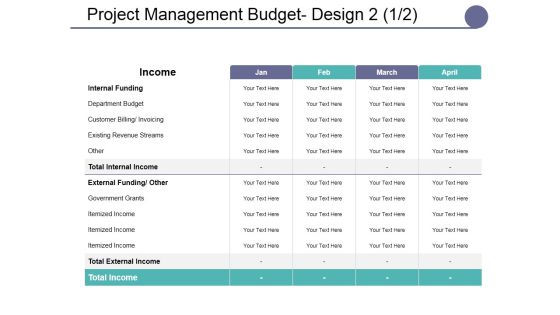
Project Management Budget Design Ppt PowerPoint Presentation Layouts Shapes
This is a project management budget design ppt powerpoint presentation layouts shapes. This is a four stage process. The stages in this process are lists, table, data, management, marketing.
Direct Marketing Statistics Ppt PowerPoint Presentation Outline Example Topics Cpb
Presenting this set of slides with name direct marketing statistics ppt powerpoint presentation outline example topics cpb. The topics discussed in these slides are direct marketing statistics. This is a completely editable PowerPoint presentation and is available for immediate download. Download now and impress your audience.

Statistics Analysis Of Product Performance Ppt PowerPoint Presentation Outline Demonstration
Presenting this set of slides with name statistics analysis of product performance ppt powerpoint presentation outline demonstration. The topics discussed in these slide is statistics analysis of product performance. This is a completely editable PowerPoint presentation and is available for immediate download. Download now and impress your audience.

Global Business Sustainability Reporting Statistics Themes PDF
This slide highlights statistical data of global business for sustainability reporting to provide transparency on the companys contribution to sustainable development. It includes key components such as global business, top companies, globally followed corporate practices, etc. If you are looking for a format to display your unique thoughts, then the professionally designed Global Business Sustainability Reporting Statistics Themes PDF is the one for you. You can use it as a Google Slides template or a PowerPoint template. Incorporate impressive visuals, symbols, images, and other charts. Modify or reorganize the text boxes as you desire. Experiment with shade schemes and font pairings. Alter, share or cooperate with other people on your work. Download Global Business Sustainability Reporting Statistics Themes PDF and find out how to give a successful presentation. Present a perfect display to your team and make your presentation unforgettable.
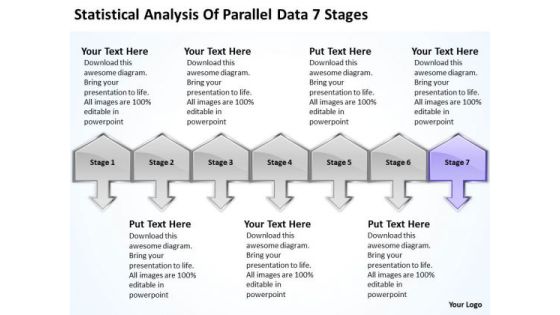
Statistical Analysis Of Parallel Data 7 Stages Ppt Help With Business Plan PowerPoint Slides
We present our statistical analysis of parallel data 7 stages ppt help with business plan PowerPoint Slides.Download and present our Communication PowerPoint Templates because You have gained great respect for your brilliant ideas. Use our PowerPoint Templates and Slides to strengthen and enhance your reputation. Present our Business PowerPoint Templates because you have developed a vision of where you want to be a few years from now. Use our Arrows PowerPoint Templates because this business powerpoint template helps expound on the logic of your detailed thought process to take your company forward. Download our Success PowerPoint Templates because iT outlines the entire thought process for the benefit of others. Tell it to the world with your characteristic aplomb. Use our Symbol PowerPoint Templates because this template helps you to bring your audiences to the table.Use these PowerPoint slides for presentations relating to 3d, Achievement, Action, Aim, Arrows, Black, Business, Color, Communication, Competition, Concept, Connection, Creative, Design, Different, Direction, Element, First, Forward, Graph, Graphic, Group, Growth, Higher, Icon, Illustration, Image, Isolated, Leader, Leadership, Line, Menu, Motion, Orange, Progress, Series, Seven, Sign, Slew, Solution, Success, Swerve, Symbol, Team, Teamwork, Turn, Up. The prominent colors used in the PowerPoint template are Purple, Gray, Black. Customers tell us our statistical analysis of parallel data 7 stages ppt help with business plan PowerPoint Slides will generate and maintain the level of interest you desire. They will create the impression you want to imprint on your audience. Use our Arrows PowerPoint templates and PPT Slides are Magnificent. PowerPoint presentation experts tell us our statistical analysis of parallel data 7 stages ppt help with business plan PowerPoint Slides will help them to explain complicated concepts. People tell us our Action PowerPoint templates and PPT Slides will make the presenter successul in his career/life. We assure you our statistical analysis of parallel data 7 stages ppt help with business plan PowerPoint Slides are Precious. People tell us our Aim PowerPoint templates and PPT Slides are Pleasant.

Sales Concepts 3d Image Of Info Slide Characters
Add Some Dramatization To Your Thoughts. Our Sales Concepts 3d Image Of Info Slide Characters Powerpoint Templates Make Useful Props. Draw Ahead Of Others With Our people Powerpoint Templates. Cross The Line And Win The Race.

Data Utilization Monitoring Statistics Ppt PowerPoint Presentation Complete Deck With Slides
Improve your presentation delivery using this data utilization monitoring statistics ppt powerpoint presentation complete deck with slides. Support your business vision and objectives using this well-structured PPT deck. This template offers a great starting point for delivering beautifully designed presentations on the topic of your choice. Comprising twelve this professionally designed template is all you need to host discussion and meetings with collaborators. Each slide is self-explanatory and equipped with high-quality graphics that can be adjusted to your needs. Therefore, you will face no difficulty in portraying your desired content using this PPT slideshow. This PowerPoint slideshow contains every important element that you need for a great pitch. It is not only editable but also available for immediate download and utilization. The color, font size, background, shapes everything can be modified to create your unique presentation layout. Therefore, download it now.
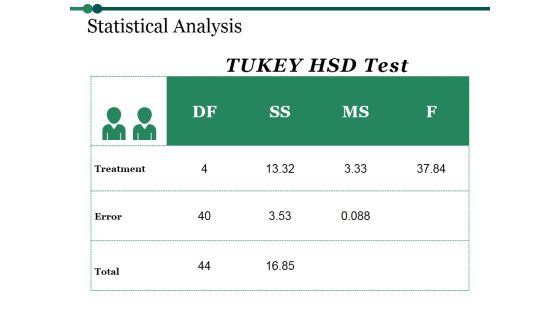
Statistical Analysis Template 1 Ppt PowerPoint Presentation Outline Professional
This is a statistical analysis template 1 ppt powerpoint presentation outline professional. This is a four stage process. The stages in this process are treatment, table, management, business, planning.
India Map Showing Gender Statistics Ppt Powerpoint Presentation Icon Outline
This is a india map showing gender statistics ppt powerpoint presentation icon outline. This is a five stage process. The stages in this process are india, south asian country.

Business Performance Mapping Vector Icon Ppt PowerPoint Presentation Outline Show
Presenting this set of slides with name business performance mapping vector icon ppt powerpoint presentation outline show. This is a three stage process. The stages in this process are data visualization icon, research analysis, business focus. This is a completely editable PowerPoint presentation and is available for immediate download. Download now and impress your audience.

Computer Screen With Cloud Icon Ppt PowerPoint Presentation Outline Designs
Presenting this set of slides with name computer screen with cloud icon ppt powerpoint presentation outline designs. This is a three stage process. The stages in this process are data visualization icon, research analysis, business focus. This is a completely editable PowerPoint presentation and is available for immediate download. Download now and impress your audience.
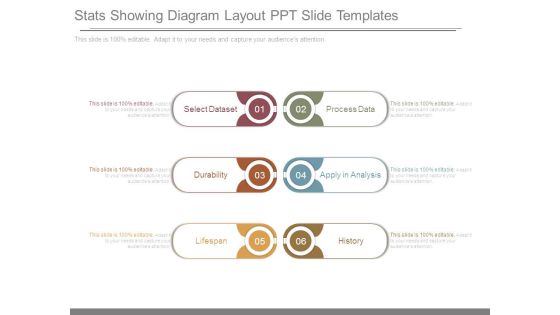
Stats Showing Diagram Layout Ppt Slide Templates
This is a stats showing diagram layout ppt slide templates. This is a six stage process. The stages in this process are select dataset, durability, lifespan, process data, apply in analysis, history.

Data Algorithm Statistics And Advanced Computing Ppt PowerPoint Presentation File Styles
This is a data algorithm statistics and advanced computing ppt powerpoint presentation file styles. This is a eight stage process. The stages in this process are data, analysis, data science, information science.
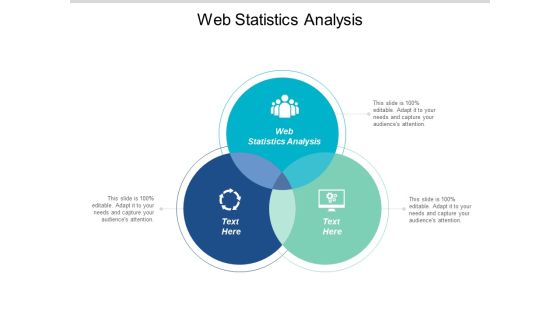
Web Statistics Analysis Ppt PowerPoint Presentation Outline Infographics Cpb
Presenting this set of slides with name web statistics analysis ppt powerpoint presentation outline infographics cpb. This is an editable Powerpoint three stages graphic that deals with topics like web statistics analysis to help convey your message better graphically. This product is a premium product available for immediate download and is 100 percent editable in Powerpoint. Download this now and use it in your presentations to impress your audience.

Correlation Analysis Statistics Ppt PowerPoint Presentation Outline Ideas Cpb
Presenting this set of slides with name correlation analysis statistics ppt powerpoint presentation outline ideas cpb. This is an editable Powerpoint four stages graphic that deals with topics like correlation analysis statistics to help convey your message better graphically. This product is a premium product available for immediate download and is 100 percent editable in Powerpoint. Download this now and use it in your presentations to impress your audience.

Statistics Decision Making Ppt PowerPoint Presentation Outline Pictures Cpb
Presenting this set of slides with name statistics decision making ppt powerpoint presentation outline pictures cpb. This is an editable Powerpoint five stages graphic that deals with topics like statistics decision making to help convey your message better graphically. This product is a premium product available for immediate download and is 100 percent editable in Powerpoint. Download this now and use it in your presentations to impress your audience.

Debt Statistics Ppt PowerPoint Presentation Outline Background Image Cpb
Presenting this set of slides with name debt statistics ppt powerpoint presentation outline background image cpb. This is an editable Powerpoint seven stages graphic that deals with topics like debt statistics to help convey your message better graphically. This product is a premium product available for immediate download and is 100 percent editable in Powerpoint. Download this now and use it in your presentations to impress your audience.

Distance Education Statistics Ppt PowerPoint Presentation Outline Layout Cpb
Presenting this set of slides with name distance education statistics ppt powerpoint presentation outline layout cpb. This is an editable Powerpoint two stages graphic that deals with topics like distance education statistics to help convey your message better graphically. This product is a premium product available for immediate download and is 100 percent editable in Powerpoint. Download this now and use it in your presentations to impress your audience.
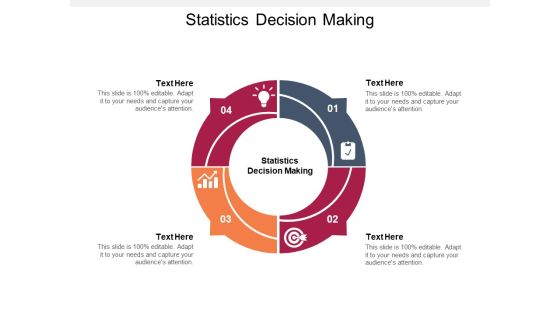
Statistics Decision Making Ppt PowerPoint Presentation Outline Vector Cpb Pdf
Presenting this set of slides with name statistics decision making ppt powerpoint presentation outline vector cpb pdf. This is an editable Powerpoint four stages graphic that deals with topics like statistics decision making to help convey your message better graphically. This product is a premium product available for immediate download and is 100 percent editable in Powerpoint. Download this now and use it in your presentations to impress your audience.

Data Collection Ppt PowerPoint Presentation Slides Shapes
This is a data collection ppt powerpoint presentation slides shapes. This is a seven stage process. The stages in this process are website data, purchase data, smart tv data, mobile data, social data.
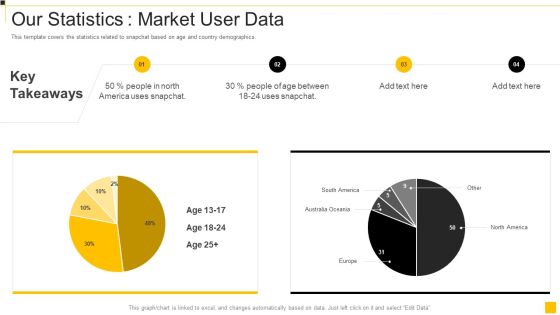
Snapchat Capital Investment Elevator Pitch Deck Our Statistics Market User Data Summary Pdf
This template covers the statistics related to snapchat based on age and country demographics. Deliver an awe inspiring pitch with this creative snapchat capital investment elevator pitch deck our statistics market user data summary pdf bundle. Topics like statistics, demographics, market can be discussed with this completely editable template. It is available for immediate download depending on the needs and requirements of the user.

Data Analytics Process Ppt PowerPoint Presentation Inspiration
This is a data analytics process ppt powerpoint presentation inspiration. This is a four stage process. The stages in this process are decision, insight, data, info.
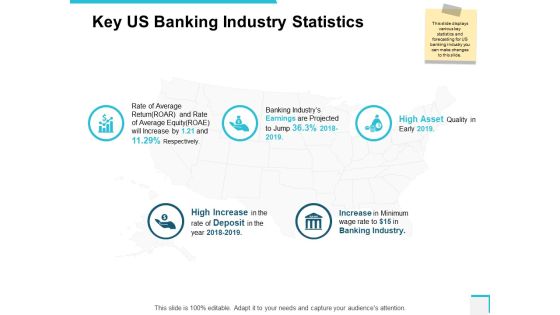
Key Us Banking Industry Statistics Ppt PowerPoint Presentation Outline Grid
Presenting this set of slides with name key us banking industry statistics ppt powerpoint presentation outline grid. This is a five stage process. The stages in this process are process, business, management, planning, strategy. This is a completely editable PowerPoint presentation and is available for immediate download. Download now and impress your audience.

Online Statistic And Data Processing Ppt PowerPoint Presentation Slides Templates PDF
Presenting this set of slides with name online statistic and data processing ppt powerpoint presentation slides templates pdf. This is a three stage process. The stages in this process are online statistic and data processing. This is a completely editable PowerPoint presentation and is available for immediate download. Download now and impress your audience.

Business Statistics Data Chart Vector Icon Ppt PowerPoint Presentation File Graphics Design PDF
Presenting this set of slides with name business statistics data chart vector icon ppt powerpoint presentation file graphics design pdf. The topics discussed in these slide is business statistics data chart vector icon. This is a completely editable PowerPoint presentation and is available for immediate download. Download now and impress your audience.
Manager Doing Customer Data Statistical Analysis Icon Ppt PowerPoint Presentation Gallery Format Ideas PDF
Presenting this set of slides with name manager doing customer data statistical analysis icon ppt powerpoint presentation gallery format ideas pdf. This is a three stage process. The stages in this process are manager doing customer data statistical analysis icon. This is a completely editable PowerPoint presentation and is available for immediate download. Download now and impress your audience.

Big Data Statistical Analysis Shown On Laptop Screen Ppt PowerPoint Presentation Inspiration Topics PDF
Presenting this set of slides with name big data statistical analysis shown on laptop screen ppt powerpoint presentation inspiration topics pdf. This is a three stage process. The stages in this process are big data statistical analysis shown on laptop screen. This is a completely editable PowerPoint presentation and is available for immediate download. Download now and impress your audience.
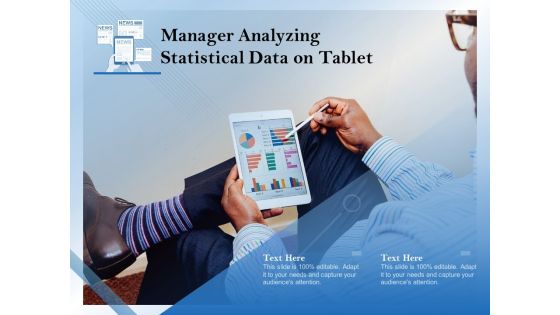
Manager Analyzing Statistical Data On Tablet Ppt PowerPoint Presentation Pictures Slides PDF
Presenting manager analyzing statistical data on tablet ppt powerpoint presentation pictures slides pdf to dispense important information. This template comprises one stages. It also presents valuable insights into the topics including manager analyzing statistical data on tablet. This is a completely customizable PowerPoint theme that can be put to use immediately. So, download it and address the topic impactfully.

Dashboard Showing Data Charts For Statistics Analysis Ppt PowerPoint Presentation Infographic Template Grid PDF
Pitch your topic with ease and precision using this dashboard showing data charts for statistics analysis ppt powerpoint presentation infographic template grid pdf. This layout presents information on dashboard showing data charts for statistics analysis. It is also available for immediate download and adjustment. So, changes can be made in the color, design, graphics or any other component to create a unique layout.
Statistical Data Analysis Chart Vector Icon Ppt PowerPoint Presentation Styles Guide PDF
Showcasing this set of slides titled statistical data analysis chart vector icon ppt powerpoint presentation styles guide pdf. The topics addressed in these templates are statistical data analysis chart vector icon. All the content presented in this PPT design is completely editable. Download it and make adjustments in color, background, font etc. as per your unique business setting.

Data Usage Statistics On Mobile Application Vector Icon Ppt PowerPoint Presentation Designs PDF
Presenting data usage statistics on mobile application vector icon ppt powerpoint presentation designs pdf to dispense important information. This template comprises three stages. It also presents valuable insights into the topics including data usage statistics on mobile application vector icon. This is a completely customizable PowerPoint theme that can be put to use immediately. So, download it and address the topic impactfully.
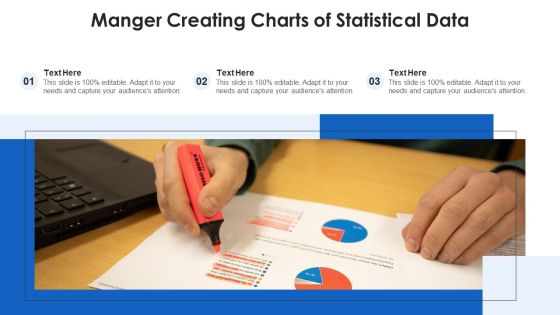
Manger Creating Charts Of Statistical Data Ppt PowerPoint Presentation File Visuals PDF
Presenting manger creating charts of statistical data ppt powerpoint presentation file visuals pdf to dispense important information. This template comprises three stages. It also presents valuable insights into the topics including manger creating charts of statistical data. This is a completely customizable PowerPoint theme that can be put to use immediately. So, download it and address the topic impactfully.

Data Consumption Statistics On Mobile Phone Ppt PowerPoint Presentation Gallery Images PDF
Presenting data consumption statistics on mobile phone ppt powerpoint presentation gallery images pdf to dispense important information. This template comprises three stages. It also presents valuable insights into the topics including data consumption statistics on mobile phone. This is a completely customizable PowerPoint theme that can be put to use immediately. So, download it and address the topic impactfully.

Company Data Transformation Strategy Icon With Statistics Ppt Show Visual Aids PDF
Presenting Company Data Transformation Strategy Icon With Statistics Ppt Show Visual Aids PDF to dispense important information. This template comprises three stages. It also presents valuable insights into the topics including Company Data Transformation, Strategy Icon, Statistics. This is a completely customizable PowerPoint theme that can be put to use immediately. So, download it and address the topic impactfully.
Icon Of Demographic Statistics With Census Data And Candidate Search Background PDF
Presenting Icon Of Demographic Statistics With Census Data And Candidate Search Background PDF to dispense important information. This template comprises three stages. It also presents valuable insights into the topics including Icon Demographic, Statistics Census Data, Candidate Search. This is a completely customizable PowerPoint theme that can be put to use immediately. So, download it and address the topic impactfully.

Magnify Glass Ppt PowerPoint Presentation Styles
This is a magnify glass ppt powerpoint presentation styles. This is a five stage process. The stages in this process are big data, analysis, success, business, strategy.
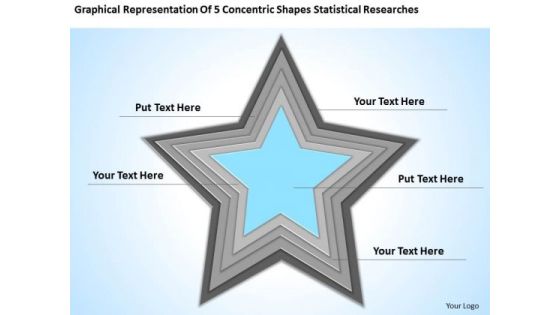
Shapes Statistical Researches Ppt Business Plan Examples For New PowerPoint Slides
We present our shapes statistical researches ppt business plan examples for new PowerPoint Slides.Present our Competition PowerPoint Templates because Our PowerPoint Templates and Slides will help you be quick off the draw. Just enter your specific text and see your points hit home. Present our Leadership PowerPoint Templates because Our PowerPoint Templates and Slides will let you Hit the target. Go the full distance with ease and elan. Download and present our Stars PowerPoint Templates because You have gained great respect for your brilliant ideas. Use our PowerPoint Templates and Slides to strengthen and enhance your reputation. Download our Shapes PowerPoint Templates because Our PowerPoint Templates and Slides will steer your racing mind. Hit the right buttons and spur on your audience. Download our Business PowerPoint Templates because Our PowerPoint Templates and Slides will generate and maintain the level of interest you desire. They will create the impression you want to imprint on your audience.Use these PowerPoint slides for presentations relating to Star, design, leader, forward, star logo, progress bar, target, achievement, star icon, star background, business, concept, sign, success, symbol, diagram, orange, graphic, process, goal, marketing, development, shape, price, team, graph, illustration, icon, chart, direction, growth, moving, motion, company, competition, progress, profit, path, aim, financial. The prominent colors used in the PowerPoint template are Black, Blue, Gray.
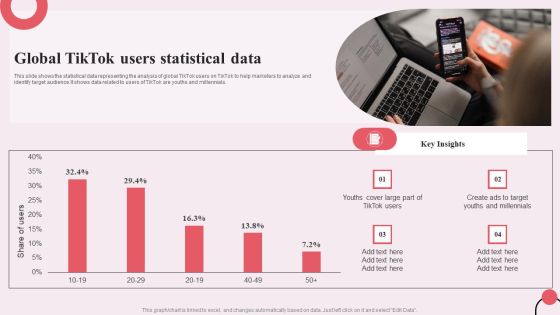
Tiktok Digital Marketing Campaign Global Tiktok Users Statistical Data Information PDF
This slide shows the statistical data representing the analysis of global TikTok users on TikTok to help marketers to analyze and identify target audience.It shows data related to users of TikTok are youths and millennials. Presenting this PowerPoint presentation, titled Tiktok Digital Marketing Campaign Global Tiktok Users Statistical Data Information PDF, with topics curated by our researchers after extensive research. This editable presentation is available for immediate download and provides attractive features when used. Download now and captivate your audience. Presenting this Tiktok Digital Marketing Campaign Global Tiktok Users Statistical Data Information PDF. Our researchers have carefully researched and created these slides with all aspects taken into consideration. This is a completely customizable Tiktok Digital Marketing Campaign Global Tiktok Users Statistical Data Information PDF that is available for immediate downloading. Download now and make an impact on your audience. Highlight the attractive features available with our PPTs.

Circular Technology Marketing Ppt Powerpoint Presentation Slides Shapes
This is a circular technology marketing ppt powerpoint presentation slides shapes. This is a four stage process. The stages in this process are marketing, business, management, planning, strategy.
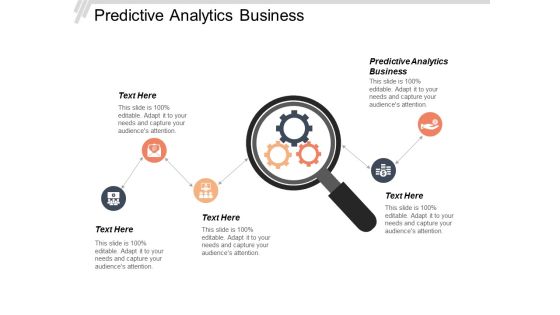
Predictive Analytics Business Ppt Powerpoint Presentation Gallery Shapes Cpb
This is a predictive analytics business ppt powerpoint presentation gallery shapes cpb. This is a five stage process. The stages in this process are predictive analytics business.

5 Concentric Shapes Statistical Researches Ppt Creating Small Business Plan PowerPoint Slides
We present our 5 concentric shapes statistical researches ppt creating small business plan PowerPoint Slides.Present our Stars PowerPoint Templates because you can Break through with our PowerPoint Templates and Slides. Bring down the mental barriers of your audience. Download our Shapes PowerPoint Templates because Our PowerPoint Templates and Slides will help you be quick off the draw. Just enter your specific text and see your points hit home. Download and present our Layers PowerPoint Templates because Our PowerPoint Templates and Slides are focused like a searchlight beam. They highlight your ideas for your target audience. Download our Business PowerPoint Templates because you should Experience excellence with our PowerPoint Templates and Slides. They will take your breath away. Present our Signs PowerPoint Templates because Our PowerPoint Templates and Slides offer you the needful to organise your thoughts. Use them to list out your views in a logical sequence.Use these PowerPoint slides for presentations relating to star, silver, color, colorful, design, decoration, layout, ornament, blank, new, seasonal, vector, holiday, celebrate, template, night, layered, festive, celebration, xmas, light, christmas, blurred, abstract, illustration, tradition, x-mas, winter, blurry, blue, text, december, moving, blur, celebrating, background, spot, events, eve, coming, blinded, editable, metal, year. The prominent colors used in the PowerPoint template are Blue, Gray, Black.
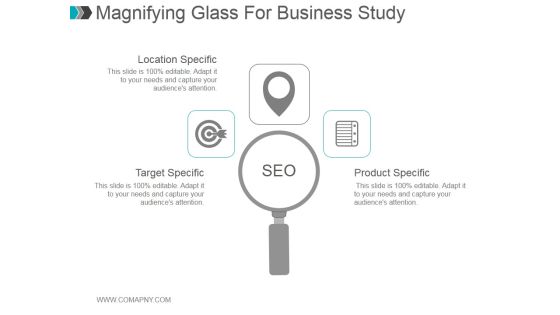
Magnifying Glass For Business Study Ppt PowerPoint Presentation Shapes
This is a magnifying glass for business study ppt powerpoint presentation shapes. This is a one stage process. The stages in this process are location specific, target specific, product specific.
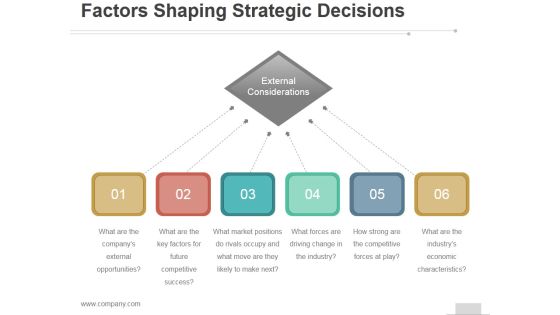
Factors Shaping Strategic Decisions Ppt PowerPoint Presentation Background Images
This is a factors shaping strategic decisions ppt powerpoint presentation background images. This is a six stage process. The stages in this process are external, considerations, business, marketing, strategy.

Challenges In The Channel Ppt PowerPoint Presentation Professional Shapes
This is a challenges in the channel ppt powerpoint presentation professional shapes. This is a five stage process. The stages in this process are manufacturer, direct, channels, distributor, end customers.

Assets And Liabilities Statement Ppt PowerPoint Presentation Infographics Shapes
This is a assets and liabilities statement ppt powerpoint presentation infographics shapes. This is a three stage process. The stages in this process are balance sheet, current assets, total current assets, long term assets, total long term assets.
Magnifying Glass Technology Ppt PowerPoint Presentation Model Shapes
This is a magnifying glass technology ppt powerpoint presentation model shapes. This is a four stage process. The stages in this process are magnifying glass, research, marketing, strategy, business.
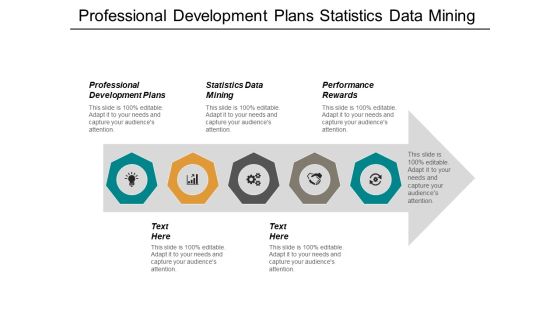
Professional Development Plans Statistics Data Mining Performance Rewards Ppt PowerPoint Presentation Styles Backgrounds
This is a professional development plans statistics data mining performance rewards ppt powerpoint presentation styles backgrounds. This is a five stage process. The stages in this process are professional development, debt management, online marketing, employee assessment.
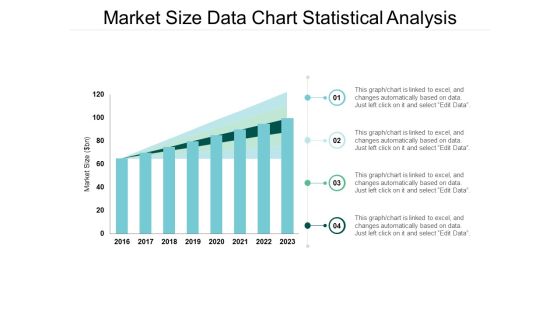
Market Size Data Chart Statistical Analysis Ppt Powerpoint Presentation Model Format
This is a market size data chart statistical analysis ppt powerpoint presentation model format. The topics discussed in this diagram are market growth, market opportunity, market profitability. This is a completely editable PowerPoint presentation, and is available for immediate download.
Statistical Analysis Data Mining Skills Ppt PowerPoint Presentation Slides Grid Cpb
Presenting this set of slides with name statistical analysis data mining skills ppt powerpoint presentation slides grid cpb. This is an editable Powerpoint four stages graphic that deals with topics like statistical analysis data mining skills to help convey your message better graphically. This product is a premium product available for immediate download and is 100 percent editable in Powerpoint. Download this now and use it in your presentations to impress your audience.
Statistical Analysis Big Data Ppt PowerPoint Presentation Summary Master Slide Cpb
Presenting this set of slides with name statistical analysis big data ppt powerpoint presentation summary master slide cpb. This is an editable Powerpoint seven stages graphic that deals with topics like statistical analysis big data to help convey your message better graphically. This product is a premium product available for immediate download and is 100 percent editable in Powerpoint. Download this now and use it in your presentations to impress your audience.

Manager Analyzing Statistical Data On Tablet Ppt PowerPoint Presentation Inspiration Graphics Download PDF
Persuade your audience using this manager analyzing statistical data on tablet ppt powerpoint presentation inspiration graphics download pdf. This PPT design covers three stages, thus making it a great tool to use. It also caters to a variety of topics including manager analyzing statistical data on tablet. Download this PPT design now to present a convincing pitch that not only emphasizes the topic but also showcases your presentation skills.

Business Data Statistical Dashboard Vector Icon Ppt PowerPoint Presentation Icon Graphics Template PDF
Persuade your audience using this business data statistical dashboard vector icon ppt powerpoint presentation icon graphics template pdf. This PPT design covers three stages, thus making it a great tool to use. It also caters to a variety of topics including business data statistical dashboard vector icon. Download this PPT design now to present a convincing pitch that not only emphasizes the topic but also showcases your presentation skills.
Manger Presenting Business Data Statistics Report Ppt PowerPoint Presentation File Images PDF
Persuade your audience using this manger presenting business data statistics report ppt powerpoint presentation file images pdf. This PPT design covers three stages, thus making it a great tool to use. It also caters to a variety of topics including manger presenting business data statistics report. Download this PPT design now to present a convincing pitch that not only emphasizes the topic but also showcases your presentation skills.
Statistical Data Icon Of Poll Graph Depicting Elections Result Introduction PDF
Persuade your audience using this statistical data icon of poll graph depicting elections result introduction pdf. This PPT design covers four stages, thus making it a great tool to use. It also caters to a variety of topics including statistical data icon of poll graph depicting elections result. Download this PPT design now to present a convincing pitch that not only emphasizes the topic but also showcases your presentation skills.
Icon Showing Transformation Shift Of Digital Data With Statistics Ppt PowerPoint Presentation Diagram PDF
Persuade your audience using this Icon Showing Transformation Shift Of Digital Data With Statistics Ppt PowerPoint Presentation Diagram PDF. This PPT design covers three stages, thus making it a great tool to use. It also caters to a variety of topics including Icon Showing Transformation Shift, Digital Data With Statistics. Download this PPT design now to present a convincing pitch that not only emphasizes the topic but also showcases your presentation skills.
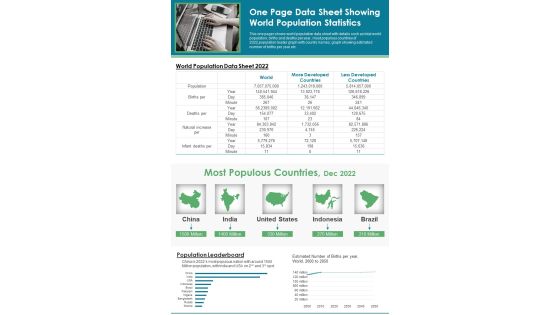
One Page Data Sheet Showing World Population Statistics PDF Document PPT Template
Looking for a predesigned One Page Data Sheet Showing World Population Statistics PDF Document PPT Template Heres the perfect piece for you It has everything that a well-structured one-pager template should have. Besides, it is 100 percent editable, which offers you the cushion to make adjustments according to your preferences. Grab this One Page Data Sheet Showing World Population Statistics PDF Document PPT Template Download now.

Customer Relationship Management Dashboard With Industry Operations Data Statistics Pictures PDF
This slide illustrates graphical representation of statistical data of sales operation. It includes sales pipeline, closed operations, open operations, operations by closing date etc. Pitch your topic with ease and precision using this Customer Relationship Management Dashboard With Industry Operations Data Statistics Pictures PDF. This layout presents information on Sales Pipeline, Insurance, Telecommunic. It is also available for immediate download and adjustment. So, changes can be made in the color, design, graphics or any other component to create a unique layout.

Project Manager Sketch Dynamic Checklist Ppt PowerPoint Presentation Styles Ideas PDF
Presenting project manager sketch dynamic checklist ppt powerpoint presentation styles ideas pdf to dispense important information. This template comprises three stages. It also presents valuable insights into the topics including project manager sketch dynamic checklist. This is a completely customizable PowerPoint theme that can be put to use immediately. So, download it and address the topic impactfully.

Sketch Of Decorative Glass Art Image Ppt PowerPoint Presentation Summary Graphic Tips PDF
Showcasing this set of slides titled sketch of decorative glass art image ppt powerpoint presentation summary graphic tips pdf. The topics addressed in these templates are sketch of decorative glass art image. All the content presented in this PPT design is completely editable. Download it and make adjustments in color, background, font etc. as per your unique business setting.

Picture Showing Flag Of Mexico Country Sketch Ppt PowerPoint Presentation Portfolio Influencers PDF
Pitch your topic with ease and precision using this picture showing flag of mexico country sketch ppt powerpoint presentation portfolio influencers pdf. This layout presents information on picture showing flag of mexico country sketch. It is also available for immediate download and adjustment. So, changes can be made in the color, design, graphics or any other component to create a unique layout.

Statistical Data Of Global Usage And Adoption Of Social Media Microsoft PDF
This slide shows the data representing the use and adoption of social media globally. It includes data related to no. of social media users, average daily time spent on social media, average number of social platforms used each month etc. Presenting Statistical Data Of Global Usage And Adoption Of Social Media Microsoft PDF to dispense important information. This template comprises ten stages. It also presents valuable insights into the topics including Social Media, Average, Statistical Data Of Global. This is a completely customizable PowerPoint theme that can be put to use immediately. So, download it and address the topic impactfully.

Key Statistics Of Information Technology Security And Data Breach Brochure PDF
The following slide depicts some statistical insights of IT security to prevent data breaches and financial loss. It includes facts such as annual cost incurred due to malware, threats due to ransomware, previous year records of data breach etc. Persuade your audience using this Key Statistics Of Information Technology Security And Data Breach Brochure PDF. This PPT design covers nine stages, thus making it a great tool to use. It also caters to a variety of topics including Cost Incurred, Data Breach Recorded, Projected Records. Download this PPT design now to present a convincing pitch that not only emphasizes the topic but also showcases your presentation skills.

Magnifying Glass Ppt PowerPoint Presentation Shapes
This is a magnifying glass ppt powerpoint presentation shapes. This is a five stage process. The stages in this process are business, magnify, icons, search, growth.

Magnifier Glass Ppt PowerPoint Presentation Shapes
This is a magnifier glass ppt powerpoint presentation shapes. This is a six stage process. The stages in this process are business, strategy, marketing, analysis, gears, technology.

Post It Ppt PowerPoint Presentation Portfolio Shapes
This is a post it ppt powerpoint presentation portfolio shapes. This is a four stage process. The stages in this process are business, strategy, analysis, marketing, post it.

Magnifying Glass Ppt PowerPoint Presentation Layouts Shapes
This is a magnifying glass ppt powerpoint presentation layouts shapes. This is a six stage process. The stages in this process are magnifying glass, search, marketing, strategy, business.

Business Data Analytics Process Ppt PowerPoint Presentation Layout
This is a business data analytics process ppt powerpoint presentation layout. This is a four stage process. The stages in this process are decision, data, insight, info.
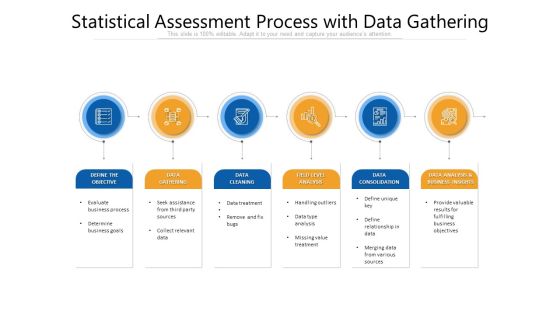
Statistical Assessment Process With Data Gathering Ppt Infographic Template Picture PDF
Persuade your audience using this statistical assessment process with data gathering ppt infographic template picture pdf. This PPT design covers six stages, thus making it a great tool to use. It also caters to a variety of topics including data gathering, data cleaning, data consolidation, objective, business insights. Download this PPT design now to present a convincing pitch that not only emphasizes the topic but also showcases your presentation skills.

Data Report Icon With Various Statistics Ppt PowerPoint Presentation Infographic Template Clipart
Presenting this set of slides with name data report icon with various statistics ppt powerpoint presentation infographic template clipart. This is a one stage process. The stages in this process are data report, infographics brochure, business statement. This is a completely editable PowerPoint presentation and is available for immediate download. Download now and impress your audience.
