AI PPT Maker
Templates
PPT Bundles
Design Services
Business PPTs
Business Plan
Management
Strategy
Introduction PPT
Roadmap
Self Introduction
Timelines
Process
Marketing
Agenda
Technology
Medical
Startup Business Plan
Cyber Security
Dashboards
SWOT
Proposals
Education
Pitch Deck
Digital Marketing
KPIs
Project Management
Product Management
Artificial Intelligence
Target Market
Communication
Supply Chain
Google Slides
Research Services
 One Pagers
All Categories
-
Home
- Customer Favorites
- Figures
Figures

Social Platforms Data Analysis Marketing Statistical Data Icon Ideas PDF
Presenting Social Platforms Data Analysis Marketing Statistical Data Icon Ideas PDF to dispense important information. This template comprises three stages. It also presents valuable insights into the topics including Social Platforms Data Analysis, Marketing Statistical Data Icon. This is a completely customizable PowerPoint theme that can be put to use immediately. So, download it and address the topic impactfully.

Data Analytics Management Big Data Management In E Commerce Business Structure PDF
This slide represents the uses of big data in the E-commerce business and how it would be beneficial in tailored services, future forecasts, demand of items, and mitigate high-risk.Presenting Data Analytics Management Big Data Management In E Commerce Business Structure PDF to provide visual cues and insights. Share and navigate important information on four stages that need your due attention. This template can be used to pitch topics like Customer Retention, Allows Figure, Particular Product. In addtion, this PPT design contains high resolution images, graphics, etc, that are easily editable and available for immediate download.

Businessman Using Statistical Data Tools To Analyze Data Designs PDF
Persuade your audience using this businessman using statistical data tools to analyze data designs pdf. This PPT design covers four stages, thus making it a great tool to use. It also caters to a variety of topics including businessman using statistical data tools to analyze data. Download this PPT design now to present a convincing pitch that not only emphasizes the topic but also showcases your presentation skills.
Graphical Representation Of Data Using Statistical Data Measures Elements PDF
Persuade your audience using this graphical representation of data using statistical data measures elements pdf. This PPT design covers four stages, thus making it a great tool to use. It also caters to a variety of topics including graphical representation of data using statistical data measures. Download this PPT design now to present a convincing pitch that not only emphasizes the topic but also showcases your presentation skills.

Big Data Funnel Diagram Powerpoint Templates
Our above business slide has been designed with graphics of big data funnel diagram. This slide is suitable to present data analysis, storage and sharing. Use this business diagram to present your work in a more smart and precise manner.

Unschool Platform Business Profile Key Statistics Portrait PDF
The slide highlights the key statistical data of Unschool company illustrating count of internship partners, industry experts, and active learners. It also showcases revenue, placement rate, course prices, course completion rate and Q O Q growth rate. Presenting Revenue, Placement Rate, Industry Experts to provide visual cues and insights. Share and navigate important information on nine stages that need your due attention. This template can be used to pitch topics like Revenue, Placement Rate, Industry Experts. In addtion, this PPT design contains high resolution images, graphics, etc, that are easily editable and available for immediate download.
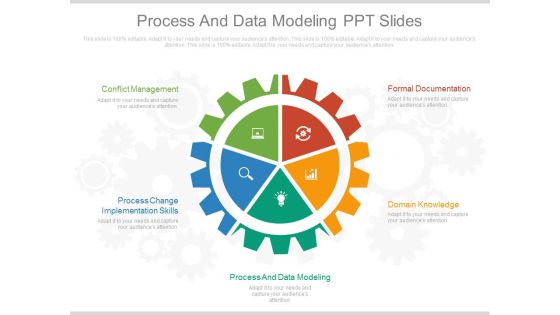
Process And Data Modeling Ppt Slides
This is a process and data modeling ppt slides. This is a five stage process. The stages in this process are marketing, business, success.

Business Statistical Assessment Vector Icon Ppt Layouts Slides PDF
Persuade your audience using this business statistical assessment vector icon ppt layouts slides pdf. This PPT design covers three stages, thus making it a great tool to use. It also caters to a variety of topics including business statistical assessment vector icon. Download this PPT design now to present a convincing pitch that not only emphasizes the topic but also showcases your presentation skills.
Statistical Analysis Procedure To Identify Problem Icon Guidelines PDF
Persuade your audience using this Statistical Analysis Procedure To Identify Problem Icon Guidelines PDF. This PPT design covers three stages, thus making it a great tool to use. It also caters to a variety of topics including Statistical Analysis Procedure, Identify Problem Icon. Download this PPT design now to present a convincing pitch that not only emphasizes the topic but also showcases your presentation skills.

Data Management Presentation Powerpoint Templates
This is a data management presentation powerpoint templates. This is a five stage process. The stages in this process are new technology, data management, decision support, data analysis, data sources.

Business Diagram Sample Advantages Benefits Of Big Data Analysis And Modelling Ppt Slide
Explain the concept of sample advantages and benefits of big data analysis with this unique diagram. This slide contains the graphic of data icons. Use this slide to present data analysis and modeling related topics in any presentation.
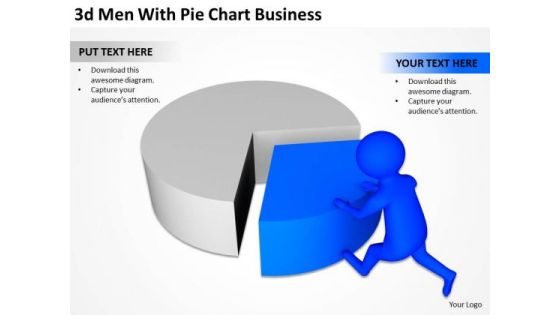
Top Business People 3d Man With Pie Chart New PowerPoint Presentation Templates
We present our top business people 3d man with pie chart new powerpoint presentation templates.Present our Circle Charts PowerPoint Templates because You can Be the star of the show with our PowerPoint Templates and Slides. Rock the stage with your ideas. Present our Business PowerPoint Templates because Our PowerPoint Templates and Slides will Activate the energies of your audience. Get their creative juices flowing with your words. Download our People PowerPoint Templates because our PowerPoint Templates and Slides will give your ideas the shape. Use our Shapes PowerPoint Templates because It will mark the footprints of your journey. Illustrate how they will lead you to your desired destination. Download our Success PowerPoint Templates because You can Channelise the thoughts of your team with our PowerPoint Templates and Slides. Urge them to focus on the goals you have set.Use these PowerPoint slides for presentations relating to 3d,active, analysis, business, cartoon, character, chart, commerce, company, data,diagram, earning, economy, figures, financial, forecast, gain, goal, graph, growth,guy, income, investment, male, man, market, money, monthly, number, person,pie, planning, positive, profit, profitable, progress, pushing, report, research,results, revenue, sale, sheet, spreadsheet, statement, statistics, stock, table. The prominent colors used in the PowerPoint template are Blue , Gray, Black. We assure you our top business people 3d man with pie chart new powerpoint presentation templates provide you with a vast range of viable options. Select the appropriate ones and just fill in your text. You can be sure our character PowerPoint templates and PPT Slides will make the presenter successul in his career/life. Use our top business people 3d man with pie chart new powerpoint presentation templates will make the presenter successul in his career/life. We assure you our chart PowerPoint templates and PPT Slides will get their audience's attention. Use our top business people 3d man with pie chart new powerpoint presentation templates will make you look like a winner. Professionals tell us our chart PowerPoint templates and PPT Slides will generate and maintain the level of interest you desire. They will create the impression you want to imprint on your audience.
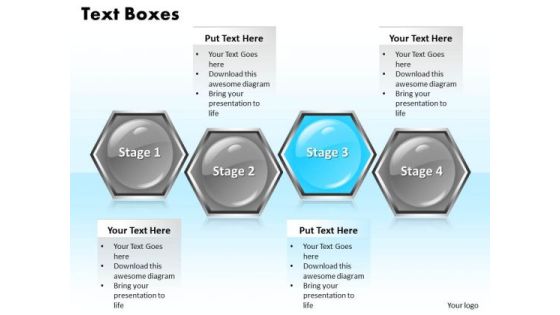
Ppt Regular Hexagon Shaped Text Boxes PowerPoint Background 4 Stages Templates
PPT regular hexagon shaped text boxes powerpoint background 4 stages Templates-Deliver amazing Presentations with our above diagram of a Hexagonal Text Link Boxes. This image has been professionally designed to emphasize the concept of a series of interconnected ideas. This image has been conceived to enable you to emphatically communicate your ideas inyour Marketing PPT presentation. Deliver amazing presentations to mesmerize your audience.-PPT regular hexagon shaped text boxes powerpoint background 4 stages Templates-3d, Appointment, Box, Calendar, Cell, Cellular, Color, Diary, Due, Engagement, Event, Everyday, Figure, Grid, Hexagon, Letters, Memo, Message, Note, Order, Organizer, Schedule, Seasonal, Second, Structure, Symbol, System, Text
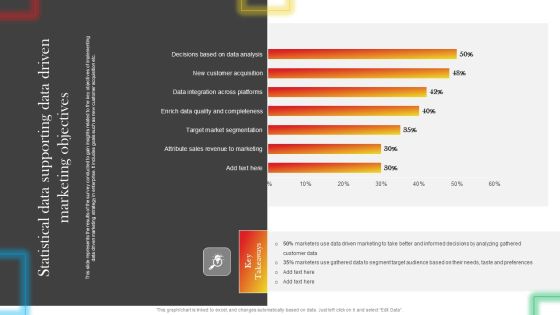
Statistical Data Supporting Data Driven Marketing Objectives Summary PDF
This slide represents the results of the survey conducted to gain insights related to the key objectives of implementing data driven marketing strategy in enterprise. It includes goals such as new customer acquisition etc. Are you in need of a template that can accommodate all of your creative concepts This one is crafted professionally and can be altered to fit any style. Use it with Google Slides or PowerPoint. Include striking photographs, symbols, depictions, and other visuals. Fill, move around, or remove text boxes as desired. Test out color palettes and font mixtures. Edit and save your work, or work with colleagues. Download Statistical Data Supporting Data Driven Marketing Objectives Summary PDF and observe how to make your presentation outstanding. Give an impeccable presentation to your group and make your presentation unforgettable.
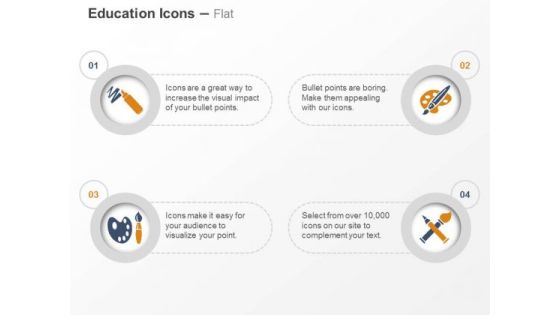
Color Paint Board Brush Sketch Ppt Slides Graphics
This power point template has been designed with icons of color, paint board and brush with sketch. This icon template is suitable for drawing and artwork related topics. Use this icons diagram slide to make impressive presentations.

Successful Business People 3d Men Moving Up Bar Graph PowerPoint Templates
We present our successful business people 3d men moving up bar graph PowerPoint templates.Use our Process and Flows PowerPoint Templates because you should once Tap the ingenuity of our PowerPoint Templates and Slides. They are programmed to succeed. Use our People PowerPoint Templates because Our PowerPoint Templates and Slides are designed to help you succeed. They have all the ingredients you need. Download our Business PowerPoint Templates because Our PowerPoint Templates and Slides will let your ideas bloom. Create a bed of roses for your audience. Use our Finance PowerPoint Templates because You should Press the right buttons with our PowerPoint Templates and Slides. They will take your ideas down the perfect channel. Download our Shapes PowerPoint Templates because Our PowerPoint Templates and Slides will let you Hit the right notes. Watch your audience start singing to your tune.Use these PowerPoint slides for presentations relating to 3d, achievement, ascending, bar, business, career, chart, competition, concept, diagram, figures, finances, financial, grade, graphic, growth, height, human, hurry, improvement, level, men, money, moving, people, person, progress, promotion, red, rising, run, shape, speed, stage, stairs, step, success, up, white, winner. The prominent colors used in the PowerPoint template are Red, Gray, Green. Professionals tell us our successful business people 3d men moving up bar graph PowerPoint templates look good visually. People tell us our concept PowerPoint templates and PPT Slides will help you be quick off the draw. Just enter your specific text and see your points hit home. We assure you our successful business people 3d men moving up bar graph PowerPoint templates help you meet deadlines which are an element of today's workplace. Just browse and pick the slides that appeal to your intuitive senses. Presenters tell us our business PowerPoint templates and PPT Slides will generate and maintain the level of interest you desire. They will create the impression you want to imprint on your audience. We assure you our successful business people 3d men moving up bar graph PowerPoint templates provide you with a vast range of viable options. Select the appropriate ones and just fill in your text. PowerPoint presentation experts tell us our business PowerPoint templates and PPT Slides will generate and maintain the level of interest you desire. They will create the impression you want to imprint on your audience.
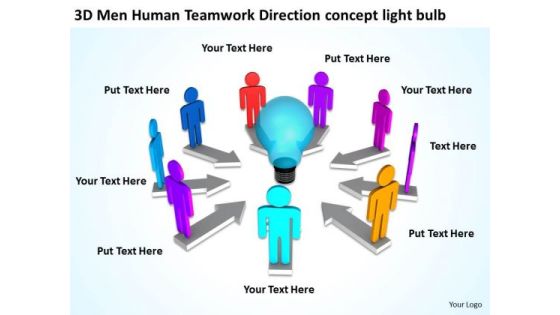
Business Process Flow Chart Examples Light Bulb PowerPoint Templates Ppt Backgrounds For Slides
We present our business process flow chart examples light bulb PowerPoint templates PPT backgrounds for slides.Download and present our Arrows PowerPoint Templates because Our PowerPoint Templates and Slides ensures Effective communication. They help you put across your views with precision and clarity. Present our Light Bulbs PowerPoint Templates because Our PowerPoint Templates and Slides will let you Hit the target. Go the full distance with ease and elan. Present our Shapes PowerPoint Templates because Our PowerPoint Templates and Slides are created with admirable insight. Use them and give your group a sense of your logical mind. Use our People PowerPoint Templates because Our PowerPoint Templates and Slides are created by a hardworking bunch of busybees. Always flitting around with solutions gauranteed to please. Present our Business PowerPoint Templates because Our PowerPoint Templates and Slides help you meet the demand of the Market. Just browse and pick the slides that appeal to your intuitive senses.Use these PowerPoint slides for presentations relating to 3d, activity, arrow, arrowhead, business, businessman, career, circle, color, colorful, communication, community, compete, competitive, concept, connection, development, different, direction, discussion, economics, employment, figures, finance, goal, group, humans, ideas, isolated, link, many, match, men, network, occupation, opposition, partnership, people, resources, share, social, strategy, support, teamwork, togetherness, trend, unity. The prominent colors used in the PowerPoint template are Blue, Gray, Red. PowerPoint presentation experts tell us our business process flow chart examples light bulb PowerPoint templates PPT backgrounds for slides are effectively colour coded to prioritise your plans They automatically highlight the sequence of events you desire. Use our color PowerPoint templates and PPT Slides are designed by professionals You can be sure our business process flow chart examples light bulb PowerPoint templates PPT backgrounds for slides will get their audience's attention. Presenters tell us our color PowerPoint templates and PPT Slides are effectively colour coded to prioritise your plans They automatically highlight the sequence of events you desire. You can be sure our business process flow chart examples light bulb PowerPoint templates PPT backgrounds for slides are topically designed to provide an attractive backdrop to any subject. Professionals tell us our business PowerPoint templates and PPT Slides provide you with a vast range of viable options. Select the appropriate ones and just fill in your text.
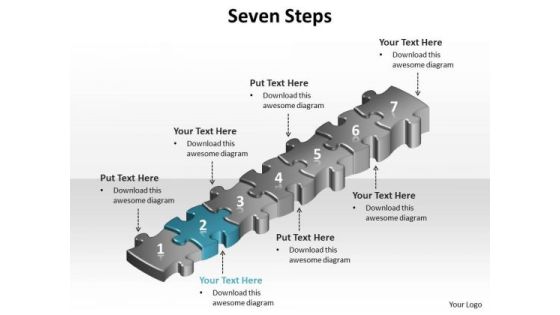
Ppt Blue PowerPoint Template Success Step Templates
PPT blue PowerPoint template success step Templates-Create visually stunning and define your PPT Presentations in a unique and inspiring manner using our above Diagram which contains a graphic of seven stages arranged using puzzle pieces. Use this diagram as a method of graphically representing the flow of data through an information processing system.-PPT blue PowerPoint template success step Templates-achievement, activity, adversity, bridge, built, business, cartoon, challenge, character, computer, concept, construction, creativity, decisions, figure, games, goal, graphic, icon, idea, intelligence, organization, people, planning, problems, puzzle, solution, stick, strategy, success

Data Collection Powerpoint Slides Templates Download
This is a data collection powerpoint slides templates download. This is a four stage process. The stages in this process are review and update, implement plan, identify problems, data collection.

Crowdfunding Statistics Template 1 Ppt PowerPoint Presentation Outline Shapes
This is a crowdfunding statistics template 1 ppt powerpoint presentation outline shapes. This is a seven stage process. The stages in this process are business, strategy, analysis, marketing, crowding portals worldwide.

Data Management Bom Management Ppt Sample
This is a data management bom management ppt sample. This is a six stage process. The stages in this process are arrows, business, marketing.

Master Data Management Regulatory Compliance Ppt Example
This is a master data management regulatory compliance ppt example. This is a three stage process. The stages in this process are business, marketing.

Submit Data Collection Request Ppt Design Templates
This is a submit data collection request ppt design templates. This is a thirteen stage process. The stages in this process are refine data collection approach and schedule, submit data collection request, organize and kick of projects, currently being used for future use metric, critical reporting requirements definition, meet with and interview president and executive leadership, currents state assessment gap and analysis and process capability, conduct key stakeholders alignment meeting, conduct vision workshop with executive leadership, information and data assessment, internal reporting requirements, future state capability vision, implementation considerations and high level plan.
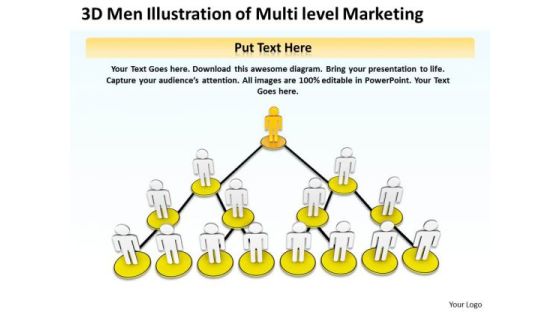
Business Plan Diagram 3d Men Illustration Of Multi Level Marketing PowerPoint Templates
We present our business plan diagram 3d men illustration of multi level marketing PowerPoint templates.Use our Business PowerPoint Templates because Our PowerPoint Templates and Slides are created with admirable insight. Use them and give your group a sense of your logical mind. Present our People PowerPoint Templates because Our PowerPoint Templates and Slides will provide weight to your words. They will bring out the depth of your thought process. Use our Leadership PowerPoint Templates because Our PowerPoint Templates and Slides will Embellish your thoughts. They will help you illustrate the brilliance of your ideas. Download and present our Communication PowerPoint Templates because Our PowerPoint Templates and Slides help you meet the demand of the Market. Just browse and pick the slides that appeal to your intuitive senses. Use our Success PowerPoint Templates because Your ideas provide food for thought. Our PowerPoint Templates and Slides will help you create a dish to tickle the most discerning palate.Use these PowerPoint slides for presentations relating to business, character, chart, communicate, communication, compensate, compensation, concept, distributor, figures, flow, grow, growth, hierarchy, human, illustration, individual, internet, lead, leader, leadership, level, man, management, manager, market, marketing, mlm, multi, network, node, organization, people, person, progress, pyramid, recruited, referred, render, sales, salespeople, selling, social, sphere, strategy, structure, success, team, teamwork, tree. The prominent colors used in the PowerPoint template are Yellow, Orange, White. PowerPoint presentation experts tell us our business plan diagram 3d men illustration of multi level marketing PowerPoint templates provide you with a vast range of viable options. Select the appropriate ones and just fill in your text. Use our compensate PowerPoint templates and PPT Slides are visually appealing. You can be sure our business plan diagram 3d men illustration of multi level marketing PowerPoint templates are visually appealing. Presenters tell us our chart PowerPoint templates and PPT Slides will help you be quick off the draw. Just enter your specific text and see your points hit home. You can be sure our business plan diagram 3d men illustration of multi level marketing PowerPoint templates will get their audience's attention. Professionals tell us our communicate PowerPoint templates and PPT Slides are readymade to fit into any presentation structure.
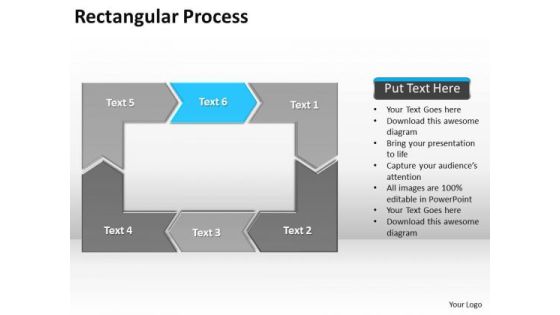
Ppt Reinforcing Light Blue Arrow Rectangular Process Diagram PowerPoint Templates
PPT reinforcing light blue arrow rectangular process diagram PowerPoint Templates-Use this Amazing PowerPoint Diagram to represent Recycle or reinforcement Process. It consists of various puzzles connected to each other forming rectangle. It signifies convert, reclaim, recover, reprocess, salvage, save etc. This is presented by light Blue Arrow here.-Can be used for presentations on arrows, business, center, circle, concept, connections, curve, cycle, directions, distribution, figure, group, human, illustration, management, meeting, middle, objects, people, plan, planning, process-PPT reinforcing light blue arrow rectangular process diagram PowerPoint Templates

Ppt Consecutive Hexagonal Text Boxes PowerPoint Background 4 State Diagram Templates
PPT consecutive hexagonal text boxes powerpoint background 4 state diagram Templates-Develop competitive advantage with our above template which contains a diagram of four hexagons. This PowerPoint diagram slide shows four parts in an idea. You can use it to depict a list. You can edit the colors of hexagons. -PPT consecutive hexagonal text boxes powerpoint background 4 state diagram Templates-3d, Appointment, Box, Calendar, Cell, Cellular, Color, Diary, Due, Engagement, Event, Everyday, Figure, Grid, Hexagon, Letters, Memo, Message, Note, Order, Organizer, Schedule, Seasonal, Second, Structure, Symbol, System, Text
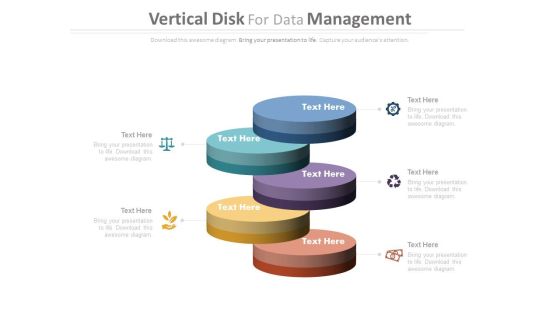
Vertical Steps For Data Management Powerpoint Template
This PowerPoint template contains diagram of vertical steps. You may use this PPT slide to depict data management. The color coding of this template is specifically designed to highlight you points.
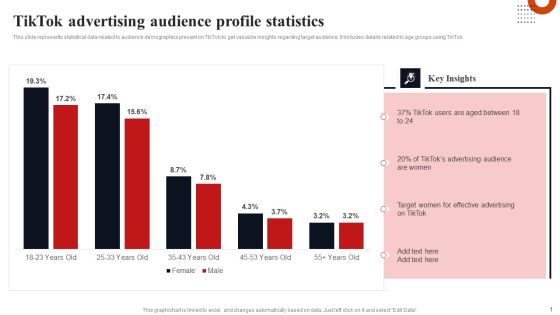
Tiktok Advertising Audience Profile Statistics Inspiration PDF
This slide represents statistical data related to audience demographics present on TikTok to get valuable insights regarding target audience. It includes details related to age groups using TikTok. Are you in need of a template that can accommodate all of your creative concepts This one is crafted professionally and can be altered to fit any style. Use it with Google Slides or PowerPoint. Include striking photographs, symbols, depictions, and other visuals. Fill, move around, or remove text boxes as desired. Test out color palettes and font mixtures. Edit and save your work, or work with colleagues. Download Tiktok Advertising Audience Profile Statistics Inspiration PDF and observe how to make your presentation outstanding. Give an impeccable presentation to your group and make your presentation unforgettable.
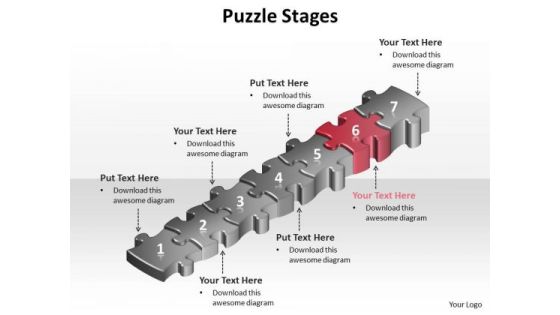
Ppt Black And Red Layouts PowerPoint 2003 Success Step Templates
PPT black and red layouts PowerPoint 2003 success step Templates-Use this Continuous PowerPoint Diagram to represent the Red stage of the Process. This PowerPoint Diagram Portrays the concept of Complete Process Represented by Puzzle. This PowerPoint diagram will fit for Business Presentations. You can apply other 3D Styles and shapes to the slide to enhance your presentations.-PPT black and red layouts PowerPoint 2003 success step Templates-achievement, activity, adversity, bridge, built, business, cartoon, challenge, character, computer, concept, construction, creativity, decisions, figure, games, goal, graphic, icon, idea, intelligence, organization, people, planning, problems, puzzle, solution, stick, strategy, success

Ppt Busines Men Silhouettes Standing On 3d Circular PowerPoint Templates
PPT busines men silhouettes standing on 3d circular PowerPoint Templates-This PowerPoint Diagram signifies the two approaches opposite to each other explained by two different persons. This Business oriented Diagram will be very helpful for comparing different approaches. -PPT busines men silhouettes standing on 3d circular PowerPoint Templates-Arrow, Business, Challenge, Character, Circle, Circular, Concept, Connected, Connection, Design, Element, Expression, Feeling, Figure, Fit, Game, Gesture, Gold, Green, Hold, Icon, Isolated, Metaphor, Motivate, Motivation, Object, Office, Over, Partner, Partnership, Piece, Pose, Presentation, Problem, Process, Puzzle, Recycle, Recycling, Sign, Solution, Symbol, Team, Teamwork
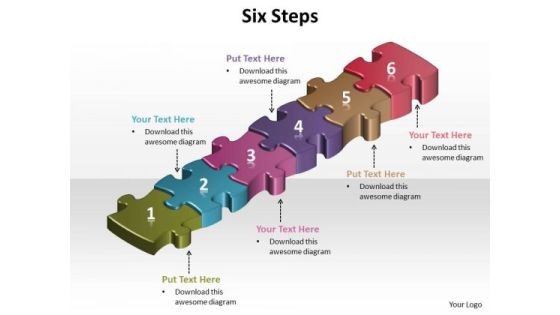
Ppt 6 Jigsaw Autoshape Puzzle PowerPoint Template Free Steps Templates
PPT 6 jigsaw autoshape puzzle powerpoint template free steps Templates-This PowerPoint Diagram consists of colorful Puzzles attached to each other forming a complete process and defining its steps. This PowerPoint Diagram can be used in Investor presentations for Initial Public Offerings, Annual general meetings and financial seminars.-PPT 6 jigsaw autoshape puzzle powerpoint template free steps Templates-1, 2, 3, 4, 5, 6, abstract, alphabet, background, beginning, blue, calculations, childhood, colorful, count, cutout, design, easy, education, eight, elementary, figure, fun, green, indoor, isolated, knowledge, learn, letter, maths, nine, number, object, one, pieces, play, preschool, puzzle, scattered, step, still, studio, symbol, text, three, two, type, typeset, white, yellow
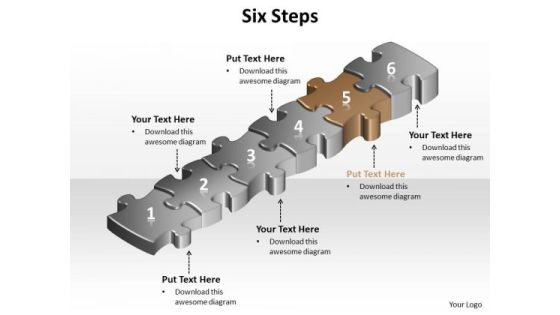
Ppt Brown Crossword Puzzle PowerPoint Template Step Templates
PPT brown crossword puzzle powerpoint template step Templates-This PowerPoint Diagram shows the Complete Process Represented by Puzzles. It signifies the Whole Process that is involved in Business. This PowerPoint diagram will fit for Business Presentations.-PPT brown crossword puzzle powerpoint template step Templates-1, 2, 3, 4, 5, 6, abstract, alphabet, background, beginning, blue, calculations, childhood, colorful, count, cutout, design, easy, education, eight, elementary, figure, fun, green, indoor, isolated, knowledge, learn, letter, maths, nine, number, object, one, pieces, play, preschool, puzzle, scattered, step, still, studio, symbol, text, three, two, type, typeset, white, yellow
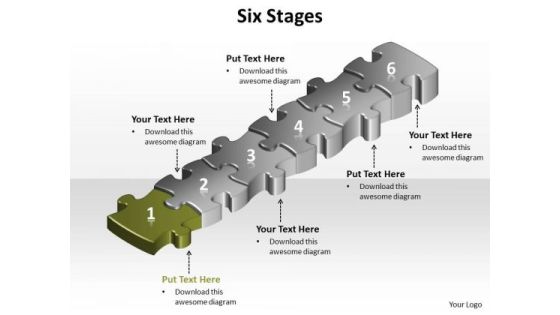
Ppt Green Puzzle Modifying Slide Layouts PowerPoint Free Download Step Templates
PPT green puzzle modifying slide layouts powerpoint free download step Templates-This PowerPoint Diagram shows the Complete Process Represented by Green Puzzle. It signifies the Whole Process that is involved in Business. This PowerPoint diagram will fit for Business Presentations.-PPT green puzzle modifying slide layouts powerpoint free download step Templates-1, 2, 3, 4, 5, 6, abstract, alphabet, background, beginning, blue, calculations, childhood, colorful, count, cutout, design, easy, education, eight, elementary, figure, fun, green, indoor, isolated, knowledge, learn, letter, maths, nine, number, object, one, pieces, play, preschool, puzzle, scattered, step, still, studio, symbol, text, three, two, type, typeset, white, yellow

Ppt Purple Puzzle Step PowerPoint Templates
PPT purple puzzle step PowerPoint Templates-This PowerPoint Diagram shows the Complete Process Represented by Puzzle. It signifies the Whole Process that is involved in Business. This PowerPoint diagram will fit for Business Presentations.-PPT purple puzzle step PowerPoint Templates-1, 2, 3, 4, 5, 6, abstract, alphabet, background, beginning, blue, calculations, childhood, colorful, count, cutout, design, easy, education, eight, elementary, figure, fun, green, indoor, isolated, knowledge, learn, letter, maths, nine, number, object, one, pieces, play, preschool, puzzle, scattered, step, still, studio, symbol, text, three, two, type, typeset, white, yellow
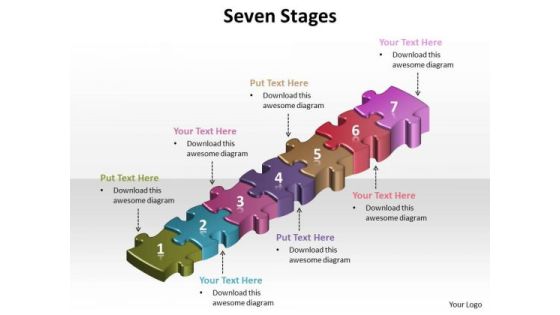
Ppt 7 Success Steps PowerPoint Templates
PPT 7 success steps PowerPoint Templates-This PowerPoint Diagram shows you the Vertical implementation of seven steps using Puzzles which are attached to each other. This image has been professionally designed to emphasize the concept of Continuous Process. This image has been conceived to enable you to emphatically communicate your ideas in your Business PPT presentation-PPT 7 success steps PowerPoint Templates-achievement, activity, adversity, bridge, built, business, cartoon, challenge, character, computer, concept, construction, creativity, decisions, figure, games, goal, graphic, icon, idea, intelligence, organization, people, planning, problems, puzzle, solution, stick, strategy, success
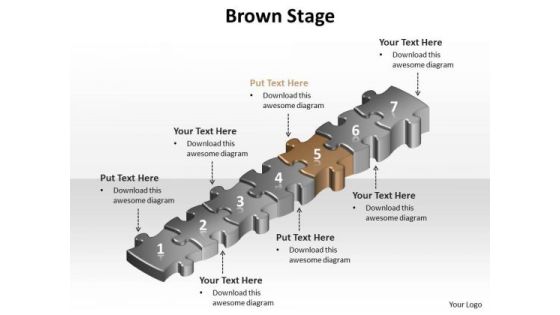
Ppt Brown Success Step PowerPoint Templates
PPT brown success step PowerPoint Templates-This diagram helps you to analyze all the connected ideas and also can be used to show seven aspects of an issue. This PowerPoint Linear process diagram is used to show interrelated ideas or concepts. This diagram is useful in just about any type of presentation.-PPT brown success step PowerPoint Templates-achievement, activity, adversity, bridge, built, business, cartoon, challenge, character, computer, concept, construction, creativity, decisions, figure, games, goal, graphic, icon, idea, intelligence, organization, people, planning, problems, puzzle, solution, stick, strategy, success

Ppt Cyber PowerPoint On Add Success Step Templates
PPT cyber PowerPoint on add success step Templates-Visually support your Microsoft office PPT Presentation with our above Diagram illustrating seventh stage using pink puzzle piece. This way, you can use the idea of a jigsaw quickly and easily in your presentation. Use this Diagram to illustrate your method, piece by piece, and interlock the whole process in the minds of your audience.-PPT cyber PowerPoint on add success step Templates-achievement, activity, adversity, bridge, built, business, cartoon, challenge, character, computer, concept, construction, creativity, decisions, figure, games, goal, graphic, icon, idea, intelligence, organization, people, planning, problems, puzzle, solution, stick, strategy, success

Ppt Purple Success Step PowerPoint Templates
PPT purple success step PowerPoint Templates-This PowerPoint Diagram shows seven jigsaw puzzle pieces connected together showing the horizontal process. It is helpful to describe interrelated issues, Approaches or Methods. It imitates alternation, chain, circle, circuit, course, loop, period, periodicity, revolution, rhythm, ring, rotation, round, run, sequel, sequence, series, succession etc. You can edit text, color, shade and style as per you need.-PPT purple success step PowerPoint Templates-achievement, activity, adversity, bridge, built, business, cartoon, challenge, character, computer, concept, construction, creativity, decisions, figure, games, goal, graphic, icon, idea, intelligence, organization, people, planning, problems, puzzle, solution, stick, strategy, success

Four Staged Numeric Tags For Data Representation Powerpoint Template
Our above PowerPoint slide contains diagram of four numeric tags. Download this business slide for data representations. Use this diagram to impart more clarity to data and to create more sound impact on viewers.
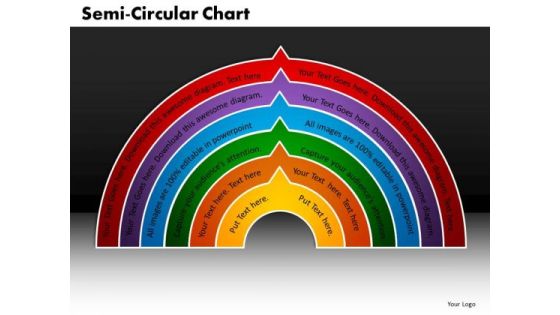
Business Cycle Process PowerPoint Templates Business Semi Circular Ppt Slides
Business Cycle Process PowerPoint Templates Business Semi Circular PPT Slides-This business semi circular chart can be used for any topic that have a progressive order including business management positions, products sold, business locations, etc.-Business Cycle Process PowerPoint Templates Business Semi Circular PPT Slides-This template can be used for presentations relating to Achievement, Active, Banner, Boss, Boy, Business, Buy, Caucasian, Chain, College, Concept, Couple, Coworkers, Crowd, Diversity, Figure, Group, Icon, Idea, Joy, Large, Manager, Many,Number, Organization, People, Portrait, Reflections, Semicircle, Sign, Stage, Stand, Student, Success, Symbol

Social Data And Communication Data Representation Powerpoint Template
This PPT slide has been designed with text layout. This PowerPoint template is designed to display text message in visual manner. This professional slide helps in making an instant impact on viewers.

Security Administration Powerpoint Shapes
This is a security administration powerpoint shapes. This is a three stage process. The stages in this process are storage management, directory service administration, security administration.
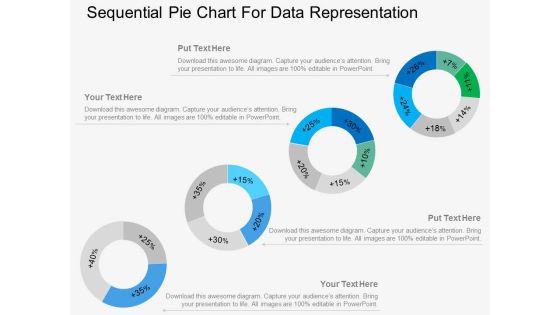
Four Sequential Pie Charts For Data Representation Powerpoint Template
Our above PowerPoint template displays infographic diagram of sequential pie chart. This diagram slide may be used for data representation in visual manner. Above slide provide ideal backdrop to make business presentations.
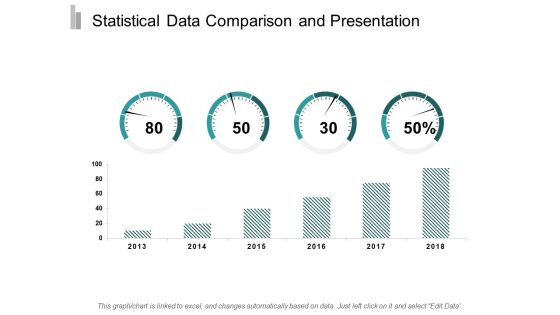
Statistical Data Comparison And Presentation Ppt Powerpoint Presentation Gallery Backgrounds
This is a statistical data comparison and presentation ppt powerpoint presentation gallery backgrounds. This is a two stage process. The stages in this process are data presentation, content presentation, information presentation.

Data Driven Marketing Solutions Firm Company Profile Key Statistics Template PDF
The following slide highlights the financial statistics for the year 2023. The stats show the change in global data and insights revenue, total revenue, EBITDA, SaaS platform revenue and operating net cash flow. This Data Driven Marketing Solutions Firm Company Profile Key Statistics Template PDF is perfect for any presentation, be it in front of clients or colleagues. It is a versatile and stylish solution for organizing your meetings. The Data Driven Marketing Solutions Firm Company Profile Key Statistics Template PDF features a modern design for your presentation meetings. The adjustable and customizable slides provide unlimited possibilities for acing up your presentation. Slidegeeks has done all the homework before launching the product for you. So, do not wait, grab the presentation templates today

Home Decoration Company Profile Key Financial Statistics Portrait PDF
This slide focuses on future expansion plans of interior designing company which includes service diversification, engage with target audience, geographic expansion, etc.Deliver an awe inspiring pitch with this creative Home Decoration Company Profile Key Financial Statistics Portrait PDF bundle. Topics like Utilization Rate, Operating Profit, Customer Retention can be discussed with this completely editable template. It is available for immediate download depending on the needs and requirements of the user.

Statistics Evaluation Template Diagram Ppt Slide Styles
This is a statistics evaluation template diagram ppt slide styles. This is a five stage process. The stages in this process are data gathering advice, data collection, track and measure, profile segment, data quality.
Statistical Data Icon Of Data Analytics Using Bar Graph Background PDF
Presenting statistical data icon of data analytics using bar graph background pdf to dispense important information. This template comprises four stages. It also presents valuable insights into the topics including statistical data icon of data analytics using bar graph. This is a completely customizable PowerPoint theme that can be put to use immediately. So, download it and address the topic impactfully.

Big Data Processing Application Ppt PowerPoint Presentation Shapes
This is a big data processing application ppt powerpoint presentation shapes. This is a two stage process. The stages in this process are small data, big data, low volumes, batch velocities, structured varieties, into petabyte volumes.

Country Profile Statistics Of Mexico Dashboard Ppt Portfolio Outline PDF
Presenting Country Profile Statistics Of Mexico Dashboard Ppt Portfolio Outline PDF to dispense important information. This template comprises one stages. It also presents valuable insights into the topics including Development Index, GDP Per Capita, Global Adaptation Initiative. This is a completely customizable PowerPoint theme that can be put to use immediately. So, download it and address the topic impactfully.
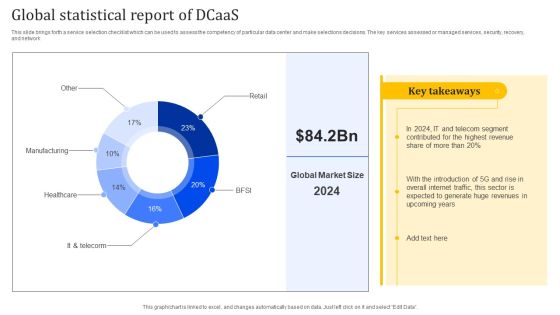
Global Statistical Report Of Dcaas Portrait PDF
This slide brings forth a service selection checklist which can be used to assess the competency of particular data center and make selections decisions. The key services assessed or managed services, security, recovery, and network. Showcasing this set of slides titled Global Statistical Report Of Dcaas Portrait PDF. The topics addressed in these templates are Manufacturing, Healthcare, Global Statistical. All the content presented in this PPT design is completely editable. Download it and make adjustments in color, background, font etc. as per your unique business setting.
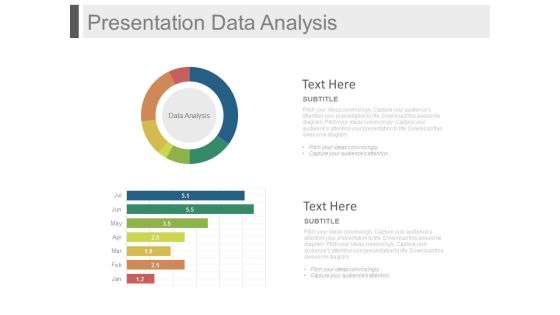
Presentation Data Analysis Ppt Slides
This is a presentation data analysis ppt slides. This is a two stage process. The stages in this process are business, finance, marketing.

United Nations Country Profile Statistics Dashboard Ppt Outline Microsoft PDF
Persuade your audience using this United Nations Country Profile Statistics Dashboard Ppt Outline Microsoft PDF. This PPT design covers one stages, thus making it a great tool to use. It also caters to a variety of topics including Human Development Index, GDP Per Capita, GHG Emissions. Download this PPT design now to present a convincing pitch that not only emphasizes the topic but also showcases your presentation skills.
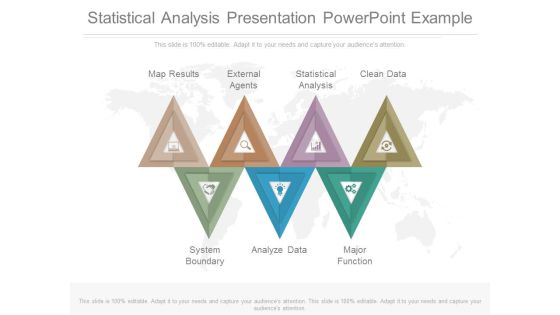
Statistical Analysis Presentation Powerpoint Example
This is a statistical analysis presentation powerpoint example. This is a seven stage process. The stages in this process are map results, external agents, statistical analysis, clean data, system boundary, analyze data, major function.
Feasibility Analysis Template Different Projects Demography Of Florida For Healthcare Icons PDF
This slide provides the glimpse of the demographic of Florida along with the population graph, Florida map and why we will open hospital in such a location. Deliver an awe inspiring pitch with this creative feasibility analysis template different projects demography of florida for healthcare icons pdf bundle. Topics like demography of florida for healthcare services can be discussed with this completely editable template. It is available for immediate download depending on the needs and requirements of the user.
Statistical Analysis Of Meta Data Dashboard Vector Icon Ppt PowerPoint Presentation Shapes PDF
Presenting statistical analysis of meta data dashboard vector icon ppt powerpoint presentation shapes pdf to dispense important information. This template comprises three stages. It also presents valuable insights into the topics including statistical analysis of meta data dashboard vector icon. This is a completely customizable PowerPoint theme that can be put to use immediately. So, download it and address the topic impactfully.

Arrow Infographics For Financial Data Analysis Powerpoint Template
This PowerPoint slide contains diagram of arrows infographic. This professional slide helps to exhibit financial data analysis for business growth. Use this PowerPoint template to make impressive presentations.

Data Reports Visualization Vector Ppt PowerPoint Presentation Visual Aids Deck
Presenting this set of slides with name data reports visualization vector ppt powerpoint presentation visual aids deck. The topics discussed in these slides are data visualization icon, research analysis, business focus. This is a completely editable PowerPoint presentation and is available for immediate download. Download now and impress your audience.

Screen Sketch Drawn By Designer Ppt PowerPoint Presentation Model Shapes PDF
Pitch your topic with ease and precision using this screen sketch drawn by designer ppt powerpoint presentation model shapes pdf. This layout presents information on screen sketch drawn by designer. It is also available for immediate download and adjustment. So, changes can be made in the color, design, graphics or any other component to create a unique layout.
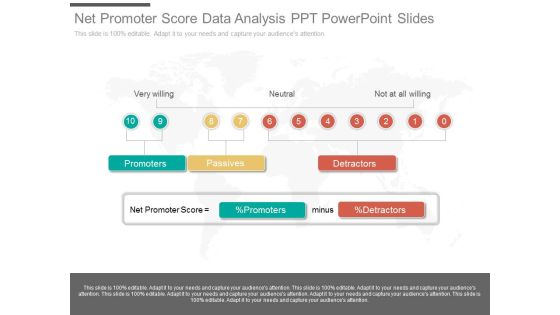
Net Promoter Score Data Analysis Ppt Powerpoint Slides
This is a net promoter score data analysis ppt powerpoint slides. This is a ten stage process. The stages in this process are very willing, neutral, not at all willing, promoters, passives, detractors, net promoter score, percentage promoters, minus, percentage detractors.
Internet Business Strategy 3d Happy Family Sketch Adaptable Concepts
Make Your Dreams A Reality With Our Internetbusinessstrategy3dhappyfamilysketchadaptableconcepts Powerpoint Templates. Your Ideas Will Begin To Take Shape.

Drawing Of Alarm Clock Ppt PowerPoint Presentation Inspiration
This is a drawing of alarm clock ppt powerpoint presentation inspiration. This is a four stage process. The stages in this process are drawing, sketch, outline.

Drawing Of Loudspeaker With Pencil Ppt PowerPoint Presentation Ideas Clipart
This is a drawing of loudspeaker with pencil ppt powerpoint presentation ideas clipart. This is a four stage process. The stages in this process are drawing, sketch, outline.
Drawing Of Refresh Icon Ppt PowerPoint Presentation Inspiration Layouts
This is a drawing of refresh icon ppt powerpoint presentation inspiration layouts. This is a one stage process. The stages in this process are drawing, sketch, outline.

Role of Tokenization in Advancing Data Security PPT Example
Use this Role of Tokenization in Advancing Data Security PPT Example to ensure the business world gets to know you as a presentation expert with tremendous recall value. With its focus on providing the worlds best designs to highlight business ideas that have the potential to change the world, this PPT Template is sure to win you clients. The complete deck in eighty three slides is a compendium of information, structured in a manner that provides the best framework for a presentation. Use this completely editable and customizable presentation to make an impact and improve your order book. Download now.
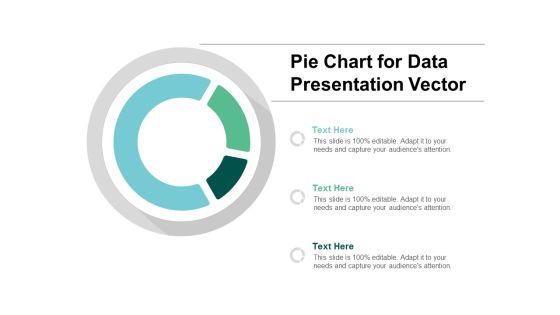
Pie Chart For Data Presentation Vector Ppt PowerPoint Presentation Summary Files
Presenting this set of slides with name pie chart for data presentation vector ppt powerpoint presentation summary files. The topics discussed in these slides are data visualization icon, research analysis, business focus. This is a completely editable PowerPoint presentation and is available for immediate download. Download now and impress your audience.
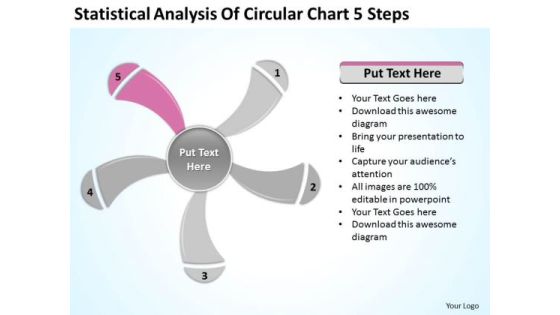
Statistical Analysis Of Circular Chart 5 Steps Ppt Outline For Business Plan PowerPoint Slides
We present our statistical analysis of circular chart 5 steps ppt outline for business plan PowerPoint Slides.Present our Business PowerPoint Templates because Our PowerPoint Templates and Slides will definately Enhance the stature of your presentation. Adorn the beauty of your thoughts with their colourful backgrounds. Download our Signs PowerPoint Templates because They will Put the wind in your sails. Skim smoothly over the choppy waters of the market. Download our Shapes PowerPoint Templates because Our PowerPoint Templates and Slides come in all colours, shades and hues. They help highlight every nuance of your views. Download and present our Metaphors-Visual Concepts PowerPoint Templates because Our PowerPoint Templates and Slides will let your words and thoughts hit bullseye everytime. Download and present our Process and Flows PowerPoint Templates because Our PowerPoint Templates and Slides will help you be quick off the draw. Just enter your specific text and see your points hit home.Use these PowerPoint slides for presentations relating to graphically, graphic, vector, layout, business, computation, sign, infochart, visual, symbol, template, diagram, calculations, sector, data, revenue, schedule, element, analysis, drawing, report, technology, contour, classification, graph, modern, illustration, icon, comparison, object, chart, collection, science, color, growth, composition, professional, set, education, math, profits, information, symmetry, statistic, structure, infographics, button. The prominent colors used in the PowerPoint template are Pink, Gray, White.

Data Types In Business Statistics With Ratio Ppt PowerPoint Presentation File Shapes PDF
Presenting data types in business statistics with ratio ppt powerpoint presentation file shapes pdf to dispense important information. This template comprises four stages. It also presents valuable insights into the topics including ratio, interval, nominal. This is a completely customizable PowerPoint theme that can be put to use immediately. So, download it and address the topic impactfully.
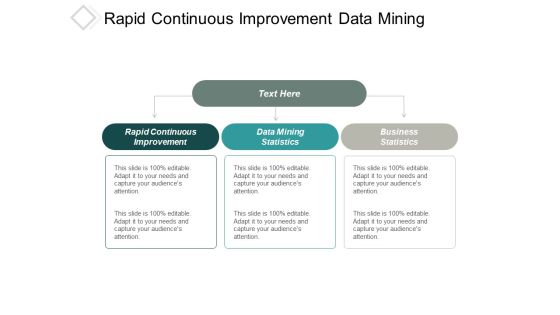
Rapid Continuous Improvement Data Mining Statistics Business Statistics Ppt PowerPoint Presentation Pictures Introduction
This is a rapid continuous improvement data mining statistics business statistics ppt powerpoint presentation pictures introduction. This is a three stage process. The stages in this process are rapid continuous improvement, data mining statistics, business statistics.

Financial Statistics Ppt Samples Download
This is a financial statistics ppt samples download. This is a six stage process. The stages in this process are business, finance, percentage, dollar, data.

Big Statistical Science Half Yearly Roadmap Portrait
Presenting our innovatively structured big statistical science half yearly roadmap portrait Template. Showcase your roadmap process in different formats like PDF, PNG, and JPG by clicking the download button below. This PPT design is available in both Standard Screen and Widescreen aspect ratios. It can also be easily personalized and presented with modified font size, font type, color, and shapes to measure your progress in a clear way.
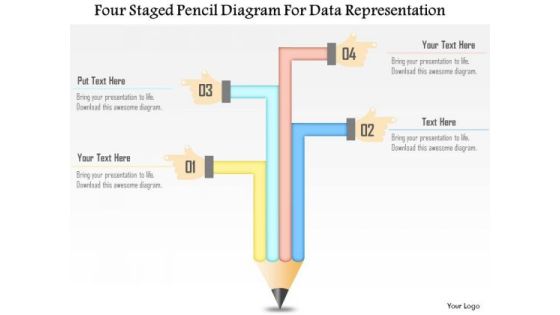
Business Diagram Four Staged Pencil Diagram For Data Representation Presentation Template
This business diagram has been designed with four staged pencil chart. This slide suitable for data representation. You can also use this slide to present four steps of any business process. Use this diagram to present your views in a wonderful manner.

Business Diagram Business Bar Graph For Data Analysis Presentation Template
This business slide displays pie charts with percentage ratios. This diagram is a data visualization tool that gives you a simple way to present statistical information. This slide helps your audience examines and interprets the data you present.

Marketing Agency Company Outline Key Statistics Structure PDF
The following slide highlights the financial statistics for the year 2021. The stats show the change in global data and insights revenue, total revenue, EBITDA, SaaS platform revenue and operating net cash flow. The Marketing Agency Company Outline Key Statistics Structure PDF is a compilation of the most recent design trends as a series of slides. It is suitable for any subject or industry presentation, containing attractive visuals and photo spots for businesses to clearly express their messages. This template contains a variety of slides for the user to input data, such as structures to contrast two elements, bullet points, and slides for written information. Slidegeeks is prepared to create an impression.
Magnifying Glass With Arrow Statistical Analysis Vector Icon Ppt PowerPoint Presentation Show Icon
Presenting this set of slides with name magnifying glass with arrow statistical analysis vector icon ppt powerpoint presentation show icon. This is a three stage process. The stages in this process are data icon, status icon, status symbol icon. This is a completely editable PowerPoint presentation and is available for immediate download. Download now and impress your audience.

Data Organization Quarterly Roadmap With Statistics And Machine Learning Formats
Presenting the data organization quarterly roadmap with statistics and machine learning formats. The template includes a roadmap that can be used to initiate a strategic plan. Not only this, the PowerPoint slideshow is completely editable and you can effortlessly modify the font size, font type, and shapes according to your needs. This PPT slide can be easily reached in standard screen and widescreen aspect ratios. The set is also available in various formats like PDF, PNG, and JPG. So download and use it multiple times as per your knowledge.

Consumer Statistics Analysis Vector Icon Ppt PowerPoint Presentation File Guidelines PDF
Presenting this set of slides with name consumer statistics analysis vector icon ppt powerpoint presentation file guidelines pdf. This is a three stage process. The stages in this process are consumer statistics analysis vector icon. This is a completely editable PowerPoint presentation and is available for immediate download. Download now and impress your audience.
Magnifying Glass Bar Graph Showing Business Statistical Analysis Ppt PowerPoint Presentation File Sample PDF
Presenting this set of slides with name magnifying glass bar graph showing business statistical analysis ppt powerpoint presentation file sample pdf. This is a three stage process. The stages in this process are magnifying glass bar graph showing business statistical analysis. This is a completely editable PowerPoint presentation and is available for immediate download. Download now and impress your audience.

Business Statistics Assessment Graph Icon Ppt PowerPoint Presentation Slides Background Images PDF
Presenting business statistics assessment graph icon ppt powerpoint presentation slides background images pdf to dispense important information. This template comprises three stages. It also presents valuable insights into the topics including business statistics assessment graph icon. This is a completely customizable PowerPoint theme that can be put to use immediately. So, download it and address the topic impactfully.
Statistical Analysis Icon With Magnifying Glass Ppt PowerPoint Presentation Gallery Clipart Images PDF
Persuade your audience using this statistical analysis icon with magnifying glass ppt powerpoint presentation gallery clipart images pdf. This PPT design covers three stages, thus making it a great tool to use. It also caters to a variety of topics including statistical analysis icon with magnifying glass. Download this PPT design now to present a convincing pitch that not only emphasizes the topic but also showcases your presentation skills.
Statistical Analysis Icon With Pie Chart Ppt PowerPoint Presentation Diagram Templates PDF
Persuade your audience using this statistical analysis icon with pie chart ppt powerpoint presentation diagram templates pdf. This PPT design covers three stages, thus making it a great tool to use. It also caters to a variety of topics including statistical analysis icon with pie chart. Download this PPT design now to present a convincing pitch that not only emphasizes the topic but also showcases your presentation skills.

Icon Of BI System To Enhance Processes For Statistical Analysis Ppt Ideas Elements PDF
Persuade your audience using this Icon Of BI System To Enhance Processes For Statistical Analysis Ppt Ideas Elements PDF. This PPT design covers four stages, thus making it a great tool to use. It also caters to a variety of topics including Icon, BI System, Enhance Processes, Statistical Analysis. Download this PPT design now to present a convincing pitch that not only emphasizes the topic but also showcases your presentation skills.

Demographic Statistics Icon Depicting Data Analysis And User Profile Brochure PDF
Persuade your audience using this Demographic Statistics Icon Depicting Data Analysis And User Profile Brochure PDF. This PPT design covers three stages, thus making it a great tool to use. It also caters to a variety of topics including Demographic Statistics, Icon Depicting, Data Analysis. Download this PPT design now to present a convincing pitch that not only emphasizes the topic but also showcases your presentation skills.

Hand Drawn Sketch Ppt PowerPoint Presentation Complete Deck With Slides
Improve your presentation delivery using this Hand Drawn Sketch Ppt PowerPoint Presentation Complete Deck With Slides. Support your business vision and objectives using this well-structured PPT deck. This template offers a great starting point for delivering beautifully designed presentations on the topic of your choice. Comprising thirteen this professionally designed template is all you need to host discussion and meetings with collaborators. Each slide is self-explanatory and equipped with high-quality graphics that can be adjusted to your needs. Therefore, you will face no difficulty in portraying your desired content using this PPT slideshow. This PowerPoint slideshow contains every important element that you need for a great pitch. It is not only editable but also available for immediate download and utilization. The color, font size, background, shapes everything can be modified to create your unique presentation layout. Therefore, download it now.

Business Diagram Infographic To Present Statistical Data Presentation Template
This business diagram contains arrow infographic. Our professionally designed business diagram helps to present statistical data. Enlighten your audience with your breathtaking ideas.
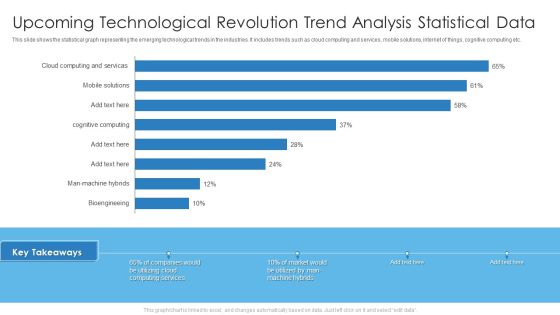
Upcoming Technological Revolution Trend Analysis Statistical Data Professional PDF
This slide shows the statistical graph representing the emerging technological trends in the industries. It includes trends such as cloud computing and services, mobile solutions, internet of things, cognitive computing etc. Deliver an awe inspiring pitch with this creative Upcoming Technological Revolution Trend Analysis Statistical Data Professional PDF bundle. Topics like Upcoming Technological Revolution, Trend Analysis Statistical Data can be discussed with this completely editable template. It is available for immediate download depending on the needs and requirements of the user.

Employee Viewing Statistical Data Of Estimated Website Views Background PDF
Presenting employee viewing statistical data of estimated website views background pdf to dispense important information. This template comprises four stages. It also presents valuable insights into the topics including employee viewing statistical data of estimated website views. This is a completely customizable PowerPoint theme that can be put to use immediately. So, download it and address the topic impactfully.
Statistical Data Graph Icon Showing Financial Forecast Rules PDF
Presenting statistical data graph icon showing financial forecast rules pdf to dispense important information. This template comprises four stages. It also presents valuable insights into the topics including statistical data graph icon showing financial forecast. This is a completely customizable PowerPoint theme that can be put to use immediately. So, download it and address the topic impactfully.
Statistical Data Icon Depicting Investment Marketing Information PDF
Persuade your audience using this statistical data icon depicting investment marketing information pdf. This PPT design covers four stages, thus making it a great tool to use. It also caters to a variety of topics including statistical data icon depicting investment marketing. Download this PPT design now to present a convincing pitch that not only emphasizes the topic but also showcases your presentation skills.

Social Media Marketing Statistical Data Icon Download PDF
Persuade your audience using this Social Media Marketing Statistical Data Icon Download PDF. This PPT design covers three stages, thus making it a great tool to use. It also caters to a variety of topics including Social Media Marketing, Statistical Data Icon. Download this PPT design now to present a convincing pitch that not only emphasizes the topic but also showcases your presentation skills.

Demographic Statistics Icon Illustrating Data Of Potential Customer Ideas PDF
Pitch your topic with ease and precision using this Demographic Statistics Icon Illustrating Data Of Potential Customer Ideas PDF. This layout presents information on Demographic Statistics, Icon Illustrating, Data Potential Customer. It is also available for immediate download and adjustment. So, changes can be made in the color, design, graphics or any other component to create a unique layout.

Demographic Statistics With Survey Research Data Elements PDF
Persuade your audience using this Demographic Statistics With Survey Research Data Elements PDF. This PPT design covers three stages, thus making it a great tool to use. It also caters to a variety of topics including Demographic Statistics, Survey Research Data. Download this PPT design now to present a convincing pitch that not only emphasizes the topic but also showcases your presentation skills.

Three Emerging Workplace Trend Analysis Statistical Data Guidelines PDF
This slide represents the statistical data related to the emerging trends in the workplace environment for organizational employees. It shows the effects of positive workplace environment, reasons for increased interest in remote work and factors attracting the employees. Deliver an awe inspiring pitch with this creative Three Emerging Workplace Trend Analysis Statistical Data Guidelines PDF bundle. Topics like Three Emerging Workplace, Trend Analysis Statistical Data can be discussed with this completely editable template. It is available for immediate download depending on the needs and requirements of the user.
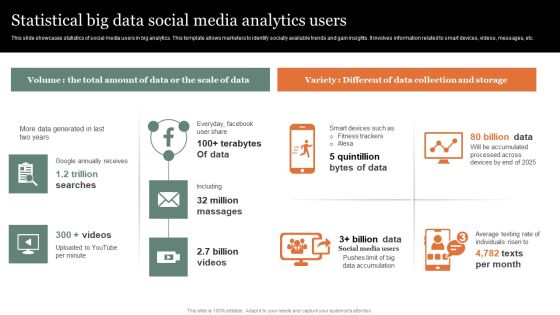
Statistical Big Data Social Media Analytics Users Pictures PDF
Showcasing this set of slides titled Statistical Big Data Social Media Analytics Users Pictures PDF Brochure. The topics addressed in these templates are Statistical, Social, Analytics. All the content presented in this PPT design is completely editable. Download it and make adjustments in color, background, font etc. as per your unique business setting.

Data Organization Half Yearly Roadmap With Statistics And Machine Learning Portrait
We present our data organization half yearly roadmap with statistics and machine learning portrait. This PowerPoint layout is easy to edit so you can change the font size, font type, color, and shape conveniently. In addition to this, the PowerPoint layout is Google Slides compatible, so you can share it with your audience and give them access to edit it. Therefore, download and save this well researched data organization half yearly roadmap with statistics and machine learning portrait in different formats like PDF, PNG, and JPG to smoothly execute your business plan.

data analytics statistics ppt powerpoint presentation file grid cpb
Presenting this set of slides with name data analytics statistics ppt powerpoint presentation file grid cpb. This is an editable Powerpoint five stages graphic that deals with topics like data analytics statistics to help convey your message better graphically. This product is a premium product available for immediate download and is 100 percent editable in Powerpoint. Download this now and use it in your presentations to impress your audience.

Data Security Statistics Ppt PowerPoint Presentation Infographic Template Cpb
Presenting this set of slides with name data security statistics ppt powerpoint presentation infographic template cpb. This is an editable Powerpoint three stages graphic that deals with topics like data security statistics to help convey your message better graphically. This product is a premium product available for immediate download and is 100 percent editable in Powerpoint. Download this now and use it in your presentations to impress your audience.
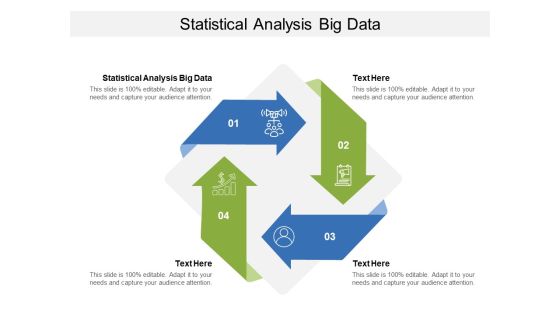
Statistical Analysis Big Data Ppt PowerPoint Presentation Ideas Diagrams Cpb
Presenting this set of slides with name statistical analysis big data ppt powerpoint presentation ideas diagrams cpb. This is an editable Powerpoint four stages graphic that deals with topics like statistical analysis big data to help convey your message better graphically. This product is a premium product available for immediate download and is 100 percent editable in Powerpoint. Download this now and use it in your presentations to impress your audience.

Data Mining Statistics Ppt PowerPoint Presentation Deck Cpb
Presenting this set of slides with name data mining statistics ppt powerpoint presentation deck cpb. This is an editable Powerpoint five stages graphic that deals with topics like data mining statistics to help convey your message better graphically. This product is a premium product available for immediate download and is 100 percent editable in Powerpoint. Download this now and use it in your presentations to impress your audience.

Data Leakage Statistics Ppt PowerPoint Presentation Icon Portfolio Cpb
Presenting this set of slides with name data leakage statistics ppt powerpoint presentation icon portfolio cpb. This is an editable Powerpoint four stages graphic that deals with topics like data leakage statistics to help convey your message better graphically. This product is a premium product available for immediate download and is 100 percent editable in Powerpoint. Download this now and use it in your presentations to impress your audience.

Data Driven Organizational Culture Icon Depicting Statistical Analysis Sample PDF
Persuade your audience using this data driven organizational culture icon depicting statistical analysis sample pdf. This PPT design covers three stages, thus making it a great tool to use. It also caters to a variety of topics including data driven organizational culture icon depicting statistical analysis. Download this PPT design now to present a convincing pitch that not only emphasizes the topic but also showcases your presentation skills.
Statistical Data Showing Sales Strategy Framework Icon Clipart PDF
Persuade your audience using this Statistical Data Showing Sales Strategy Framework Icon Clipart PDF. This PPT design covers three stages, thus making it a great tool to use. It also caters to a variety of topics including Statistical Data, Showing Sales Strategy, Framework Icon. Download this PPT design now to present a convincing pitch that not only emphasizes the topic but also showcases your presentation skills.

Corporate Man Preparing Presentation Icon Using Statistical Data Topics PDF
Persuade your audience using this Corporate Man Preparing Presentation Icon Using Statistical Data Topics PDF. This PPT design covers three stages, thus making it a great tool to use. It also caters to a variety of topics including Corporate Man, Preparing Presentation, Statistical Data. Download this PPT design now to present a convincing pitch that not only emphasizes the topic but also showcases your presentation skills.

Data Driven Marketing Solutions Firm Company Profile Company Website Engagement Statistics Template PDF
The following slide depicts the digital engagement data of pure profile company to monitor the business reach. It shows global traffic rank, monthly rank growth, visit duration, visit duration growth, page views, page views growth, bounce rate and bounce rate growth Present like a pro with Data Driven Marketing Solutions Firm Company Profile Company Website Engagement Statistics Template PDF Create beautiful presentations together with your team, using our easy to use presentation slides. Share your ideas in real time and make changes on the fly by downloading our templates. So whether you are in the office, on the go, or in a remote location, you can stay in sync with your team and present your ideas with confidence. With Slidegeeks presentation got a whole lot easier. Grab these presentations today.

Data Driven Consumer Partition Statistics With Action Plan Pictures PDF
Following slide brings forth the major data driven statistics to be used by managers for effective segmentation and targeting the audience. The statistics are related to return on investment, click through rate, sales, customer purchase rate and brand message. Persuade your audience using this Data Driven Consumer Partition Statistics With Action Plan Pictures PDF. This PPT design covers five stages, thus making it a great tool to use. It also caters to a variety of topics including Return On Investment, Click Through Rate, Sales, Customer Purchase Rate, Brand Message. Download this PPT design now to present a convincing pitch that not only emphasizes the topic but also showcases your presentation skills.

Data Organization Six Months Roadmap With Statistics And Machine Learning Portrait
Presenting our innovatively structured data organization six months roadmap with statistics and machine learning portrait Template. Showcase your roadmap process in different formats like PDF, PNG, and JPG by clicking the download button below. This PPT design is available in both Standard Screen and Widescreen aspect ratios. It can also be easily personalized and presented with modified font size, font type, color, and shapes to measure your progress in a clear way.

Growth After Reaching Critical Mass Statistical Curve Editable Ppt Slides
Growth_after_reaching_Critical_Mass_Statistical_Curve_Editable_PPT_Slides-These high quality powerpoint pre-designed slides and powerpoint templates have been carefully created by our professional team to help you impress your audience. All slides have been created and are 100% editable in powerpoint. Each and every property of any graphic - color, size, orientation, shading, outline etc. can be modified to help you build an effective powerpoint presentation. Any text can be entered at any point in the powerpoint template or slide. Simply DOWNLOAD, TYPE and PRESENT! These PowerPoint presentation slides can be used to represent themes relating to --Alone, apart, chasm, clipart, communication, concept, couple, crack, divide, divorce, estranged, female, figure, gap, gender, graphic, illustration, isolated, isolation, issues, loneliness, love, male, man, people, problems, romance, silhouette, stick, symbol, vector, woman-Growth_after_reaching_Critical_Mass_Statistical_Curve_Editable_PPT_Slides

Statistical Bell Curve Gap PowerPoint Slides And Editable Ppt Templates
Statistical_Bell_Curve_Gap_PowerPoint_Slides_and_Editable_PPT_templates-These high quality powerpoint pre-designed slides and powerpoint templates have been carefully created by our professional team to help you impress your audience. All slides have been created and are 100% editable in powerpoint. Each and every property of any graphic - color, size, orientation, shading, outline etc. can be modified to help you build an effective powerpoint presentation. Any text can be entered at any point in the powerpoint template or slide. Simply DOWNLOAD, TYPE and PRESENT! These PowerPoint presentation slides can be used to represent themes relating to --Alone, apart, chasm, clipart, communication, concept, couple, crack, divide, divorce, estranged, female, figure, gap, gender, graphic, illustration, isolated, isolation, issues, loneliness, love, male, man, people, problems, romance, silhouette, stick, symbol, vector, woman-Statistical_Bell_Curve_Gap_PowerPoint_Slides_and_Editable_PPT_templates

Procedure Of Evaluating Data Tools For Statistical Process Professional PDF
This template highlights the data analysis tools that allow to analyze and model the data. It include key analysis tools with their ,features, free trail, pros and cons ,pricing and user review. Pitch your topic with ease and precision using this Procedure Of Evaluating Data Tools For Statistical Process Professional PDF. This layout presents information on Data Visualization Capabilities, Data Analysis, Data Connectivity. It is also available for immediate download and adjustment. So, changes can be made in the color, design, graphics or any other component to create a unique layout.

Statistical Data Supporting Use Of Synthesia AI Platform Background PDF
This slide represents the statistical data supporting the need for AI video generating platform which allows businesses and individuals to develop realistic, interactive and professional videos by using AI an deep learning. It includes details related to why users rate Synthesia as leading AI video creation platform. Formulating a presentation can take up a lot of effort and time, so the content and message should always be the primary focus. The visuals of the PowerPoint can enhance the presenters message, so our Statistical Data Supporting Use Of Synthesia AI Platform Background PDF was created to help save time. Instead of worrying about the design, the presenter can concentrate on the message while our designers work on creating the ideal templates for whatever situation is needed. Slidegeeks has experts for everything from amazing designs to valuable content, we have put everything into Statistical Data Supporting Use Of Synthesia AI Platform Background PDF.

Statistical Data Highlighting Gaming Industry Market Size Ideas PDF
Following slide exhibits types of popular gaming apps. Purpose of this slide is to determine trending and demanding gaming apps that drives revenue growth and download counts. It include appps such as adventure, role playing, arcade and betting. Showcasing this set of slides titled Statistical Data Highlighting Gaming Industry Market Size Ideas PDF. The topics addressed in these templates are Statistical Data Highlighting, Gaming Industry Market Size. All the content presented in this PPT design is completely editable. Download it and make adjustments in color, background, font etc. as per your unique business setting.
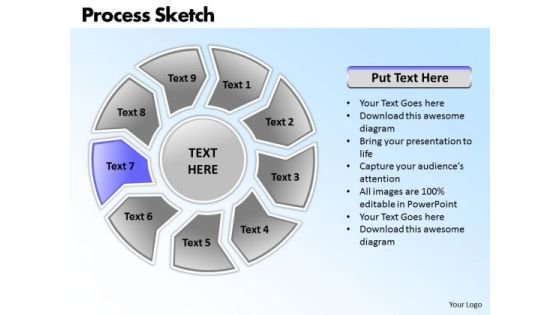
Ppt Circular Military Decision Making Process PowerPoint Presentation Sketch Templates
PPT circular military decision making process powerpoint presentation sketch Templates-Use this Astonishing PowerPoint Diagram to abstract the different phases of a single procedure. It symbolizes forever and ever, interminable, looped, no end of, no end to, on a treadmill, perpetual, prolonged, regular etc. It shows the highlighted seventh stage to be explained. This Business Diagram can be used in Marketing, Banking, and Management etc. You can edit text, color, shade and style as per you need.-PPT circular military decision making process powerpoint presentation sketch Templates-Arrow, Art, Blue, Business, Button, Circular, Clip, Design, Diagram, Drop, Element, Glowing, Graph, Graphic, Icon, Illustration, Isolated, Process, Round, Set, Shadow, Sphere, Symbol

Statistical Data Showcasing Key Elements Of Cyber War Rules PDF
This slide represents the statistics related to the key elements of the cyber terrorism. It includes elements such as fear as an outcome, civilian targets, criminality or illegality, digital means or target.Pitch your topic with ease and precision using this Statistical Data Showcasing Key Elements Of Cyber War Rules PDF This layout presents information on Cyber Terrorism, Political Or Ideological, Random Or Indiscriminate It is also available for immediate download and adjustment. So, changes can be made in the color, design, graphics or any other component to create a unique layout.

Addressable Market In Sector 1 Ppt PowerPoint Presentation Outline Shapes
This is a addressable market in sector 1 ppt powerpoint presentation outline shapes. This is a two stage process. The stages in this process are fossil fuels, nuclear, bioenergy, biofuels.

Customer Behavioral Data And Analytics Customer Lifecycle Statistics Elements PDF
Measure the engagement of a segment of a customers with your brand their last time of purchase and session. Each segment should be targeted differently by the marketing department. Deliver an awe inspiring pitch with this creative customer behavioral data and analytics customer lifecycle statistics elements pdf bundle. Topics like days since last session, days since last purchase, sessions per person, average session length can be discussed with this completely editable template. It is available for immediate download depending on the needs and requirements of the user.
Statistical Data For Identity Fraud Reports Icons PDF
This slide showcases identity thefts and frauds complaints in various years. This template focuses on providing layers of protection to customers digital identities and reduce risk of financial loss. It includes information related to consumer complainants, etc. Showcasing this set of slides titled Statistical Data For Identity Fraud Reports Icons PDF. The topics addressed in these templates are Poor Management Information, Lack Of Transparency, Protected Accounts. All the content presented in this PPT design is completely editable. Download it and make adjustments in color, background, font etc. as per your unique business setting.

Business Man Draws Financial Data For Analysis PowerPoint Templates
This PowerPoint slide has a theme for financial data analysis. This image has been designed to display concept of financial planning and analysis. Deliver amazing presentations to mesmerize your audience using this image

Statistical Data Ppt PowerPoint Presentation Complete Deck With Slides
Boost your confidence and team morale with this well-structured statistical data ppt powerpoint presentation complete deck with slides. This prefabricated set gives a voice to your presentation because of its well-researched content and graphics. Our experts have added all the components very carefully, thus helping you deliver great presentations with a single click. Not only that, it contains a set of twelve slides that are designed using the right visuals, graphics, etc. Various topics can be discussed, and effective brainstorming sessions can be conducted using the wide variety of slides added in this complete deck. Apart from this, our PPT design contains clear instructions to help you restructure your presentations and create multiple variations. The color, format, design anything can be modified as deemed fit by the user. Not only this, it is available for immediate download. So, grab it now.
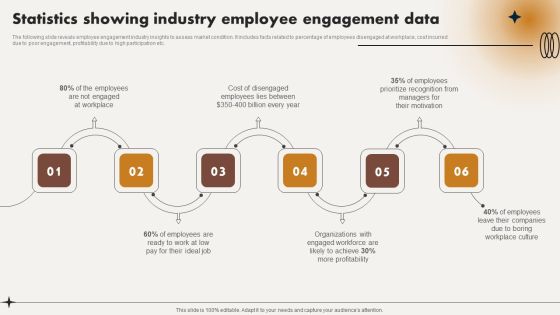
Statistics Showing Industry Employee Engagement Data Ppt File Example PDF
The following slide reveals employee engagement industry insights to assess market condition. It includes facts related to percentage of employees disengaged at workplace, cost incurred due to poor engagement, profitability due to high participation etc. Retrieve professionally designed Statistics Showing Industry Employee Engagement Data Ppt File Example PDF to effectively convey your message and captivate your listeners. Save time by selecting pre made slideshows that are appropriate for various topics, from business to educational purposes. These themes come in many different styles, from creative to corporate, and all of them are easily adjustable and can be edited quickly. Access them as PowerPoint templates or as Google Slides themes. You do not have to go on a hunt for the perfect presentation because Slidegeeks got you covered from everywhere.
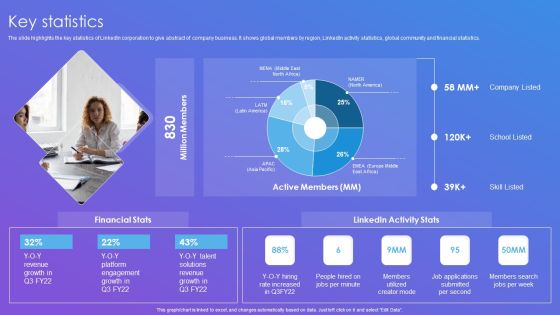
Linkedin Company Outline Key Statistics Summary PDF
The slide highlights the key statistics of LinkedIn corporation to give abstract of company business. It shows global members by region, LinkedIn activity statistics, global community and financial statistics.Deliver an awe inspiring pitch with this creative Linkedin Company Outline Key Statistics Summary PDF bundle. Topics like Revenue Growth, Platform Engagement Growth, Solutions Revenue can be discussed with this completely editable template. It is available for immediate download depending on the needs and requirements of the user.

Enterprise Statistic Model Ppt Layout Presentation Outline
This is a Enterprise Statistic Model Ppt Layout Presentation Outline. This is a five stage process. The stages in this process are interactive marketing, sales forecasting, market research, marketing intelligence, distributing information.

Business Profit Statistical Analysis Presentation Background Images
This is a business profit statistical analysis presentation background images. This is a five stage process. The stages in this process are collection of data, organization of data, interpretation of data, calculate results, analyze results.
Sketch Pen With Icons And Idea Bulb PowerPoint Template
Above is the creatively designed PowerPoint template which clearly demonstrates the process of ideation. You can use this design to show your colleagues how to work together on the different ideas for the betterment of the company or the organization. One can use this slide for the education purposes as well as to encourage the students to give their ideas. This innovatively designed template has four icons which can be changed as per your requirement. This is a perfect background to show the meaning of ideation. Include this template in your presentation and let your ideas come forward visually.

Magnifying Glass Ppt PowerPoint Presentation Outline Portrait
This is a magnifying glass ppt powerpoint presentation outline portrait. This is a one stage process. The stages in this process are magnify, marketing, strategy, planning, technology.
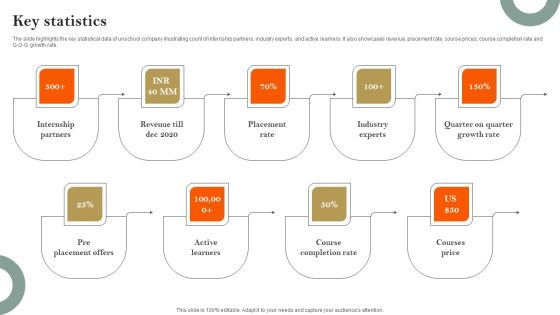
E Learning Platform Company Profile Key Statistics Ideas PDF
The slide highlights the key statistical data of unschool company illustrating count of internship partners, industry experts, and active learners. It also showcases revenue, placement rate, course prices, course completion rate and Q O Q growth rate. Make sure to capture your audiences attention in your business displays with our gratis customizable E Learning Platform Company Profile Key Statistics Ideas PDF. These are great for business strategies, office conferences, capital raising or task suggestions. If you desire to acquire more customers for your tech business and ensure they stay satisfied, create your own sales presentation with these plain slides.
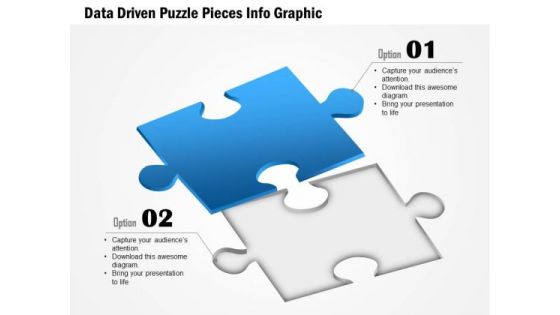
Business Diagram Data Driven Puzzle Pieces Info Graphic Presentation Template
Our above diagram provides data driven puzzle info graphic. This slide contains diagram of puzzle pieces depicting concepts like innovation strategy, research, solution, management and teamwork. Download this diagram to make professional presentations.
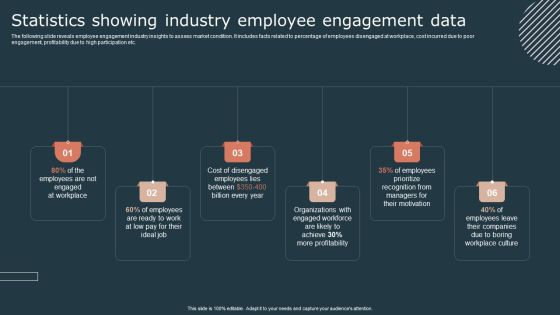
Effective Workforce Participation Action Planning Statistics Showing Industry Employee Engagement Data Portrait PDF
The following slide reveals employee engagement industry insights to assess market condition. It includes facts related to percentage of employees disengaged at workplace, cost incurred due to poor engagement, profitability due to high participation etc. Slidegeeks is here to make your presentations a breeze with Effective Workforce Participation Action Planning Statistics Showing Industry Employee Engagement Data Portrait PDF With our easy to use and customizable templates, you can focus on delivering your ideas rather than worrying about formatting. With a variety of designs to choose from, you are sure to find one that suits your needs. And with animations and unique photos, illustrations, and fonts, you can make your presentation pop. So whether you are giving a sales pitch or presenting to the board, make sure to check out Slidegeeks first.
Statistical Data Chart On Screen Monitor Ppt PowerPoint Presentation Outline Summary
Presenting this set of slides with name statistical data chart on screen monitor ppt powerpoint presentation outline summary. This is a one stage process. The stages in this process are data icon, status icon, status symbol icon. This is a completely editable PowerPoint presentation and is available for immediate download. Download now and impress your audience.

Rescue Statistics PowerPoint Icon C
3d illustration of a multi-segment colorful bar chart placed inside of a large red and white lifesaver on a reflective surface

Rescue Statistics PowerPoint Icon Cc
3d illustration of a multi-segment colorful bar chart placed inside of a large red and white lifesaver on a reflective surface

Rescue Statistics PowerPoint Icon S
3d illustration of a multi-segment colorful bar chart placed inside of a large red and white lifesaver on a reflective surface

Data Management Marketing Analysis Ppt Slide
This is a data management marketing analysis ppt slide. This is a eight stage process. The stages in this process are marketing, sales, business, success.
Types Statistical Data Ppt PowerPoint Presentation Outline Designs Download Cpb Pdf
Presenting this set of slides with name types statistical data ppt powerpoint presentation outline designs download cpb pdf. This is an editable Powerpoint five stages graphic that deals with topics like data leakage detection to help convey your message better graphically. This product is a premium product available for immediate download and is 100 percent editable in Powerpoint. Download this now and use it in your presentations to impress your audience.

Statistical Assessment Example Ppt Background Images
This is a statistical assessment example ppt background images. This is a five stage process. The stages in this process are data element, data field, indexed collection, keved collection, bean collection, statistical assessment.
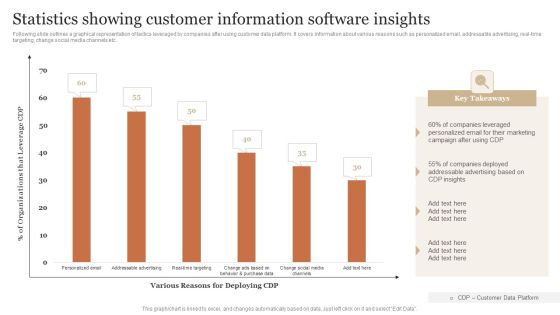
Statistics Showing Customer Information Software Insights Portrait PDF
Following slide outlines a graphical representation of tactics leveraged by companies after using customer data platform. It covers information about various reasons such as personalized email, addressable advertising, real-time targeting, change social media channels etc. Showcasing this set of slides titled Statistics Showing Customer Information Software Insights Portrait PDF. The topics addressed in these templates are Companies Leveraged, Personalized Marketing, Addressable Advertising. All the content presented in this PPT design is completely editable. Download it and make adjustments in color, background, font etc. as per your unique business setting.

Apparel Discounts Editable PowerPoint Slides Ppt Templates
Apparel_Discounts_Editable_PowerPoint_Slides_PPT_templates-These high quality powerpoint pre-designed slides and powerpoint templates have been carefully created by our professional team to help you impress your audience. All slides have been created and are 100% editable in powerpoint. Each and every property of any graphic - color, size, orientation, shading, outline etc. can be modified to help you build an effective powerpoint presentation. Any text can be entered at any point in the powerpoint template or slide. Simply DOWNLOAD, TYPE and PRESENT!-These PowerPoint Presentation slides can be used to represent themes like-3d, apparel, discounts, tag, army,background, battle, black, board, business, challenge, chess, chessboard, choice, competition, concept, conflict, decision, fight, figure, game, group, intelligence, isolated, king, knight, leisure, macro, move, objects, pawn, piece, plan, play, player, power, queen, set, shiny, soldier, sport, strategy, success, table, think, tournament, victory, war, white, win, winner-Apparel_Discounts_Editable_PowerPoint_Slides_PPT_templates

Percent Discounts Tags PowerPoint Slides Ppt Clipart
Percent_Discounts_Tags_PowerPoint_Slides_PPT_Clipart-These high quality powerpoint pre-designed slides and powerpoint templates have been carefully created by our professional team to help you impress your audience. All slides have been created and are 100% editable in powerpoint. Each and every property of any graphic - color, size, orientation, shading, outline etc. can be modified to help you build an effective powerpoint presentation. Any text can be entered at any point in the powerpoint template or slide. Simply DOWNLOAD, TYPE and PRESENT!-These PowerPoint Presentation slides can be used to represent themes like-3d, apparel, discounts, tag, army,background, battle, black, board, business, challenge, chess, chessboard, choice, competition, concept, conflict, decision, fight, figure, game, group, intelligence, isolated, king, knight, leisure, macro, move, objects, pawn, piece, plan, play, player, power, queen, set, shiny, soldier, sport, strategy, success, table, think, tournament, victory, war, white, win, winner-Percent_Discounts_Tags_PowerPoint_Slides_PPT_Clipart

Plan And Frame Problem Collect The Data Ppt Sample
This is a plan and frame problem collect the data ppt sample. This is a four stage process. The stages in this process are business, marketing, success.

Data Analytics Vector Icon Ppt PowerPoint Presentation Professional
Presenting this set of slides with name data analytics vector icon ppt powerpoint presentation professional. This is a four stage process. The stages in this process are data visualization icon, research analysis, business focus. This is a completely editable PowerPoint presentation and is available for immediate download. Download now and impress your audience.

Critical Mass Chasm Bell Curve PowerPoint Slides Editable Ppt Templates
Critical_Mass_Chasm_Bell_Curve_PowerPoint_Slides_Editable_PPT_templates-These high quality powerpoint pre-designed slides and powerpoint templates have been carefully created by our professional team to help you impress your audience. All slides have been created and are 100% editable in powerpoint. Each and every property of any graphic - color, size, orientation, shading, outline etc. can be modified to help you build an effective powerpoint presentation. Any text can be entered at any point in the powerpoint template or slide. Simply DOWNLOAD, TYPE and PRESENT! These PowerPoint presentation slides can be used to represent themes relating to --Alone, apart, chasm, clipart, communication, concept, couple, crack, divide, divorce, estranged, female, figure, gap, gender, graphic, illustration, isolated, isolation, issues, loneliness, love, male, man, people, problems, romance, silhouette, stick, symbol, vector, woman-Critical_Mass_Chasm_Bell_Curve_PowerPoint_Slides_Editable_PPT_templates
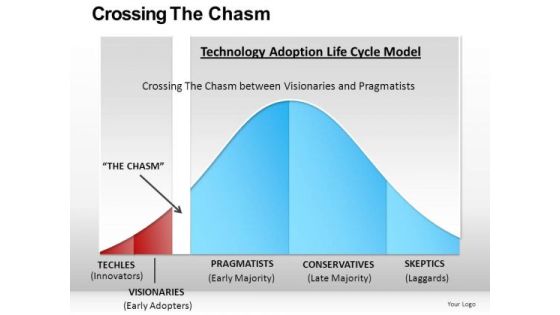
Critical Mass Technology Adoption PowerPoint Slides And Ppt Templates
Critical_Mass_Technology_Adoption_PowerPoint_Slides_and_PPT_templates-These high quality powerpoint pre-designed slides and powerpoint templates have been carefully created by our professional team to help you impress your audience. All slides have been created and are 100% editable in powerpoint. Each and every property of any graphic - color, size, orientation, shading, outline etc. can be modified to help you build an effective powerpoint presentation. Any text can be entered at any point in the powerpoint template or slide. Simply DOWNLOAD, TYPE and PRESENT! These PowerPoint presentation slides can be used to represent themes relating to --Alone, apart, chasm, clipart, communication, concept, couple, crack, divide, divorce, estranged, female, figure, gap, gender, graphic, illustration, isolated, isolation, issues, loneliness, love, male, man, people, problems, romance, silhouette, stick, symbol, vector, woman-Critical_Mass_Technology_Adoption_PowerPoint_Slides_and_PPT_templates

Life Cycle Charts Technology Adoption Model PowerPoint Templates
Life_Cycle_Charts_Technology_Adoption_Model_PowerPoint_templates-These high quality powerpoint pre-designed slides and powerpoint templates have been carefully created by our professional team to help you impress your audience. All slides have been created and are 100% editable in powerpoint. Each and every property of any graphic - color, size, orientation, shading, outline etc. can be modified to help you build an effective powerpoint presentation. Any text can be entered at any point in the powerpoint template or slide. Simply DOWNLOAD, TYPE and PRESENT! These PowerPoint presentation slides can be used to represent themes relating to --Alone, apart, chasm, clipart, communication, concept, couple, crack, divide, divorce, estranged, female, figure, gap, gender, graphic, illustration, isolated, isolation, issues, loneliness, love, male, man, people, problems, romance, silhouette, stick, symbol, vector, woman-Life_Cycle_Charts_Technology_Adoption_Model_PowerPoint_templates

PowerPoint Slides On Crossing The Chasm Concept Ppt Presentation
PowerPoint_Slides_on_Crossing_the_Chasm_Concept_PPT_Presentation-These high quality powerpoint pre-designed slides and powerpoint templates have been carefully created by our professional team to help you impress your audience. All slides have been created and are 100% editable in powerpoint. Each and every property of any graphic - color, size, orientation, shading, outline etc. can be modified to help you build an effective powerpoint presentation. Any text can be entered at any point in the powerpoint template or slide. Simply DOWNLOAD, TYPE and PRESENT! These PowerPoint presentation slides can be used to represent themes relating to --Alone, apart, chasm, clipart, communication, concept, couple, crack, divide, divorce, estranged, female, figure, gap, gender, graphic, illustration, isolated, isolation, issues, loneliness, love, male, man, people, problems, romance, silhouette, stick, symbol, vector, woman-PowerPoint_Slides_on_Crossing_the_Chasm_Concept_PPT_Presentation

Technology Adoption Life Cycle Model PowerPoint Slides Download
Technology_Adoption_Life_Cycle_Model_PowerPoint_Slides_Download-These high quality powerpoint pre-designed slides and powerpoint templates have been carefully created by our professional team to help you impress your audience. All slides have been created and are 100% editable in powerpoint. Each and every property of any graphic - color, size, orientation, shading, outline etc. can be modified to help you build an effective powerpoint presentation. Any text can be entered at any point in the powerpoint template or slide. Simply DOWNLOAD, TYPE and PRESENT! These PowerPoint presentation slides can be used to represent themes relating to --Alone, apart, chasm, clipart, communication, concept, couple, crack, divide, divorce, estranged, female, figure, gap, gender, graphic, illustration, isolated, isolation, issues, loneliness, love, male, man, people, problems, romance, silhouette, stick, symbol, vector, woman-Technology_Adoption_Life_Cycle_Model_PowerPoint_Slides_Download

Technology Adoption Lifecycle Chart Table PowerPoint Ppt Slides
Technology_Adoption_LifeCycle_Chart_Table_PowerPoint_PPT_Slides-These high quality powerpoint pre-designed slides and powerpoint templates have been carefully created by our professional team to help you impress your audience. All slides have been created and are 100% editable in powerpoint. Each and every property of any graphic - color, size, orientation, shading, outline etc. can be modified to help you build an effective powerpoint presentation. Any text can be entered at any point in the powerpoint template or slide. Simply DOWNLOAD, TYPE and PRESENT! These PowerPoint presentation slides can be used to represent themes relating to --Alone, apart, chasm, clipart, communication, concept, couple, crack, divide, divorce, estranged, female, figure, gap, gender, graphic, illustration, isolated, isolation, issues, loneliness, love, male, man, people, problems, romance, silhouette, stick, symbol, vector, woman-Technology_Adoption_LifeCycle_Chart_Table_PowerPoint_PPT_Slides

Technology Adoption Model PowerPoint Slides Editable Ppt Templates
Technology_Adoption_Model_PowerPoint_Slides_Editable_PPT_templates-These high quality powerpoint pre-designed slides and powerpoint templates have been carefully created by our professional team to help you impress your audience. All slides have been created and are 100% editable in powerpoint. Each and every property of any graphic - color, size, orientation, shading, outline etc. can be modified to help you build an effective powerpoint presentation. Any text can be entered at any point in the powerpoint template or slide. Simply DOWNLOAD, TYPE and PRESENT! These PowerPoint presentation slides can be used to represent themes relating to --Alone, apart, chasm, clipart, communication, concept, couple, crack, divide, divorce, estranged, female, figure, gap, gender, graphic, illustration, isolated, isolation, issues, loneliness, love, male, man, people, problems, romance, silhouette, stick, symbol, vector, woman-Technology_Adoption_Model_PowerPoint_Slides_Editable_PPT_templates

Concentric Shapes Statistical Researches Ppt Business Plan Example PowerPoint Templates
We present our concentric shapes statistical researches ppt business plan example PowerPoint templates.Present our Business PowerPoint Templates because Our PowerPoint Templates and Slides are Clear and concise. Use them and dispel any doubts your team may have. Download and present our Shapes PowerPoint Templates because Our PowerPoint Templates and Slides will steer your racing mind. Hit the right buttons and spur on your audience. Use our Marketing PowerPoint Templates because Our PowerPoint Templates and Slides will give good value for money. They also have respect for the value of your time. Download our Process and Flows PowerPoint Templates because Our PowerPoint Templates and Slides are the chords of your song. String them along and provide the lilt to your views. Present our Flow Charts PowerPoint Templates because It will Raise the bar of your Thoughts. They are programmed to take you to the next level.Use these PowerPoint slides for presentations relating to Star, icon, event, shape, decoration, concept, sign, prize, success, holiday, bright, symbol, festive, graphic,decor, glare, glow, four, favorite, voting, season, object, decorative, shiny, winner, rating, metallic, web, design, quality, reward, award, shinning, single, jewel, beam, product, metal. The prominent colors used in the PowerPoint template are Black, Blue light, Gray.
Concentric Shapes Statistical Researches Ppt Business Plans Templates PowerPoint
We present our concentric shapes statistical researches ppt business plans templates PowerPoint.Download and present our Process and Flows PowerPoint Templates because Our PowerPoint Templates and Slides will embellish your thoughts. See them provide the desired motivation to your team. Present our Business PowerPoint Templates because Your success is our commitment. Our PowerPoint Templates and Slides will ensure you reach your goal. Present our Shapes PowerPoint Templates because You can Raise a toast with our PowerPoint Templates and Slides. Spread good cheer amongst your audience. Use our Flow Charts PowerPoint Templates because you should Experience excellence with our PowerPoint Templates and Slides. They will take your breath away. Present our Marketing PowerPoint Templates because Our PowerPoint Templates and Slides are conceived by a dedicated team. Use them and give form to your wondrous ideas.Use these PowerPoint slides for presentations relating to Star, icon, win, event, shape, decoration, concept, sign, prize, success, holiday, bright, symbol, festive, celebration, graphic,decor, glare, glow, four, favorite, voting, season, object, decorative, shiny, winner, rating, metallic, web, design, quality, reward, award, shinning, single, jewel, beam, product, metal. The prominent colors used in the PowerPoint template are Blue, Black, Gray.

Consulting Slides Bar Chart For Data Interpretation Business Presentation
This pre-designed and appealing bar chart for PowerPoint offer an optimized possibility to illustrate your business strategy. You can use this diagram for data interpretation. This diagram is editable and can be easily adjusted.

Business Diagram Diagram For Visual Data Display Presentation Template
Four colored cylindrical bars with percentage values are used to design this power point template. This diagram slide helps to display financial data analysis. Use this diagram for your business and finance related presentations.

Ppt Orange And Blue PowerPoint Template Puzzle Step Templates
PPT orange and blue powerpoint template puzzle step Templates-It is all there in bits and pieces. You can assemble and animate shapes. This way, you can use the idea of a jigsaw quickly and easily in your presentation. Use this Diagram to illustrate your method, piece by piece, and interlock the whole process in the minds of your audience.-PPT orange and blue powerpoint template puzzle step Templates-1, 2, 3, 4, 5, 6, abstract, alphabet, background, beginning, blue, calculations, childhood, colorful, count, cutout, design, easy, education, eight, elementary, figure, fun, green, indoor, isolated, knowledge, learn, letter, maths, nine, number, object, one, pieces, play, preschool, puzzle, scattered, step, still, studio, symbol, text, three, two, type, typeset, white, yellow
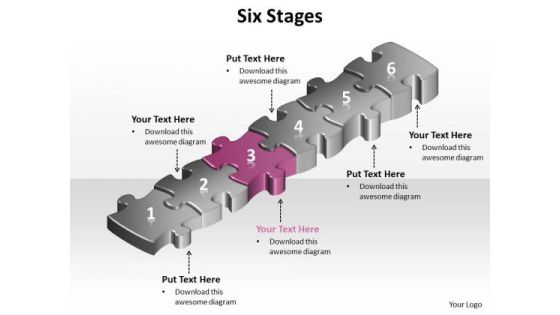
Ppt Pink Puzzle Step PowerPoint Presentation Tips Diagrams Templates
PPT pink puzzle step powerpoint presentation tips diagrams Templates-It is all there in bits and pieces. You can assemble and animate shapes. This way, you can use the idea of a jigsaw quickly and easily in your presentation. Use this Diagram to illustrate your method, piece by piece, and interlock the whole process in the minds of your audience. This is Represented by Pink Step.-PPT pink puzzle step powerpoint presentation tips diagrams Templates-1, 2, 3, 4, 5, 6, abstract, alphabet, background, beginning, blue, calculations, childhood, colorful, count, cutout, design, easy, education, eight, elementary, figure, fun, green, indoor, isolated, knowledge, learn, letter, maths, nine, number, object, one, pieces, play, preschool, puzzle, scattered, step, still, studio, symbol, text, three, two, type, typeset, white, yellow

3d Arrow Representing Stages Of Process Ppt Flow Chart Production PowerPoint Slides
We present our 3d arrow representing stages of process ppt flow chart production PowerPoint Slides. Use our Marketing PowerPoint Templates because, designed to help bullet-point your views and thoughts. Use our Business PowerPoint Templates because, Bullet-point your thoughts and ideas to profitably accomplish every step of every stage along the way. Use our Shapes PowerPoint Templates because, Ideas roll along in your mind like billiard balls. Use our Process and Flows PowerPoint Templates because; Use our templates to illustrate your ability. Use our Arrows PowerPoint Templates because, you are the star of your enlightened team. Use these PowerPoint slides for presentations relating to Arrows, business, career, cartoon, center, challenge, change, choice, concept, confusion, crossroads, decide, deciding, decision, directions, figure, idea, man, many, opportunity, paths, person, problem, question, risk, strategic, strategize, strategy, uncertain. The prominent colors used in the PowerPoint template are Pink, Black, and Gray

3d Arrows Depicting 8 Concepts Create Flow Charts PowerPoint Templates
We present our 3d arrows depicting 8 concepts create flow charts PowerPoint templates. Use our Marketing PowerPoint Templates because, Individual components well researched and understood in their place. Use our Business PowerPoint Templates because, are the triggers of our growth. Use our Shapes PowerPoint Templates because; educate your staff on the means to provide the required support for speedy recovery. Use our Process and Flows PowerPoint Templates because, Timelines Template:- Getting it done may not be enough. Use our Arrows PowerPoint Templates because, Brainstorming Light Bulbs: - The atmosphere in the workplace is electric. Use these PowerPoint slides for presentations relating to Arrows, business, career, cartoon, center, challenge, change, choice, concept, confusion, crossroads, decide, deciding, decision, directions, figure, idea, man, many, opportunity, paths, person, problem, question, risk, strategic, strategize, strategy, uncertain. The prominent colors used in the PowerPoint template are Green, Black, and Gray

Business Framework Project Management Data PowerPoint Presentation
This diagram displays push pull communication framework. This diagram may used to displays push pull strategy. Use this diagram in business presentations. This diagram will enhance the quality of your presentations.

Data Analysis Reports Under Magnifying Glass Ppt PowerPoint Presentation Icon Graphic Tips
Presenting this set of slides with name data analysis reports under magnifying glass ppt powerpoint presentation icon graphic tips. This is a three stage process. The stages in this process are data visualization icon, research analysis, business focus. This is a completely editable PowerPoint presentation and is available for immediate download. Download now and impress your audience.
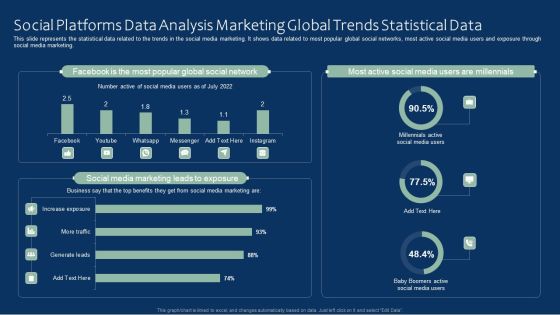
Social Platforms Data Analysis Marketing Global Trends Statistical Data Rules PDF
This slide represents the statistical data related to the trends in the social media marketing. It shows data related to most popular global social networks, most active social media users and exposure through social media marketing. Pitch your topic with ease and precision using this Social Platforms Data Analysis Marketing Global Trends Statistical Data Rules PDF. This layout presents information on Social Platforms Data Analysis, Marketing Global, Trends Statistical Data. It is also available for immediate download and adjustment. So, changes can be made in the color, design, graphics or any other component to create a unique layout.
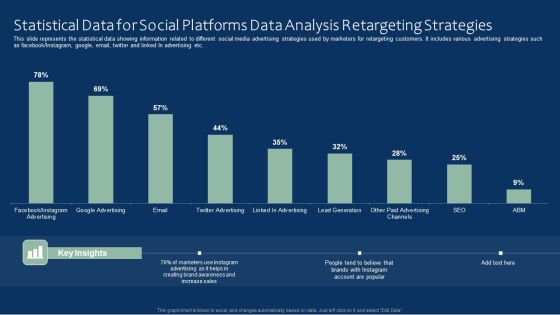
Statistical Data For Social Platforms Data Analysis Retargeting Strategies Inspiration PDF
This slide represents the statistical data showing information related to different social media advertising strategies used by marketers for retargeting customers. It includes various advertising strategies such as facebook or Instagram, google, email, twitter and linked In advertising etc. Showcasing this set of slides titled Statistical Data For Social Platforms Data Analysis Retargeting Strategies Inspiration PDF. The topics addressed in these templates are Social Platforms Data, Statistical Data, Analysis Retargeting Strategies. All the content presented in this PPT design is completely editable. Download it and make adjustments in color, background, font etc. as per your unique business setting.

Gaps In Business Strategy Chasm PowerPoint Slides Ppt Templates
Gaps in Business Strategy Chasm PowerPoint Slides PPT templates-These high quality powerpoint pre-designed slides and powerpoint templates have been carefully created by our professional team to help you impress your audience. All slides have been created and are 100% editable in powerpoint. Each and every property of any graphic - color, size, orientation, shading, outline etc. can be modified to help you build an effective powerpoint presentation. Any text can be entered at any point in the powerpoint template or slide. Simply DOWNLOAD, TYPE and PRESENT! These PowerPoint presentation slides can be used to represent themes relating to --Alone, apart, chasm, clipart, communication, concept, couple, crack, divide, divorce, estranged, female, figure, gap, gender, graphic, illustration, isolated, isolation, issues, loneliness, love, male, man, people, problems, romance, silhouette, stick, symbol, vector, woman
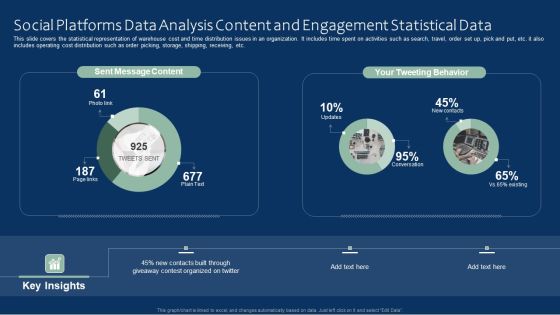
Social Platforms Data Analysis Content And Engagement Statistical Data Microsoft PDF
This slide covers the statistical representation of warehouse cost and time distribution issues in an organization. It includes time spent on activities such as search, travel, order set up, pick and put, etc. it also includes operating cost distribution such as order picking, storage, shipping, receiving, etc. Showcasing this set of slides titled Social Platforms Data Analysis Content And Engagement Statistical Data Microsoft PDF. The topics addressed in these templates are Social Platforms Data, Analysis Content, Engagement Statistical Data. All the content presented in this PPT design is completely editable. Download it and make adjustments in color, background, font etc. as per your unique business setting.
Statistical Data On Social Platforms Data Analysis Services Offered By Marketing Agencies Icons PDF
This slide shows the statistics related to social media services provided by the marketing agencies to their clients. It includes various services such as content creation, social media monitoring, strategy building, campaign analysis etc. Pitch your topic with ease and precision using this Statistical Data On Social Platforms Data Analysis Services Offered By Marketing Agencies Icons PDF. This layout presents information on Statistical Data, Social Platforms Data, Analysis Services, Marketing Agencies. It is also available for immediate download and adjustment. So, changes can be made in the color, design, graphics or any other component to create a unique layout.

Data Valuation And Monetization Statistics Related To Power Of Data Designs PDF
This slide provides information about key statistics related to effective utilization of data that leads to annual increase in revenues, reduction in operational costs, better decision making. Deliver an awe inspiring pitch with this creative Data Valuation And Monetization Statistics Related To Power Of Data Designs PDF bundle. Topics like Firms Annual, Revenues Increased, Reduce Operational can be discussed with this completely editable template. It is available for immediate download depending on the needs and requirements of the user.

Eight Stages Of Pie Chart Data Interpretation Detailed Business Plan PowerPoint Templates
We present our eight stages of pie chart data interpretation detailed business plan PowerPoint templates.Download and present our Competition PowerPoint Templates because You can Stir your ideas in the cauldron of our PowerPoint Templates and Slides. Cast a magic spell on your audience. Download and present our Marketing PowerPoint Templates because You should Kick up a storm with our PowerPoint Templates and Slides. The heads of your listeners will swirl with your ideas. Download and present our Arrows PowerPoint Templates because Your ideas provide food for thought. Our PowerPoint Templates and Slides will help you create a dish to tickle the most discerning palate. Present our Circle Charts PowerPoint Templates because You can Stir your ideas in the cauldron of our PowerPoint Templates and Slides. Cast a magic spell on your audience. Download our Business PowerPoint Templates because You can Score a slam dunk with our PowerPoint Templates and Slides. Watch your audience hang onto your every word.Use these PowerPoint slides for presentations relating to chart, graph, pie, 3d, diagram, graphic, icon, control, business, data, profit, market, sales, display, corporate, concept, render, success, presentation, finance, report, marketing, accounting, management, piece, strategy, money, growth, company, competition, progress, account, sheet, part, information, investment, improvement, banking, index, financial, reflect, results, performance, exchange. The prominent colors used in the PowerPoint template are Blue, Black, Gray.

Templates Download Statistics Business Plan For Small PowerPoint Slides
We present our templates download statistics business plan for small PowerPoint Slides.Download our Process and Flows PowerPoint Templates because Our PowerPoint Templates and Slides will give you great value for your money. Be assured of finding the best projection to highlight your words. Present our Circle Charts PowerPoint Templates because You should Press the right buttons with our PowerPoint Templates and Slides. They will take your ideas down the perfect channel. Download our Shapes PowerPoint Templates because It will get your audience in sync. Download our Business PowerPoint Templates because You will get more than you ever bargained for. Download and present our Marketing PowerPoint Templates because Our PowerPoint Templates and Slides are focused like a searchlight beam. They highlight your ideas for your target audience.Use these PowerPoint slides for presentations relating to Infographic, graph, chart, data, icon, diagram, progress, bar, line, download, button, pie, search, time, statistics, percent, segment, cloud, business, concept, sign,loading, symbol, template, circle, graphic, full, element, report, level, black, shape, computer, modern, status, visualization, round, section, web,design, statistics, growth, colorful, info, stats, information, indicator. The prominent colors used in the PowerPoint template are Green, Gray, Black.

Website Visitors Data Marketing Research Services Management Business Download Pdf
The following slide highlights the companys audience demographics distribution based on people age and gender to make business strategy for target market. Want to ace your presentation in front of a live audience Our Website Visitors Data Marketing Research Services Management Business Download Pdf can help you do that by engaging all the users towards you. Slidegeeks experts have put their efforts and expertise into creating these impeccable powerpoint presentations so that you can communicate your ideas clearly. Moreover, all the templates are customizable, and easy-to-edit and downloadable. Use these for both personal and commercial use.

Infographic For Data Analysis Powerpoint Templates
This PowerPoint slide has been designed with process infographic. This PPT diagram may be used to display evaluation of business process. This diagram slide can be used to make impressive presentations.

Data Processing Mainframe Structure Vector Icon Ppt PowerPoint Presentation Model Files PDF
Pitch your topic with ease and precision using this data processing mainframe structure vector icon ppt powerpoint presentation model files pdf. This layout presents information on data processing mainframe structure vector icon. It is also available for immediate download and adjustment. So, changes can be made in the color, design, graphics or any other component to create a unique layout.
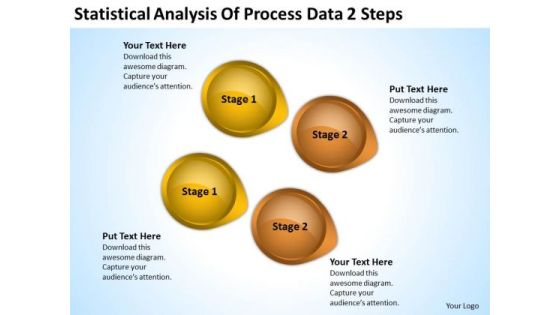
Power Point Arrows Statistical Analysis Of Process Data 2 Steps PowerPoint Templates
We present our power point arrows statistical analysis of process data 2 steps PowerPoint templates.Download and present our Business PowerPoint Templates because It is Aesthetically crafted by artistic young minds. Our PowerPoint Templates and Slides are designed to display your dexterity. Present our Arrows PowerPoint Templates because You can Rise to the occasion with our PowerPoint Templates and Slides. You will bring your audience on their feet in no time. Download and present our Circle Charts PowerPoint Templates because Our PowerPoint Templates and Slides help you pinpoint your timelines. Highlight the reasons for your deadlines with their use. Present our Shapes PowerPoint Templates because You aspire to touch the sky with glory. Let our PowerPoint Templates and Slides provide the fuel for your ascent. Present our Symbol PowerPoint Templates because You have gained great respect for your brilliant ideas. Use our PowerPoint Templates and Slides to strengthen and enhance your reputation.Use these PowerPoint slides for presentations relating to abstract, arrow, art, background, banner, blue, bright, business, circle, color, colorful, concept, conceptual, connection, creative, cycle, design, different, element, empty, flower, form, frame, graphic, green, group, idea, illustration, match, message, order, part, petal, piece, place, red, ring, shape, solution, special, speech, strategy, symbol, template, text, usable, vector, web, website. The prominent colors used in the PowerPoint template are Yellow, Brown, Black. People tell us our power point arrows statistical analysis of process data 2 steps PowerPoint templates will impress their bosses and teams. People tell us our circle PowerPoint templates and PPT Slides are designed by professionals Presenters tell us our power point arrows statistical analysis of process data 2 steps PowerPoint templates are second to none. We assure you our banner PowerPoint templates and PPT Slides will make the presenter successul in his career/life. Presenters tell us our power point arrows statistical analysis of process data 2 steps PowerPoint templates will help you be quick off the draw. Just enter your specific text and see your points hit home. Professionals tell us our background PowerPoint templates and PPT Slides will make the presenter look like a pro even if they are not computer savvy.

Data Monetization Approach To Drive Business Growth Statistics Related To Power Of Data Brochure PDF
This slide provides information about key statistics related to effective utilization of data that leads to annual increase in revenues, reduction in operational costs, better decision making. The best PPT templates are a great way to save time, energy, and resources. Slidegeeks have 100 percent editable powerpoint slides making them incredibly versatile. With these quality presentation templates, you can create a captivating and memorable presentation by combining visually appealing slides and effectively communicating your message. Download Data Monetization Approach To Drive Business Growth Statistics Related To Power Of Data Brochure PDF from Slidegeeks and deliver a wonderful presentation.

Data Monetization And Management Statistics Related To Power Of Data Diagrams PDF
This slide provides information about key statistics related to effective utilization of data that leads to annual increase in revenues, reduction in operational costs, better decision making. Find a pre-designed and impeccable Data Monetization And Management Statistics Related To Power Of Data Diagrams PDF. The templates can ace your presentation without additional effort. You can download these easy-to-edit presentation templates to make your presentation stand out from others. So, what are you waiting for Download the template from Slidegeeks today and give a unique touch to your presentation.
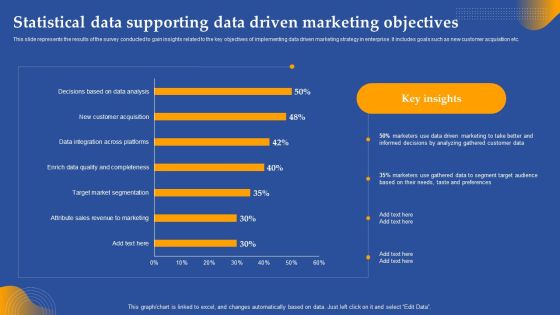
Statistical Data Supporting Data Driven Marketing Objectives Ppt Gallery Graphics Tutorials PDF
This slide represents the results of the survey conducted to gain insights related to the key objectives of implementing data driven marketing strategy in enterprise. It includes goals such as new customer acquisition etc. Whether you have daily or monthly meetings, a brilliant presentation is necessary. Statistical Data Supporting Data Driven Marketing Objectives Ppt Gallery Graphics Tutorials PDF can be your best option for delivering a presentation. Represent everything in detail using Statistical Data Supporting Data Driven Marketing Objectives Ppt Gallery Graphics Tutorials PDF and make yourself stand out in meetings. The template is versatile and follows a structure that will cater to your requirements. All the templates prepared by Slidegeeks are easy to download and edit. Our research experts have taken care of the corporate themes as well. So, give it a try and see the results.

Statistical Data Supporting Data Driven Marketing Objectives Ppt Inspiration Graphics Pictures PDF
This slide represents the results of the survey conducted to gain insights related to the key objectives of implementing data driven marketing strategy in enterprise. It includes goals such as new customer acquisition etc. Whether you have daily or monthly meetings, a brilliant presentation is necessary. Statistical Data Supporting Data Driven Marketing Objectives Ppt Inspiration Graphics Pictures PDF can be your best option for delivering a presentation. Represent everything in detail using Statistical Data Supporting Data Driven Marketing Objectives Ppt Inspiration Graphics Pictures PDF and make yourself stand out in meetings. The template is versatile and follows a structure that will cater to your requirements. All the templates prepared by Slidegeeks are easy to download and edit. Our research experts have taken care of the corporate themes as well. So, give it a try and see the results.
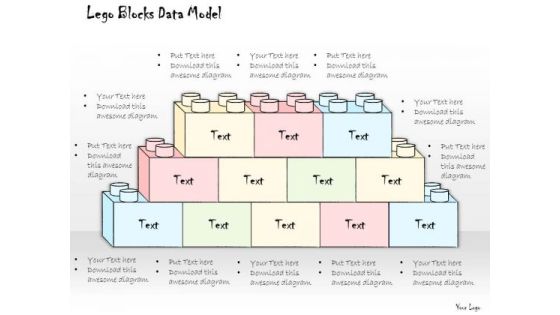
Ppt Slide Lego Blocks Data Model Consulting Firms
Our PPT Slide Lego Blocks Data Model Consulting Firms Powerpoint Templates Enjoy Drama. They Provide Entertaining Backdrops. Our Consulting Firms Powerpoint Templates Help To Make A Draft. They Give You A Good Place To Start.
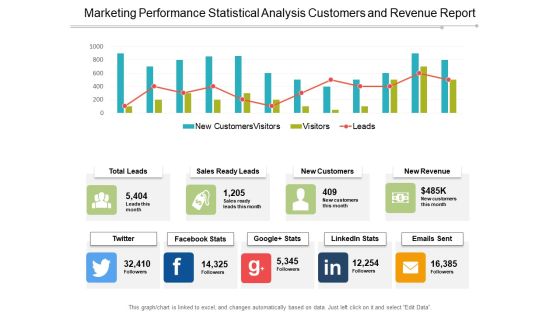
Marketing Performance Statistical Analysis Customers And Revenue Report Ppt PowerPoint Presentation Outline Shapes
This is a marketing performance statistical analysis customers and revenue report ppt powerpoint presentation outline shapes. This is a four stage process. The stages in this process are marketing analytics, marketing performance, marketing discovery.

Identifying Employees For Potential Insider Threat Icon Portrait PDF
Presenting Identifying Employees For Potential Insider Threat Icon Portrait PDF to dispense important information. This template comprises three stages. It also presents valuable insights into the topics including Identifying Employees, Potential Insider, Threat Icon. This is a completely customizable PowerPoint theme that can be put to use immediately. So, download it and address the topic impactfully.

Comprehensive Customer Data Platform Guide Optimizing Promotional Initiatives Statistics Highlighting Customer Data Template PDF
The following slide showcases the key trends of customer data platform industry to evaluate the rising demand of first party data. It includes elements such as industry revenue, software market growth, B2B and B2C customers, market size etc. Present like a pro with Comprehensive Customer Data Platform Guide Optimizing Promotional Initiatives Statistics Highlighting Customer Data Template PDF Create beautiful presentations together with your team, using our easy to use presentation slides. Share your ideas in real time and make changes on the fly by downloading our templates. So whether you are in the office, on the go, or in a remote location, you can stay in sync with your team and present your ideas with confidence. With Slidegeeks presentation got a whole lot easier. Grab these presentations today.

Statistics Results Ppt PowerPoint Presentation Summary Example
This is a statistics results ppt powerpoint presentation summary example. This is a two stage process. The stages in this process are finance, media, data, assets, funding.

Business Diagram 3d Pie Chart With Arrows For Data Representation PowerPoint Slide
This business slide displays pie chart with timeline graphics. This diagram has been designed with graphic of with four arrows representing yearly data. Use this diagram, in your presentations to display process steps, stages, for business management.
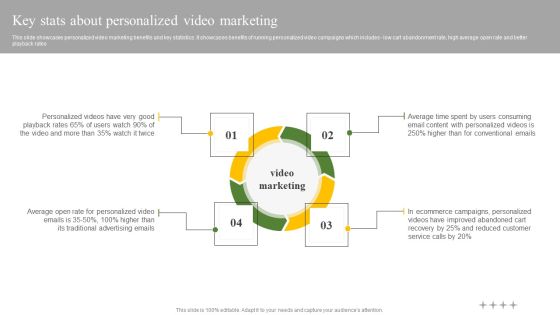
Key Stats About Personalized Video Marketing Ppt Outline Examples PDF
This slide showcases personalized video marketing benefits and key statistics. It showcases benefits of running personalized video campaigns which includes - low cart abandonment rate, high average open rate and better playback rates. There are so many reasons you need a Key Stats About Personalized Video Marketing Ppt Outline Examples PDF. The first reason is you can not spend time making everything from scratch, Thus, Slidegeeks has made presentation templates for you too. You can easily download these templates from our website easily.
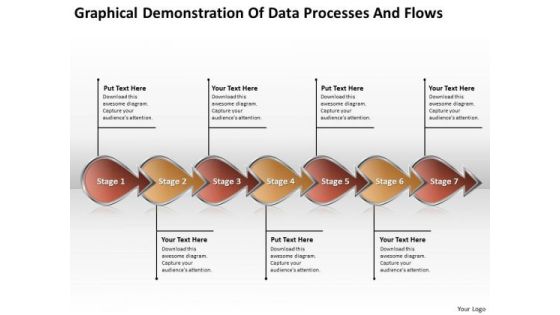
Graphical Demonstration Of Data Processes And Flows Circuit Drawing PowerPoint Slides
We present our graphical demonstration of data processes and flows circuit drawing PowerPoint Slides.Use our Arrows PowerPoint Templates because you can outline your targets to your team. Present our Business PowerPoint Templates because you can Lead your flock steadily to greater heights. Look around at the vast potential of achievement around you. Download our Shapes PowerPoint Templates because our PowerPoint templates designed for your ideas to sell. Download our Marketing PowerPoint Templates because networking is an imperative in todays world. You need to access the views of others. Similarly you need to give access to them of your abilities. Download our Process and Flows PowerPoint Templates because you can Churn the wheels of the brains of your colleagues.Use these PowerPoint slides for presentations relating to Arrow, Arrows, Block, Business, Chart, Design, Development, Diagram, Direction, Element, Flow, Flowchart, Graph, Linear, Management, Organization, Process, Program, Section, Sign, Solution, Symbol. The prominent colors used in the PowerPoint template are Red, Yellow, Black. Customers tell us our graphical demonstration of data processes and flows circuit drawing PowerPoint Slides are Stunning. The feedback we get is that our Development PowerPoint templates and PPT Slides are Royal. Professionals tell us our graphical demonstration of data processes and flows circuit drawing PowerPoint Slides are Sparkling. People tell us our Design PowerPoint templates and PPT Slides are Amazing. Customers tell us our graphical demonstration of data processes and flows circuit drawing PowerPoint Slides are Lush. Professionals tell us our Development PowerPoint templates and PPT Slides are Pleasant.
