Executive Summary Dashboard

KPI Dashboard To Measure Workforce Increase Ppt Slides Elements PDF
This slide shows dashboard which can be used to present the workforce increase in the organization. It includes metrics such as gender wise headcount, department wise headcount, etc. Showcasing this set of slides titled KPI Dashboard To Measure Workforce Increase Ppt Slides Elements PDF. The topics addressed in these templates are Employees Salary, Headcount, Gender Wise, Headcount Increase. All the content presented in this PPT design is completely editable. Download it and make adjustments in color, background, font etc. as per your unique business setting.
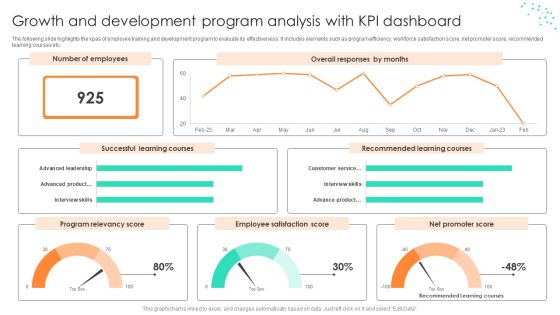
Growth And Development Program Analysis With KPI Dashboard Structure PDF
The following slide highlights the kpas of employee training and development program to evaluate its effectiveness. It includes elements such as program efficiency, workforce satisfaction score, net promoter score, recommended learning courses etc. Pitch your topic with ease and precision using this Growth And Development Program Analysis With KPI Dashboard Structure PDF. This layout presents information on Analysis With KPI Dashboard, Growth And Development Program. It is also available for immediate download and adjustment. So, changes can be made in the color, design, graphics or any other component to create a unique layout.

Dashboard Showcasing Project Management And Service Delivery Status Demonstration PDF
This slide represents dashboard which shows project management with delivery status that helps track progress and drive efficiency. It provides information regarding project budget, overdue tasks and delivery dates. Showcasing this set of slides titled Dashboard Showcasing Project Management And Service Delivery Status Demonstration PDF. The topics addressed in these templates are Planning Phase, Product Designing, Development Stage, Inspection. All the content presented in this PPT design is completely editable. Download it and make adjustments in color, background, font etc. as per your unique business setting.

Financial Position Evaluation Dashboard With Operating Profit Margin Elements PDF
This slide shows the financial statement analysis dashboard of organization. It covers various KPIs such as OPEX Ratio, operating profit margin, gross profit margin, net profit margin, etc. Pitch your topic with ease and precision using this Financial Position Evaluation Dashboard With Operating Profit Margin Elements PDF. This layout presents information on Income Statement, Revenue, Operating Profit, Net Profit. It is also available for immediate download and adjustment. So, changes can be made in the color, design, graphics or any other component to create a unique layout.
Leads Tracking Dashboard With Conversion Funnel Ideas PDF
This slide showcases dashboard that can help organization to identify the total number of customers acquired from the sales and marketing qualified lead. It also showcases financial KPIs that are cost per lead, cost per customer, customer lifetine value and return on marketing investment. Pitch your topic with ease and precision using this Leads Tracking Dashboard With Conversion Funnel Ideas PDF. This layout presents information on Audience, Prospects, Conversion Funnel. It is also available for immediate download and adjustment. So, changes can be made in the color, design, graphics or any other component to create a unique layout.
Digital Marketing Dashboard For Tracking Lead Generation Guidelines PDF
This slide showcases dashboard for digital marketing that can help organization track the monthly leads generated and performance of online marketing campaigns. Its key components are lead breakdown, total lead by program, web traffic targets, key conversion metrics, trial leads by region, total social media channels and key conversion metrics. Showcasing this set of slides titled Digital Marketing Dashboard For Tracking Lead Generation Guidelines PDF. The topics addressed in these templates are Lead By Program, Lead Breakdown, Key Conversion Metrics. All the content presented in this PPT design is completely editable. Download it and make adjustments in color, background, font etc. as per your unique business setting.
Project Performance Dashboard With Tracking And Control Phase Background PDF
Following slide exhibits project performance dashboard with monitoring and control phase which can be used by project managers to review the overall project. It includes metrics like project cost performance, project performance, time vs project phase and percentage of project phase completed. Pitch your topic with ease and precision using this Project Performance Dashboard With Tracking And Control Phase Background PDF This layout presents information on Earned Value, Project Cost Performance, Project Performance. It is also available for immediate download and adjustment. So, changes can be made in the color, design, graphics or any other component to create a unique layout.

Project Metrics Dashboard Depicting Weekly Schedule Graphics PDF
This slide focuses on project management dashboard which shows the activities scheduled for one month such as demo task for resource management, meeting regarding onboarding process, long term support for personnel, weekly meetups, to do list for next month, etc. Showcasing this set of slides titled Project Metrics Dashboard Depicting Weekly Schedule Graphics PDF. The topics addressed in these templates are Equipment, Sales Activity, Resource. All the content presented in this PPT design is completely editable. Download it and make adjustments in color, background, font etc. as per your unique business setting.

Logistics Management Dashboard With Predicted Order Delays Slides PDF
This slide outlines dashboard of shipping statistics that can help organization to identify shipments in transit and track them to ensure timely delivery of orders. It also showcases KPIs which are delivery attempts, delivery rate and order pickup rate. Showcasing this set of slides titled Logistics Management Dashboard With Predicted Order Delays Slides PDF. The topics addressed in these templates are Warehouse Transit, Shipment Statistics, Failed Deliveries. All the content presented in this PPT design is completely editable. Download it and make adjustments in color, background, font etc. as per your unique business setting.

Vehicle Maintenance Dashboard Indicating Trips And Compliances Structure PDF
This slide showcases dashboard which can help fleet managers in carefully monitoring their vehicle status. It provides details about vehicle conditions, free vehicles, moving vehicles, insurance, permit, license validity, trip alerts, etc. Here you can discover an assortment of the finest PowerPoint and Google Slides templates. With these templates, you can create presentations for a variety of purposes while simultaneously providing your audience with an eye-catching visual experience. Download Vehicle Maintenance Dashboard Indicating Trips And Compliances Structure PDF to deliver an impeccable presentation. These templates will make your job of preparing presentations much quicker, yet still, maintain a high level of quality. Slidegeeks has experienced researchers who prepare these templates and write high-quality content for you. Later on, you can personalize the content by editing the Vehicle Maintenance Dashboard Indicating Trips And Compliances Structure PDF.

KPI Dashboard To Assess Impact Of Employee Training Brochure PDF
This slide covers KPI dashboard to assess training program effectiveness. It involves details such as overall responses on monthly basis, employee satisfaction rate, net promoter score and major training courses. Showcasing this set of slides titled KPI Dashboard To Assess Impact Of Employee Training Brochure PDF. The topics addressed in these templates are Major Training Course, Major Satisfactory Training Course, Major Recommended Training Course . All the content presented in this PPT design is completely editable. Download it and make adjustments in color, background, font etc. as per your unique business setting.
Instagram Influencer Marketing Campaign Dashboard Ppt Icon Slide PDF
This slide represents key metrics dashboard to track and measure progress of Instagram influencer marketing campaign. It includes details related to KPIs such as impressions, likes, engagement rates etc. Explore a selection of the finest Instagram Influencer Marketing Campaign Dashboard Ppt Icon Slide PDF here. With a plethora of professionally designed and pre made slide templates, you can quickly and easily find the right one for your upcoming presentation. You can use our Instagram Influencer Marketing Campaign Dashboard Ppt Icon Slide PDF to effectively convey your message to a wider audience. Slidegeeks has done a lot of research before preparing these presentation templates. The content can be personalized and the slides are highly editable. Grab templates today from Slidegeeks.

KPI Dashboard Highlighting Results Of SEO Campaign Topics PDF
The following slide showcases marketing KPI dashboard which shows the performance measuring metrics of SEO campaign. The metrics covered in the slide are most viewed pages from SEO, most search engines used, traffic type, top known keywords etc. Pitch your topic with ease and precision using this KPI Dashboard Highlighting Results Of SEO Campaign Topics PDF. This layout presents information on Search Engines, Traffic, Organic. It is also available for immediate download and adjustment. So, changes can be made in the color, design, graphics or any other component to create a unique layout.

Revenue And Customer Acquisition Analysis Strategic Administration Dashboard Clipart PDF
This slide shows the dashboard representing analysis of the revenue and customers acquired by the organization. It shows comparison between current and previous year revenue and customer acquisition.Pitch your topic with ease and precision using this Revenue And Customer Acquisition Analysis Strategic Administration Dashboard Clipart PDF This layout presents information on Revenue Customer, Compared Previous, Customer Acquisition It is also available for immediate download and adjustment. So, changes can be made in the color, design, graphics or any other component to create a unique layout.
Gross Profit Margin Dashboard With Revenue Vs Expenses Icons PDF
This slide showcases dashboard that can help organization to evaluate the revenue generated and expenses incurred in conducting operations. It also showcases gross profit and margin of last financial year. Pitch your topic with ease and precision using this Gross Profit Margin Dashboard With Revenue Vs Expenses Icons PDF. This layout presents information on Gross Profit Margin, EBITDA Margin, Net Profit Margin. It is also available for immediate download and adjustment. So, changes can be made in the color, design, graphics or any other component to create a unique layout.
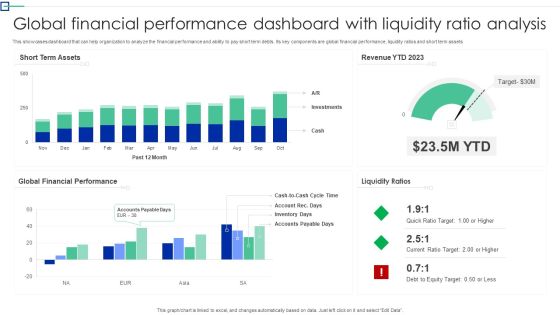
Global Financial Performance Dashboard With Liquidity Ratio Analysis Information PDF
This showcases dashboard that can help organization to analyze the financial performance and ability to pay short term debts. Its key components are global financial performance, liquidity ratios and short term assets. Pitch your topic with ease and precision using this Global Financial Performance Dashboard With Liquidity Ratio Analysis Information PDF. This layout presents information on Short Term Assets, Global Financial Performance, Liquidity Ratios. It is also available for immediate download and adjustment. So, changes can be made in the color, design, graphics or any other component to create a unique layout.

Sales Monitoring Dashboard With Monthly Qualified Leads Guidelines PDF
This slide showcases dashboard that can help organization to monitor the sales pipeline velocity and predict future sales more accurately plus increase the leads converted. Its key components are monthly qualified leads, win rate based on deal size, monthly sales cycle and number of leads at each stage of pipeline. Pitch your topic with ease and precision using this Sales Monitoring Dashboard With Monthly Qualified Leads Guidelines PDF. This layout presents information on Monthly Qualified, Monthly Sales Cycle, Deal Size. It is also available for immediate download and adjustment. So, changes can be made in the color, design, graphics or any other component to create a unique layout.
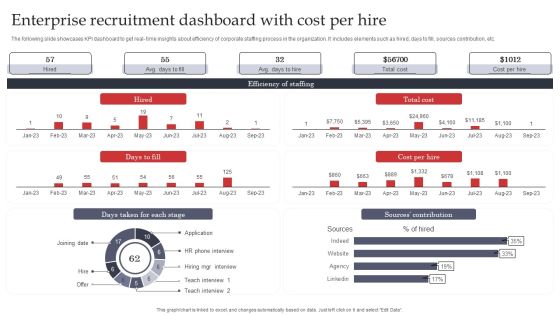
Enterprise Recruitment Dashboard With Cost Per Hire Graphics PDF
The following slide showcases KPI dashboard to get real- time insights about efficiency of corporate staffing process in the organization. It includes elements such as hired, days to fill, sources contribution, etc. Pitch your topic with ease and precision using this Enterprise Recruitment Dashboard With Cost Per Hire Graphics PDF. This layout presents information on Enterprise, Contribution, Cost. It is also available for immediate download and adjustment. So, changes can be made in the color, design, graphics or any other component to create a unique layout.

Customer Attrition In A Bpo Dashboard Ppt Model Ideas PDF
Deliver and pitch your topic in the best possible manner with this customer attrition in a bpo dashboard ppt model ideas pdf. Use them to share invaluable insights on telecom churn overview metrics, customer care call performance, monthly revenue lost and impress your audience. This template can be altered and modified as per your expectations. So, grab it now.
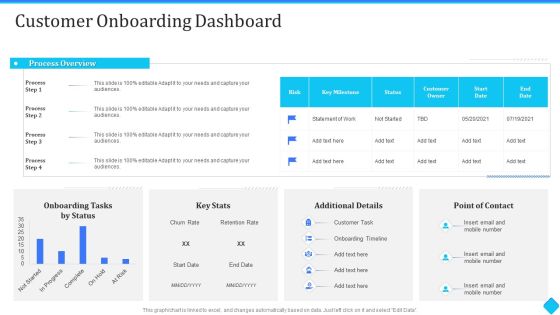
User Onboarding Process Development Customer Onboarding Dashboard Background PDF
Deliver and pitch your topic in the best possible manner with this User Onboarding Process Development Customer Onboarding Dashboard Background PDF. Use them to share invaluable insights on customer owner, onboarding timeline, process overview and impress your audience. This template can be altered and modified as per your expectations. So, grab it now.

Project Metrics Dashboard For Software Development Designs PDF
This slide shows the project management dashboard for developing software which focuses on health status such as time, cost, workload, risks, issues and changes with comparison of actual and planned expenses with budget. It also shows the risks, issues ad changes. Pitch your topic with ease and precision using this Project Metrics Dashboard For Software Development Designs PDF. This layout presents information on Risks, Budget, Cost. It is also available for immediate download and adjustment. So, changes can be made in the color, design, graphics or any other component to create a unique layout.
Enterprise Recruitment Dashboard With Shortlisted And Hired Candidates Icons PDF
The following slide showcases dashboard to track status of corporate staffing activities in organization for HR department. It includes KPIs such as total applicants, time and cost to hire, applicant details, etc. Showcasing this set of slides titled Enterprise Recruitment Dashboard With Shortlisted And Hired Candidates Icons PDF. The topics addressed in these templates are Shortlisted candidates, Hired Candidates, Rejected Candidates. All the content presented in this PPT design is completely editable. Download it and make adjustments in color, background, font etc. as per your unique business setting.

Investment Project KPI Dashboard For Construction Analytics Background PDF
This slide illustrates construction dashboard for improving capital project outcomes. It also include KPIs such as projects completion, schedule performance index, consumer price index, project status, cost breakdown, etc. Pitch your topic with ease and precision using this Investment Project KPI Dashboard For Construction Analytics Background PDF. This layout presents information on Cost Breakdown, Completion, Progress. It is also available for immediate download and adjustment. So, changes can be made in the color, design, graphics or any other component to create a unique layout.

Infrastructure Expansion KPI Dashboard For Investment Project Management Inspiration PDF
This slide covers management dashboard for analyzing the project performance and progress. It include KPIs such as total claims to date, total costs to date, project status, profits, number of days left, etc. Showcasing this set of slides titled Infrastructure Expansion KPI Dashboard For Investment Project Management Inspiration PDF. The topics addressed in these templates are Claims And Costs, Project Status, Profits. All the content presented in this PPT design is completely editable. Download it and make adjustments in color, background, font etc. as per your unique business setting.

Key Performance Indicator Dashboard For Transportation Management Formats PDF
The following slide highlights key performance indicator dashboard for transportation management illustrating transportation cost, effectiveness, utilization and quality for last month and current month in America, Europe and Asia, it considers delivery and return cost, packing productivity and time, packing material cost and equipment utilization. Showcasing this set of slides titled Key Performance Indicator Dashboard For Transportation Management Formats PDF. The topics addressed in these templates are Transportation Cost, Effectiveness, Utilization, Quality. All the content presented in this PPT design is completely editable. Download it and make adjustments in color, background, font etc. as per your unique business setting.

Investment Project KPI Dashboard For Construction Quality Management Pictures PDF
This slide showcases KPI dashboard for keeping track of construction project quality. It include KPIs such as NCRs by status, standard operating procedures, site inspection details, product quality rating, quality training, etc. Showcasing this set of slides titled Investment Project KPI Dashboard For Construction Quality Management Pictures PDF. The topics addressed in these templates are Product Quality Rating, Standard Operating Procedures, Quality Training. All the content presented in this PPT design is completely editable. Download it and make adjustments in color, background, font etc. as per your unique business setting.

Dashboard To Track Overall IT Cost Ppt Background Designs PDF
This slide provides information regarding IT cost management dashboard to track IT costs breakdown, return on investment, budget monitoring, etc. Boost your pitch with our creative Dashboard To Track Overall IT Cost Ppt Background Designs PDF. Deliver an awe-inspiring pitch that will mesmerize everyone. Using these presentation templates you will surely catch everyones attention. You can browse the ppts collection on our website. We have researchers who are experts at creating the right content for the templates. So you do not have to invest time in any additional work. Just grab the template now and use them.

Dashboard To Track Online Brand Marketing Campaigns Guidelines PDF
This slide showcases dashboard that can help organization to track the results of online brand marketing campaigns. Its key elements are leads breakdown,web traffic, lead to trial, organic search, website traffic, web users etc. From laying roadmaps to briefing everything in detail, our templates are perfect for you. You can set the stage with your presentation slides. All you have to do is download these easy to edit and customizable templates. Dashboard To Track Online Brand Marketing Campaigns Guidelines PDF will help you deliver an outstanding performance that everyone would remember and praise you for. Do download this presentation today.
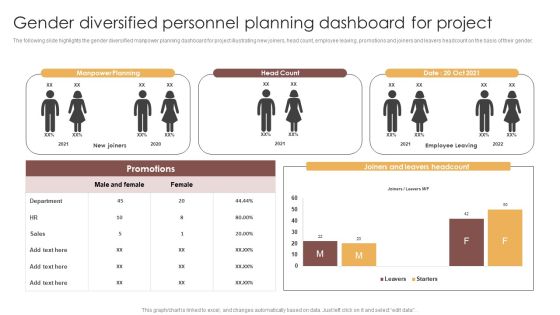
Gender Diversified Personnel Planning Dashboard For Project Ideas PDF
The following slide highlights the gender diversified manpower planning dashboard for project illustrating new joiners, head count, employee leaving, promotions and joiners and leavers headcount on the basis of their gender. Showcasing this set of slides titled Gender Diversified Personnel Planning Dashboard For Project Ideas PDF. The topics addressed in these templates are Manpower Planning, Head Count, Joiners And Leavers Headcount. All the content presented in this PPT design is completely editable. Download it and make adjustments in color, background, font etc. as per your unique business setting.
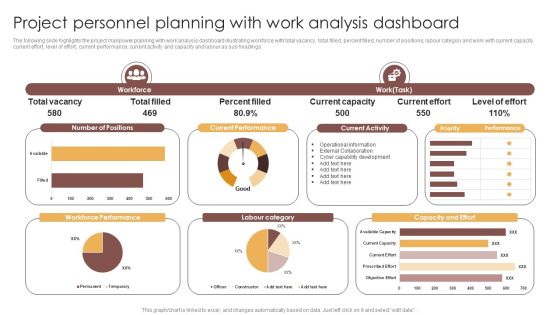
Project Personnel Planning With Work Analysis Dashboard Information PDF
The following slide highlights the project manpower planning with work analysis dashboard illustrating workforce with total vacancy, total filled, percent filled, number of positions, labour category and work with current capacity, current effort, level of effort, current performance, current activity and capacity and labour as sub headings. Showcasing this set of slides titled Project Personnel Planning With Work Analysis Dashboard Information PDF. The topics addressed in these templates are Number Of Positions, Current Performance, Current Activity, Labour Category. All the content presented in this PPT design is completely editable. Download it and make adjustments in color, background, font etc. as per your unique business setting.

Email Marketing KPI Dashboard With Bounce Rate Demonstration PDF
The following slide showcases KPI dashboard which allows marketers to track the email marketing campaign performance. Information covered in this slide is related to total subscribers, types of email sent, open, clicks, bounces and unsubscribed etc. Showcasing this set of slides titled Email Marketing KPI Dashboard With Bounce Rate Demonstration PDF. The topics addressed in these templates are Organic, Paid, Information. All the content presented in this PPT design is completely editable. Download it and make adjustments in color, background, font etc. as per your unique business setting

Dashboard For Business To Business Market Division Inspiration PDF
This slide illustrates the market segmentation dashboard for B2B which can benefit them to improve the focus and boost the revenue of the organization. It includes the Division according to industries and company size. Showcasing this set of slides titled Dashboard For Business To Business Market Division Inspiration PDF. The topics addressed in these templates are Industries, Service, Automobiles. All the content presented in this PPT design is completely editable. Download it and make adjustments in color, background, font etc. as per your unique business setting.
Weekly Tracking Dashboard For Social Media Content Inspiration PDF
This slide showcases weekly content tracking dashboard that can help organization to track the statistics of social media blogs and videos. Its key components are avg impressions per post, avg reach per post, avg engagement rate and avg click through rate.Showcasing this set of slides titled Weekly Tracking Dashboard For Social Media Content Inspiration PDF The topics addressed in these templates are Impressions Per, Impression On Facebook, Posts Reactions All the content presented in this PPT design is completely editable. Download it and make adjustments in color, background, font etc. as per your unique business setting.

Customer Needs Survey Analysis Dashboard Of Company Inspiration PDF
This slide shows the insights of the survey conducted by an organization to identify the needs of their customers through the help of a dashboard. It shows no. of respondents, types of browser, location, operating system etc. Showcasing this set of slides titled Customer Needs Survey Analysis Dashboard Of Company Inspiration PDF. The topics addressed in these templates are Operating System, Location, Device. All the content presented in this PPT design is completely editable. Download it and make adjustments in color, background, font etc. as per your unique business setting.
Manufacturing Company Stock Level Performance Monitoring Dashboard Icons PDF
This slide shows the dashboard for monitoring the inventory level of the manufacturing organization. It shows details related to total stock units, total stock value, capacity and positions of stock, inventory turnover, slow moving stock etc.Showcasing this set of slides titled Manufacturing Company Stock Level Performance Monitoring Dashboard Icons PDF. The topics addressed in these templates are Stock Positions, Stock Volume, Moving Stock. All the content presented in this PPT design is completely editable. Download it and make adjustments in color, background, font etc. as per your unique business setting.

Integrating Web Analytics Campaign Strategy Dashboard Information PDF
This slide depicts integrating digital marketing dashboard used by organizations to track online campaigns. It includes tracking traffic sources, visitors type, bounce rate and top rated conversion channel, campaigns and pages. Showcasing this set of slides titled Integrating Web Analytics Campaign Strategy Dashboard Information PDF. The topics addressed in these templates are Channels By Conversion, Campaigns By Conversion, Pages By Conversion. All the content presented in this PPT design is completely editable. Download it and make adjustments in color, background, font etc. as per your unique business setting.
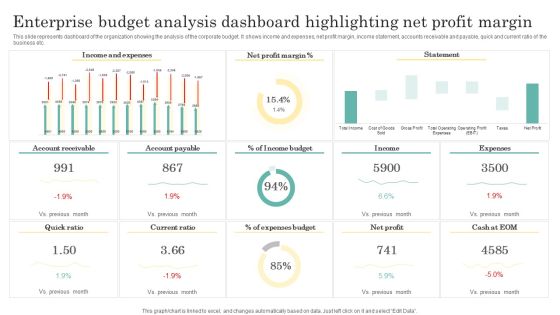
Enterprise Budget Analysis Dashboard Highlighting Net Profit Margin Clipart PDF
This slide represents dashboard of the organization showing the analysis of the corporate budget. It shows income and expenses, net profit margin, income statement, accounts receivable and payable, quick and current ratio of the business etc. Showcasing this set of slides titled Enterprise Budget Analysis Dashboard Highlighting Net Profit Margin Clipart PDF. The topics addressed in these templates are Income And Expenses, Net Profit Margin, Income Budget. All the content presented in this PPT design is completely editable. Download it and make adjustments in color, background, font etc. as per your unique business setting.
Monthly Comparison Dashboard For Lead Tracking Sample PDF
This slide showcases dashboard that can help organization to compare the leads converted in different months and make changes in sales and marketing campaigns . Its key components lead generated by country, by industry type and lead sources by month. Showcasing this set of slides titled Monthly Comparison Dashboard For Lead Tracking Sample PDF. The topics addressed in these templates are Leads Received, Industry Type, Lead Generated. All the content presented in this PPT design is completely editable. Download it and make adjustments in color, background, font etc. as per your unique business setting.
Sales Performance Dashboard With Average Lead Tracking Time Background PDF
This slide showcases dashboard for sales performance that can help organization to analyze the effectiveness of sales campaigns and average response time of lead. Its key components are average contract value, average sales cycle length, follow up contract rate and sales activity. Showcasing this set of slides titled Sales Performance Dashboard With Average Lead Tracking Time Background PDF. The topics addressed in these templates are Avg Contract Value, Sales Activity, Contract Rate. All the content presented in this PPT design is completely editable. Download it and make adjustments in color, background, font etc. as per your unique business setting.
Dashboard To Track Automated Manufacturing Workflow Progress Professional PDF
Following slide demonstrates KPI dashboard for monitoring automated manufacturing processes performance which can be used by businesses to increase organization efficiency. It includes key components such as total business revenue, Number of customers, total units produced, production rate, monthly production by manufacturing lines, etc. Showcasing this set of slides titled Dashboard To Track Automated Manufacturing Workflow Progress Professional PDF. The topics addressed in these templates are Machine Utilization, Product Delivery, Defective Units Produced. All the content presented in this PPT design is completely editable. Download it and make adjustments in color, background, font etc. as per your unique business setting.
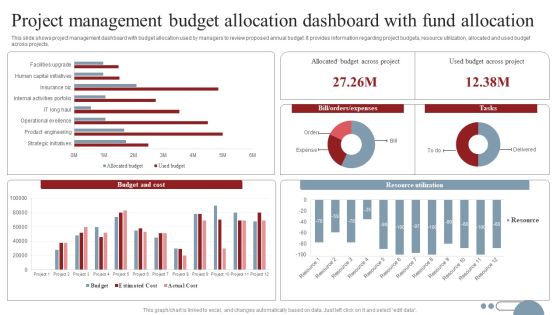
Project Management Budget Allocation Dashboard With Fund Allocation Mockup PDF
This slide shows project management dashboard with budget allocation used by managers to review proposed annual budget. It provides information regarding project budgets, resource utilization, allocated and used budget across projects. Showcasing this set of slides titled Project Management Budget Allocation Dashboard With Fund Allocation Mockup PDF. The topics addressed in these templates are Budget Cost, Resource Utilization, Budget Across Project. All the content presented in this PPT design is completely editable. Download it and make adjustments in color, background, font etc. as per your unique business setting.
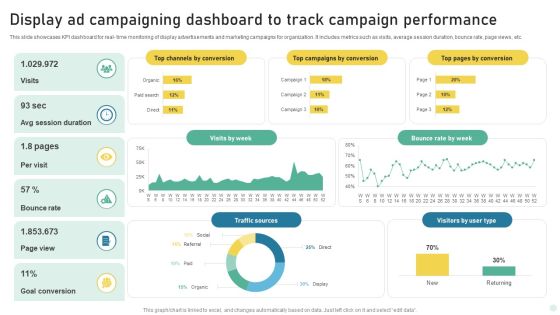
Display Ad Campaigning Dashboard To Track Campaign Performance Background PDF
This slide showcases KPI dashboard for real- time monitoring of display advertisements and marketing campaigns for organization. It includes metrics such as visits, average session duration, bounce rate, page views, etc. Showcasing this set of slides titled Display Ad Campaigning Dashboard To Track Campaign Performance Background PDF. The topics addressed in these templates are Traffic Sources, Bounce Rate, Goal Conversion. All the content presented in this PPT design is completely editable. Download it and make adjustments in color, background, font etc. as per your unique business setting.

Dashboard To Evaluate Talent Management Metrics Professional PDF
This slide represents talent management dashboards. It includes average time to hire, cost per hire, training cost, talent turnover rate, talent satisfaction etc. Whether you have daily or monthly meetings, a brilliant presentation is necessary. Dashboard To Evaluate Talent Management Metrics Professional PDF can be your best option for delivering a presentation. Represent everything in detail using Dashboard To Evaluate Talent Management Metrics Professional PDF and make yourself stand out in meetings. The template is versatile and follows a structure that will cater to your requirements. All the templates prepared by Slidegeeks are easy to download and edit. Our research experts have taken care of the corporate themes as well. So, give it a try and see the results.

Dashboard Marketing Ppt PowerPoint Presentation Infographic Template Background Designs
Presenting this set of slides with name dashboard marketing ppt powerpoint presentation infographic template background designs. The topics discussed in these slides are financial, marketing, management, investment, analysis. This is a completely editable PowerPoint presentation and is available for immediate download. Download now and impress your audience.
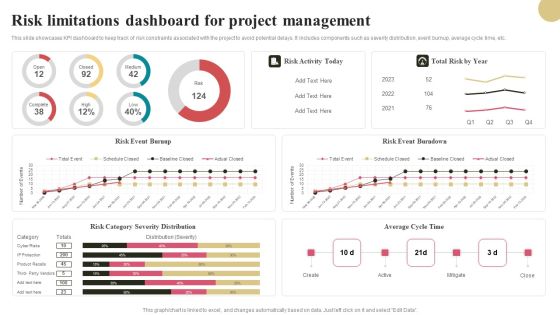
Risk Limitations Dashboard For Project Management Elements PDF
This slide showcases KPI dashboard to keep track of risk constraints associated with the project to avoid potential delays. It includes components such as severity distribution, event burnup, average cycle time, etc. Showcasing this set of slides titled Risk Limitations Dashboard For Project Management Elements PDF. The topics addressed in these templates are Risk Activity Today, Risk Event Burndown, Average Cycle Time. All the content presented in this PPT design is completely editable. Download it and make adjustments in color, background, font etc. as per your unique business setting.
Social Media Performance Tracking And Monitoring Dashboard Mockup PDF
The following slide showcases a dashboard to track and measure social media platforms performance. It includes key elements such as website traffic, social media referral rate, site revenue, social media site revenue, etc. This Social Media Performance Tracking And Monitoring Dashboard Mockup PDF is perfect for any presentation, be it in front of clients or colleagues. It is a versatile and stylish solution for organizing your meetings. The product features a modern design for your presentation meetings. The adjustable and customizable slides provide unlimited possibilities for acing up your presentation. Slidegeeks has done all the homework before launching the product for you. So, do not wait, grab the presentation templates today
Social Media Performance Tracking And Monitoring Dashboard Information PDF
The following slide showcases a dashboard to track and measure social media platforms performance. It includes key elements such as website traffic, social media referral rate, site revenue, social media site revenue, etc. This Social Media Performance Tracking And Monitoring Dashboard Information PDF is perfect for any presentation, be it in front of clients or colleagues. It is a versatile and stylish solution for organizing your meetings. The product features a modern design for your presentation meetings. The adjustable and customizable slides provide unlimited possibilities for acing up your presentation. Slidegeeks has done all the homework before launching the product for you. So, do not wait, grab the presentation templates today

Dashboard To Monitor Logistics Chains Warehouse Operations Diagrams PDF
Following slide depicts a dashboard which can be used by supplier to get a centralized, real-time view of key metrics and data points related to the logistics performance. Key performance metrics are related to due receipts, number of products received,items in transit, items due for pickup etc. Pitch your topic with ease and precision using this Dashboard To Monitor Logistics Chains Warehouse Operations Diagrams PDF. This layout presents information on Product Status, Pickup List Status, Best Selling Products. It is also available for immediate download and adjustment. So, changes can be made in the color, design, graphics or any other component to create a unique layout.

Dashboard For Monthly Procurement Process Automated Workflow Brochure PDF
This slide presents a dashboard for monthly procurement activities in an organization. It includes number of suppliers, contract attainted, supplier share, top supplier report, average procurement cycle time, etc. Want to ace your presentation in front of a live audience Our Dashboard For Monthly Procurement Process Automated Workflow Brochure PDF can help you do that by engaging all the users towards you. Slidegeeks experts have put their efforts and expertise into creating these impeccable powerpoint presentations so that you can communicate your ideas clearly. Moreover, all the templates are customizable, and easy to edit and downloadable. Use these for both personal and commercial use.

Dashboard To Track Employee Training Program Slides PDF
This slide showcases dashboard that can help organization to track on job training program. Its key components are training number, training status, budget, duration, training type and number of trainees. Want to ace your presentation in front of a live audience Our Dashboard To Track Employee Training Program Slides PDF can help you do that by engaging all the users towards you. Slidegeeks experts have put their efforts and expertise into creating these impeccable powerpoint presentations so that you can communicate your ideas clearly. Moreover, all the templates are customizable, and easy to edit and downloadable. Use these for both personal and commercial use.
Facebook Ad Campaign Performance Tracking Dashboard Microsoft PDF
This slide represents the KPI dashboard to effectively measure and monitor performance of Facebook marketing campaign conducted by the organization to enhance customer engagement. It includes details related to KPIs such as ad impressions, ad reach etc. From laying roadmaps to briefing everything in detail, our templates are perfect for you. You can set the stage with your presentation slides. All you have to do is download these easy-to-edit and customizable templates. Facebook Ad Campaign Performance Tracking Dashboard Microsoft PDF will help you deliver an outstanding performance that everyone would remember and praise you for. Do download this presentation today.

Resource Planning Management Dashboard With Effective Utilization Mockup PDF
This slide shows the resourcing plan dashboard which focuses on the over and under utilization, trend by team, data by team which includes resource and utilization time of software developer, web designer and project manager. Pitch your topic with ease and precision using this Resource Planning Management Dashboard With Effective Utilization Mockup PDF. This layout presents information on Web Designer, Software Developer, Team. It is also available for immediate download and adjustment. So, changes can be made in the color, design, graphics or any other component to create a unique layout.
Work From Home Performance Management Dashboard Icons PDF
The following slide outlines a comprehensive key performance indicator KPI dashboard that can be used to showcase employees performance during work from home WFH. Information covered in this slide is related to average result area scores etc. Do you have to make sure that everyone on your team knows about any specific topic. I yes, then you should give Work From Home Performance Management Dashboard Icons PDF a try. Our experts have put a lot of knowledge and effort into creating this impeccable Work From Home Performance Management Dashboard Icons PDF. You can use this template for your upcoming presentations, as the slides are perfect to represent even the tiniest detail. You can download these templates from the Slidegeeks website and these are easy to edit. So grab these today.
Retail Assortment Dashboard Depicting Store Performance Ppt Icon Structure PDF
This slide shows product assortment dashboard depicting store performance which can benefit managers in reviewing the current situation of outlets and make decisions according to reached benchmarks. It includes details about achieved sales, rate of conversion, weekday vs. Weekend sales, daily trend, etc. Showcasing this set of slides titled Retail Assortment Dashboard Depicting Store Performance Ppt Icon Structure PDF. The topics addressed in these templates are Achieved Sales, Rate Of Conversion, Daily Trend, Outlet Sales. All the content presented in this PPT design is completely editable. Download it and make adjustments in color, background, font etc. as per your unique business setting.

Project Metrics Dashboard With Launch Date Formats PDF
This slide covers the project management dashboard which includes status of project phases such as planning, designing, development and testing that also focuses on launch date of project, overdue tasks with date, deadline, etc. and workload on employees. Showcasing this set of slides titled Project Metrics Dashboard With Launch Date Formats PDF. The topics addressed in these templates are Budget, Project Launch Data, Development. All the content presented in this PPT design is completely editable. Download it and make adjustments in color, background, font etc. as per your unique business setting.

Ecommerce Data Driven Marketing Performance Analysis Dashboard Professional PDF
This slide represents the key metrics dashboard to track and analyze the performance of ecommerce business after implementing data driven marketing strategies. It includes details related to key metrics such as ecommerce revenue, new customers, repeat purchase rate etc. Get a simple yet stunning designed Ecommerce Data Driven Marketing Performance Analysis Dashboard Professional PDF. It is the best one to establish the tone in your meetings. It is an excellent way to make your presentations highly effective. So, download this PPT today from Slidegeeks and see the positive impacts. Our easy-to-edit Ecommerce Data Driven Marketing Performance Analysis Dashboard Professional PDF can be your go-to option for all upcoming conferences and meetings. So, what are you waiting for Grab this template today.

Business Development Program Dashboard To Track Employee Performance Portrait PDF
This slide showcases dashboard that can help organization to track on job training program. Its key components are absenteeism rate, overtime hours, training duration and cost and overall labor effectiveness rate. From laying roadmaps to briefing everything in detail, our templates are perfect for you. You can set the stage with your presentation slides. All you have to do is download these easy-to-edit and customizable templates. Business Development Program Dashboard To Track Employee Performance Portrait PDF will help you deliver an outstanding performance that everyone would remember and praise you for. Do download this presentation today.

Healthcare Marketing Dashboard To Measure Patient Satisfaction Professional PDF
The following slide outlines comprehensive dashboard through which medical care companies can evaluate patient experience and make more informed decisions. The metrics outlined in slide are lab test, patient falls, average waiting time, etc. Create an editable Healthcare Marketing Dashboard To Measure Patient Satisfaction Professional PDF that communicates your idea and engages your audience. Whether you are presenting a business or an educational presentation, pre-designed presentation templates help save time. Healthcare Marketing Dashboard To Measure Patient Satisfaction Professional PDF is highly customizable and very easy to edit, covering many different styles from creative to business presentations. Slidegeeks has creative team members who have crafted amazing templates. So, go and get them without any delay.
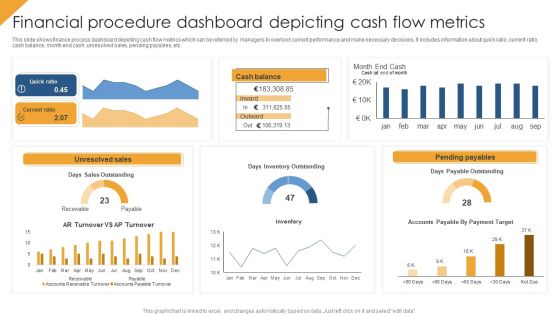
Financial Procedure Dashboard Depicting Cash Flow Metrics Structure PDF
This slide shows finance process dashboard depicting cash flow metrics which can be referred by managers to overlook current performance and make necessary decisions. It includes information about quick ratio, current ratio, cash balance, month end cash, unresolved sales, pending payables, etc. Pitch your topic with ease and precision using this Financial Procedure Dashboard Depicting Cash Flow Metrics Structure PDF. This layout presents information on Quick Ratio, Unresolved Sales, Pending Payables. It is also available for immediate download and adjustment. So, changes can be made in the color, design, graphics or any other component to create a unique layout.

Dashboard To Track Effectiveness Of Owned Media Marketing Structure PDF
This slide illustrates a dashboard which can be used by brand managers to track the effectiveness of earned media in the domain of digital marketing. The key elements include brand mentions, social media reach, customer interactions, positive and negative feedback Pitch your topic with ease and precision using this Dashboard To Track Effectiveness Of Owned Media Marketing Structure PDF. This layout presents information on Brand Mentions, Social Media, Marketing. It is also available for immediate download and adjustment. So, changes can be made in the color, design, graphics or any other component to create a unique layout.
 Home
Home