Executive Summary Dashboard

Sales Work Action Plan Analysis Dashboard Brochure PDF
This slide covers the dashboard for analyzing the sales plan implemented in an organization. The purpose of this template is to assess strategical and operational aspects of the company. It includes key performance indicators such as number of sales, revenue, profit, cost, etc. Showcasing this set of slides titled Sales Work Action Plan Analysis Dashboard Brochure PDF. The topics addressed in these templates are Sales Revenue, Cost Breakdown, Accumulated Revenue. All the content presented in this PPT design is completely editable. Download it and make adjustments in color, background, font etc. as per your unique business setting.
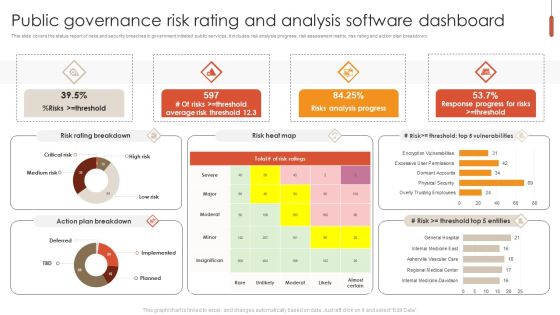
Public Governance Risk Rating And Analysis Software Dashboard Brochure PDF
This slide covers the status report of risks and security breaches in government initiated public services. It includes risk analysis progress, risk assessment matrix, risk rating and action plan breakdown. Showcasing this set of slides titled Public Governance Risk Rating And Analysis Software Dashboard Brochure PDF. The topics addressed in these templates are Risk Rating Breakdown, Risks Analysis Progress, Analysis Software Dashboard. All the content presented in this PPT design is completely editable. Download it and make adjustments in color, background, font etc. as per your unique business setting.
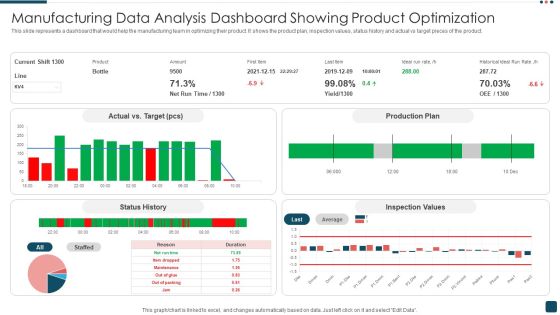
Manufacturing Data Analysis Dashboard Showing Product Optimization Structure PDF
This slide represents a dashboard that would help the manufacturing team in optimizing their product. It shows the product plan, inspection values, status history and actual vs target pieces of the product. Pitch your topic with ease and precision using this Manufacturing Data Analysis Dashboard Showing Product Optimization Structure PDF. This layout presents information on Target, Production Plan, Inspection Values. It is also available for immediate download and adjustment. So, changes can be made in the color, design, graphics or any other component to create a unique layout.
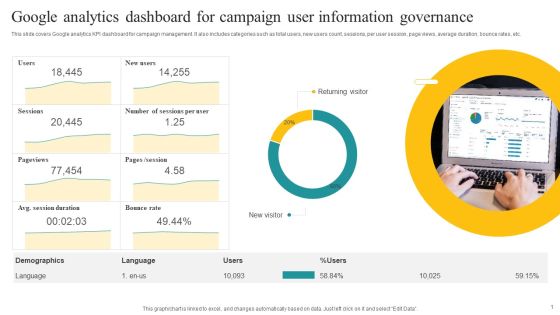
Google Analytics Dashboard For Campaign User Information Governance Demonstration PDF
This slide covers Google analytics KPI dashboard for campaign management. It also includes categories such as total users, new users count, sessions, per user session, page views, average duration, bounce rates, etc. Showcasing this set of slides titled Google Analytics Dashboard For Campaign User Information Governance Demonstration PDF. The topics addressed in these templates are Returning Visitor, New Visitor, Demographics. All the content presented in this PPT design is completely editable. Download it and make adjustments in color, background, font etc. as per your unique business setting.

Website Analytics Dashboard For Consumer Data Insights Clipart PDF
This slide showcases dashboard for website analytics that can help organization to gather data about visitors and formulate targeted marketing campaigns. It can also help to make individual and group buyer personas. Want to ace your presentation in front of a live audience Our Website Analytics Dashboard For Consumer Data Insights Clipart PDF can help you do that by engaging all the users towards you.. Slidegeeks experts have put their efforts and expertise into creating these impeccable powerpoint presentations so that you can communicate your ideas clearly. Moreover, all the templates are customizable, and easy-to-edit and downloadable. Use these for both personal and commercial use.
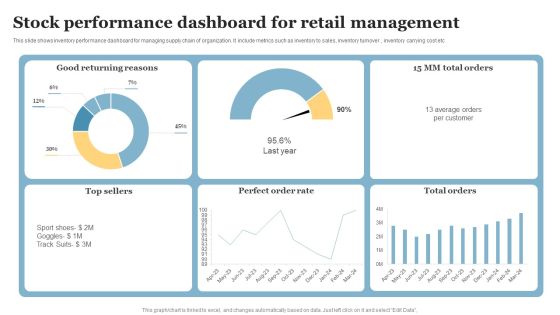
Stock Performance Dashboard For Retail Management Pictures PDF
This slide shows inventory performance dashboard for managing supply chain of organization. It include metrics such as inventory to sales, inventory turnover , inventory carrying cost etc. Pitch your topic with ease and precision using this Stock Performance Dashboard For Retail Management Pictures PDF. This layout presents information on Good Returning Reasons, Perfect Order Rate, Top Sellers. It is also available for immediate download and adjustment. So, changes can be made in the color, design, graphics or any other component to create a unique layout.
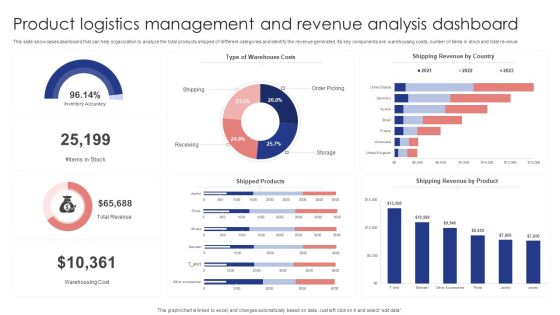
Product Logistics Management And Revenue Analysis Dashboard Demonstration PDF
This slide showcases dashboard that can help organization to analyze the total products shipped of different categories and identify the revenue generated. Its key components are warehousing costs, number of items in stock and total revenue. Pitch your topic with ease and precision using this Product Logistics Management And Revenue Analysis Dashboard Demonstration PDF. This layout presents information on Warehouse Costs, Shipping Revenue Country, Shipped Products . It is also available for immediate download and adjustment. So, changes can be made in the color, design, graphics or any other component to create a unique layout.

Analyzing Customer Demographics Through Performance KPI Dashboard Graphics PDF
The following slide outlines key performance indicator KPI dashboard outlining customer demographics. Information covered in this slide is related to metrics such as gender, education level, technology adoption life cycle, and brand innovation consent. Find a pre designed and impeccable Analyzing Customer Demographics Through Performance KPI Dashboard Graphics PDF. The templates can ace your presentation without additional effort. You can download these easy to edit presentation templates to make your presentation stand out from others. So, what are you waiting for Download the template from Slidegeeks today and give a unique touch to your presentation.

KPI Dashboard To Track Amazon Performance Template PDF
This slide provides information regarding dashboard to monitor Amazon performance. The KPIs include tracking of product sales, conversion rate, advertising spends, session, organic sales, etc. Do you have to make sure that everyone on your team knows about any specific topic I yes, then you should give KPI Dashboard To Track Amazon Performance Template PDF a try. Our experts have put a lot of knowledge and effort into creating this impeccable KPI Dashboard To Track Amazon Performance Template PDF. You can use this template for your upcoming presentations, as the slides are perfect to represent even the tiniest detail. You can download these templates from the Slidegeeks website and these are easy to edit. So grab these today

Project Management Plan Dashboard With Overdue Tasks Slides PDF
This slide represents the project plan dashboard which is useful to analyse the effectiveness of the project with the help of multiple parameters such as- budget, workload, launch date and upcoming deadlines. Showcasing this set of slides titled Project Management Plan Dashboard With Overdue Tasks Slides PDF. The topics addressed in these templates are Development, Design, Planning. All the content presented in this PPT design is completely editable. Download it and make adjustments in color, background, font etc. as per your unique business setting.

Concept Of Risk And Vulnerability Management Dashboard Introduction Portrait PDF
Showcasing this set of slides titled Concept Of Risk And Vulnerability Management Dashboard Introduction Portrait PDF The topics addressed in these templates are Recent Risk Exposure, Risk Exposure, Impacted Resource All the content presented in this PPT design is completely editable. Download it and make adjustments in color, background, font etc. as per your unique business setting.
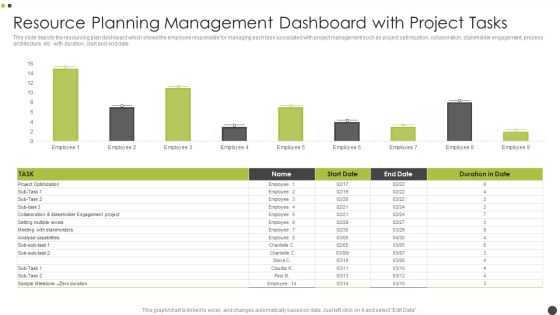
Resource Planning Management Dashboard With Project Tasks Clipart PDF
This slide depicts the resourcing plan dashboard which shows the employee responsible for managing each task associated with project management such as project optimization, collaboration, stakeholder engagement, process architecture, etc. with duration, start and end date. Showcasing this set of slides titled Resource Planning Management Dashboard With Project Tasks Clipart PDF. The topics addressed in these templates are Project Optimization, Analyse Capabilities. All the content presented in this PPT design is completely editable. Download it and make adjustments in color, background, font etc. as per your unique business setting.

Stocks Market Capitalization Fundamental Trend Analysis Dashboard Designs PDF
This slide represents the dashboard showing the fundamental analysis of the stock market. It includes data related to top 10 stock market capitalization, top 10 stocks by EPS and top 5 stocks by net profit.Showcasing this set of slides titled Stocks Market Capitalization Fundamental Trend Analysis Dashboard Designs PDF. The topics addressed in these templates are Market Capitalization, Net Profit. All the content presented in this PPT design is completely editable. Download it and make adjustments in color, background, font etc. as per your unique business setting.

Dashboard For Retail Store Stock Management Approach Portrait PDF
This slide showcases dashboard that can help organization in inventory management process by tracking availability of stock in warehouse and returned items. It also showcases details about product order, top selling items, inventory turnover ratio and gross margin ROI. Showcasing this set of slides titled Dashboard For Retail Store Stock Management Approach Portrait PDF. The topics addressed in these templates are Average Inventory, Product Category, Inventory Turn. All the content presented in this PPT design is completely editable. Download it and make adjustments in color, background, font etc. as per your unique business setting.

Dashboard For Customer Satisfaction Survey Outcome Demonstration PDF
This slide outlines customer satisfaction survey outcome dashboard that can help organization to analyze the ratings and determine areas of improvement in customer service and make changes in strategies to increase the satisfied customers in future. Its key components are survey response rate, total invitations, total responses and CSAT score. Showcasing this set of slides titled Dashboard For Customer Satisfaction Survey Outcome Demonstration PDF. The topics addressed in these templates are Total Invitations, Survey Response Rate, Total Responses. All the content presented in this PPT design is completely editable. Download it and make adjustments in color, background, font etc. as per your unique business setting.
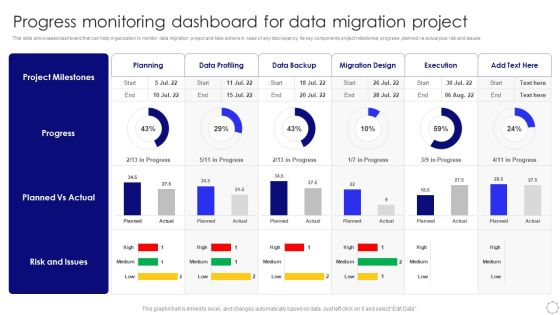
Progress Monitoring Dashboard For Data Migration Project Sample PDF
This slide showcases dashboard that can help organization to monitor data migration project and take actions in case of any discrepancy. Its key components project milestones progress, planned vs actual plus risk and issues. Pitch your topic with ease and precision using this Progress Monitoring Dashboard For Data Migration Project Sample PDF. This layout presents information on Planned Vs Actual, Risk And Issues, Project Milestones. It is also available for immediate download and adjustment. So, changes can be made in the color, design, graphics or any other component to create a unique layout.
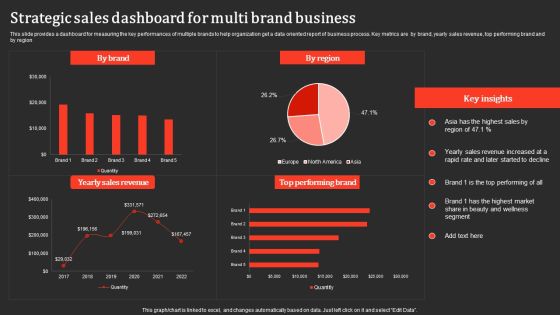
Strategic Sales Dashboard For Multi Brand Business Professional PDF
This slide provides a dashboard for measuring the key performances of multiple brands to help organization get a data oriented report of business process. Key metrics are by brand, yearly sales revenue, top performing brand and by region. Pitch your topic with ease and precision using this Strategic Sales Dashboard For Multi Brand Business Professional PDF. This layout presents information on Yearly Sales Revenue, Performing Brand. It is also available for immediate download and adjustment. So, changes can be made in the color, design, graphics or any other component to create a unique layout.

Dashboard For Technological Smart Homes Security System Management Designs PDF
This side showcase the dashboard of security system management for tracking and forecasting matrices for better functioning of devices. It include the statistic data such as temperature, power consumed, devices working, and list of devices connected. Showcasing this set of slides titled Dashboard For Technological Smart Homes Security System Management Designs PDF. The topics addressed in these templates are Smart Light, Smart Heating, Smart Cooling. All the content presented in this PPT design is completely editable. Download it and make adjustments in color, background, font etc. as per your unique business setting.

Internal Organizational Communication Kpis And Dashboard With Channels Infographics PDF
This slide showcases dashboard that can help organization to assess the performance of internal communication and analyzing the user participation. Its key components are message success, channels and user engagement. Pitch your topic with ease and precision using this Internal Organizational Communication Kpis And Dashboard With Channels Infographics PDF. This layout presents information on User Participation, User Engagement, Message Success. It is also available for immediate download and adjustment. So, changes can be made in the color, design, graphics or any other component to create a unique layout.

Instagram Influencer Marketing Campaign Dashboard Ppt Infographic Template Topics PDF
This slide represents key metrics dashboard to track and measure progress of Instagram influencer marketing campaign. It includes details related to KPIs such as impressions, likes, engagement rates etc. Explore a selection of the finest Instagram Influencer Marketing Campaign Dashboard Ppt Infographic Template Topics PDF here. With a plethora of professionally designed and pre made slide templates, you can quickly and easily find the right one for your upcoming presentation. You can use our Instagram Influencer Marketing Campaign Dashboard Ppt Infographic Template Topics PDF to effectively convey your message to a wider audience. Slidegeeks has done a lot of research before preparing these presentation templates. The content can be personalized and the slides are highly editable. Grab templates today from Slidegeeks.

Dashboard To Track Energy Efficiency After Campaign Implementation Pictures PDF
This slide consists of a Dashboard which can be used to track energy saving which will be used by managers to track effectiveness of program implementation. The key performance indicators include electric vs gas allocation, equipment activity, changes in costs, budget load etc. Showcasing this set of slides titled Dashboard To Track Energy Efficiency After Campaign Implementation Pictures PDF. The topics addressed in these templates are Equipment Activity, Budget Load, Cost Projection. All the content presented in this PPT design is completely editable. Download it and make adjustments in color, background, font etc. as per your unique business setting.
Lead Tracking Metrics Dashboard With User Responses Diagrams PDF
This slide showcases dashboard for lead conversion metrics that can help organization to filter out total leads interested from the leads who have responded to the phone calls by organization. It also showcases key metrics such as leads busiest hours, leads busiest days, phone number types and lead types. Showcasing this set of slides titled Lead Tracking Metrics Dashboard With User Responses Diagrams PDF. The topics addressed in these templates are Busiest Hours Leads, Conversion Metrics, Lead Types. All the content presented in this PPT design is completely editable. Download it and make adjustments in color, background, font etc. as per your unique business setting.

Freelance Content Marketing Dashboard With Metrics Demonstration PDF
The following slide highlights the freelance content marketing dashboard with metrics illustrating most visited content, monthly total visit, average content score. It depicts key metrics which includes content reach, unique visits, organic ranking, number of shares, rating, session time and repeat visitors. Showcasing this set of slides titled Freelance Content Marketing Dashboard With Metrics Demonstration PDF. The topics addressed in these templates are Organic Ranking, Manufacturing, Average Content Score. All the content presented in this PPT design is completely editable. Download it and make adjustments in color, background, font etc. as per your unique business setting.

New Orders Logistics Management Dashboard With Delivery Status Designs PDF
This slide showcases shipping management dashboard that can help company to daily track the status of their new orders shipped. Its key components are recent orders, items ordered, items shipped and total shipped orders. Pitch your topic with ease and precision using this New Orders Logistics Management Dashboard With Delivery Status Designs PDF. This layout presents information on Recent Orders, Current Shipping Status, New Orders. It is also available for immediate download and adjustment. So, changes can be made in the color, design, graphics or any other component to create a unique layout.

Design Software Playbook Engineers Project Management Dashboard Mockup PDF
This slide covers project evaluation dashboard including planning, design , development and testing for evaluating the project while proceeding to closure. Slidegeeks is here to make your presentations a breeze with Design Software Playbook Engineers Project Management Dashboard Mockup PDF With our easy-to-use and customizable templates, you can focus on delivering your ideas rather than worrying about formatting. With a variety of designs to choose from, you are sure to find one that suits your needs. And with animations and unique photos, illustrations, and fonts, you can make your presentation pop. So whether you are giving a sales pitch or presenting to the board, make sure to check out Slidegeeks first.
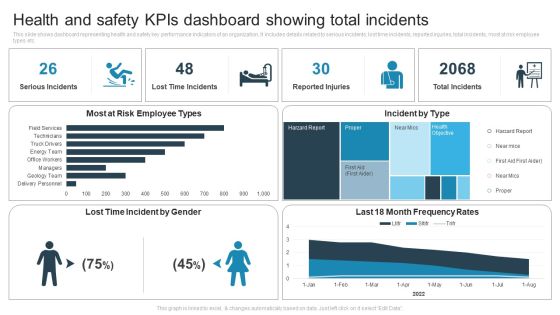
Health And Safety Kpis Dashboard Showing Total Incidents Pictures PDF
This slide shows dashboard representing health and safety key performance indicators of an organization. It includes details related to serious incidents, lost time incidents, reported injuries, total incidents, most at risk employee types etc. Showcasing this set of slides titled Health And Safety Kpis Dashboard Showing Total Incidents Pictures PDF. The topics addressed in these templates are Lost Time Incident, Most At Risk Employee, Incident By Type. All the content presented in this PPT design is completely editable. Download it and make adjustments in color, background, font etc. as per your unique business setting.

Communication Kpis Performance Dashboard Of Social Media Channels Mockup PDF
This slide showcases dashboard that can help organization to analyze the effectiveness of communication KPIs campaign by studying channel views and number of likes. Its key components are youtube channel views, linkedin shares, linked in clicks and facebook daily reach. Pitch your topic with ease and precision using this Communication Kpis Performance Dashboard Of Social Media Channels Mockup PDF. This layout presents information on Linkedin Shares, Facebook Page likes, Facebook Daily Reach. It is also available for immediate download and adjustment. So, changes can be made in the color, design, graphics or any other component to create a unique layout.

Monthly Email Communication Kpis And Dashboard Download PDF
This slide showcases dashboard for email communication KPIs that can help organization to analyze the reach and average response time of customers. Its key elements are send messages, recipients, received messages, senders and monthly email distribution. Pitch your topic with ease and precision using this Monthly Email Communication Kpis And Dashboard Download PDF. This layout presents information on Sent Messages, Recipients, Average Response Time, Received Message. It is also available for immediate download and adjustment. So, changes can be made in the color, design, graphics or any other component to create a unique layout.
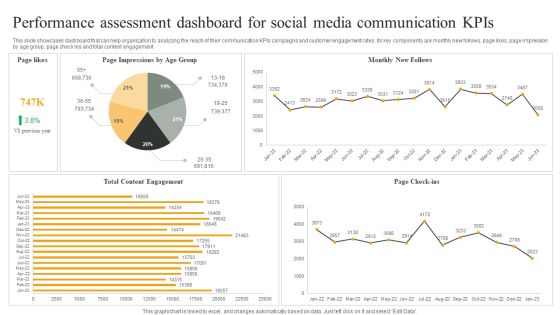
Performance Assessment Dashboard For Social Media Communication Kpis Graphics PDF
This slide showcases dashboard that can help organization to analyzing the reach of their communication KPIs campaigns and customer engagement rates. Its key components are monthly new follows, page likes, page impression by age group, page check ins and total content engagement. Pitch your topic with ease and precision using this Performance Assessment Dashboard For Social Media Communication Kpis Graphics PDF. This layout presents information on Monthly New Follows, Page Check ins, Total Content Engagement. It is also available for immediate download and adjustment. So, changes can be made in the color, design, graphics or any other component to create a unique layout.

Project Capabilities Scope Management KPI Dashboard Ppt Slide Download PDF
Presenting this set of slides with name project capabilities scope management kpi dashboard ppt slide download pdf. The topics discussed in these slides are project complete, cost and budget, resource allocation, earned value schedule indicators, resources and tasks. This is a completely editable PowerPoint presentation and is available for immediate download. Download now and impress your audience.

ESG Data Reporting And Management Dashboard Download PDF
The following slide showcases a dashboard for tracking and managing data of economic, social and global goals. It provides information about ESG score breakdown by region, MV weight and MTD return by sector, fund vs. sector ESG score, lowest rated companies with MV weight over 1 percent, etc. Formulating a presentation can take up a lot of effort and time, so the content and message should always be the primary focus. The visuals of the PowerPoint can enhance the presenters message, so our ESG Data Reporting And Management Dashboard Download PDF was created to help save time. Instead of worrying about the design, the presenter can concentrate on the message while our designers work on creating the ideal templates for whatever situation is needed. Slidegeeks has experts for everything from amazing designs to valuable content, we have put everything into ESG Data Reporting And Management Dashboard Download PDF.
IT Project Management Progress Tracking KPI Dashboard Template PDF
This slide provides IT project development dashboard which helps managers performance status. It provides information regarding team velocity, work in story points, product estimation status, closed story point vs epic story point and pending story points. Showcasing this set of slides titled IT Project Management Progress Tracking KPI Dashboard Template PDF. The topics addressed in these templates are Team Velocity, Product Estimation Status, Pending Story Points. All the content presented in this PPT design is completely editable. Download it and make adjustments in color, background, font etc. as per your unique business setting.
Logistics Management Time Tracking Dashboard With Warehousing Costs Template PDF
This slide showcases shipping dashboard that can help company to deliver the products in stipulated time and keep warehousing operating expenses within pre decided budget. Its also displays perfect order rate and total shipments by country. Pitch your topic with ease and precision using this Logistics Management Time Tracking Dashboard With Warehousing Costs Template PDF. This layout presents information on Warehouse Operating Costs, Perfect Order Rate, On Time Shipments. It is also available for immediate download and adjustment. So, changes can be made in the color, design, graphics or any other component to create a unique layout.
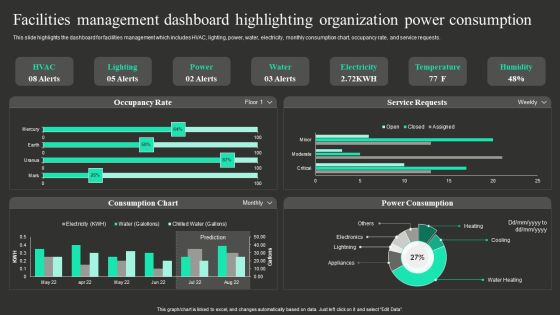
Facilities Management Dashboard Highlighting Organization Power Consumption Designs PDF
This slide highlights the dashboard for facilities management which includes HVAC, lighting, power, water, electricity, monthly consumption chart, occupancy rate, and service requests. Are you in need of a template that can accommodate all of your creative concepts This one is crafted professionally and can be altered to fit any style. Use it with Google Slides or PowerPoint. Include striking photographs, symbols, depictions, and other visuals. Fill, move around, or remove text boxes as desired. Test out color palettes and font mixtures. Edit and save your work, or work with colleagues. Download Facilities Management Dashboard Highlighting Organization Power Consumption Designs PDF and observe how to make your presentation outstanding. Give an impeccable presentation to your group and make your presentation unforgettable.

Customer Goods Production Manufacturing Company Dashboard With Downtime Pictures PDF
This slide showcases the manufacturing company dashboard which showcases downtime causes top 5 products with price with sold items and revenue, it also includes production volume by top machines. This Customer Goods Production Manufacturing Company Dashboard With Downtime Pictures PDF is perfect for any presentation, be it in front of clients or colleagues. It is a versatile and stylish solution for organizing your meetings. The Customer Goods Production Manufacturing Company Dashboard With Downtime Pictures PDF features a modern design for your presentation meetings. The adjustable and customizable slides provide unlimited possibilities for acing up your presentation. Slidegeeks has done all the homework before launching the product for you. So, dont wait, grab the presentation templates today.

Dashboard For Tracking Brand Awareness Advertisement Campaign Results Download PDF
This slide showcases dashboard that can help organization to track results of online advertisement campaigns. Its key components ad impressions, click through rate, cost per conversion, revenue per click, impressions, new users and sessions. Here you can discover an assortment of the finest PowerPoint and Google Slides templates. With these templates, you can create presentations for a variety of purposes while simultaneously providing your audience with an eye catching visual experience. Download Dashboard For Tracking Brand Awareness Advertisement Campaign Results Download PDF to deliver an impeccable presentation. These templates will make your job of preparing presentations much quicker, yet still, maintain a high level of quality. Slidegeeks has experienced researchers who prepare these templates and write high quality content for you. Later on, you can personalize the content by editing the Dashboard For Tracking Brand Awareness Advertisement Campaign Results Download PDF.

Ad Word Marketing Campaign Management Dashboard Designs PDF
This slide showcases a dashboard for managing ad word campaign to assists marketers in optimizing their ads and PPC performance. It highlights element such as sessions, users, page view per sessions, average time on page, conversions, date period, goals completion and top acquisition channels. Find a pre designed and impeccable Ad Word Marketing Campaign Management Dashboard Designs PDF. The templates can ace your presentation without additional effort. You can download these easy to edit presentation templates to make your presentation stand out from others. So, what are you waiting for Download the template from Slidegeeks today and give a unique touch to your presentation.

Retail Analytics Dashboard To Measure Merchandise Planning Effectiveness Designs PDF
Do you have to make sure that everyone on your team knows about any specific topic I yes, then you should give Retail Analytics Dashboard To Measure Merchandise Planning Effectiveness Designs PDF a try. Our experts have put a lot of knowledge and effort into creating this impeccable Retail Analytics Dashboard To Measure Merchandise Planning Effectiveness Designs PDF. You can use this template for your upcoming presentations, as the slides are perfect to represent even the tiniest detail. You can download these templates from the Slidegeeks website and these are easy to edit. So grab these today.

Customer Service Metrics Dashboard With Customer Retention Rate Icons PDF
This slide showcases KPIs dashboard for customer service that can help organization to track the consumer satisfaction score and improve product or service by improving customer loyalty. Its key components are net promoter score, customer retention and support costs. Showcasing this set of slides titled Customer Service Metrics Dashboard With Customer Retention Rate Icons PDF. The topics addressed in these templates are Customer Retention, Net Promoter Score, Service Level. All the content presented in this PPT design is completely editable. Download it and make adjustments in color, background, font etc. as per your unique business setting.
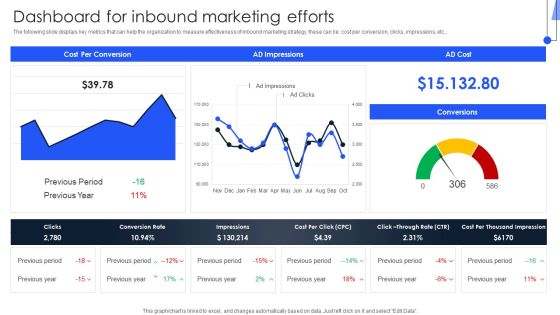
Implementing Marketing Strategies Dashboard For Inbound Marketing Efforts Guidelines PDF
The following slide displays key metrics that can help the organization to measure effectiveness of inbound marketing strategy, these can be cost per conversion, clicks, impressions, etc. Presenting this PowerPoint presentation, titled Implementing Marketing Strategies Dashboard For Inbound Marketing Efforts Guidelines PDF, with topics curated by our researchers after extensive research. This editable presentation is available for immediate download and provides attractive features when used. Download now and captivate your audience. Presenting this Implementing Marketing Strategies Dashboard For Inbound Marketing Efforts Guidelines PDF. Our researchers have carefully researched and created these slides with all aspects taken into consideration. This is a completely customizable Implementing Marketing Strategies Dashboard For Inbound Marketing Efforts Guidelines PDF that is available for immediate downloading. Download now and make an impact on your audience. Highlight the attractive features available with our PPTs.
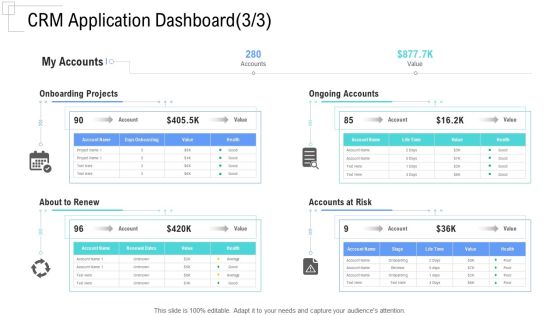
Managing Customer Experience CRM Application Dashboard Accounts Introduction PDF
Deliver and pitch your topic in the best possible manner with this managing customer experience crm application dashboard accounts introduction pdf. Use them to share invaluable insights on onboarding projects, ongoing accounts, about to renew, accounts at risk and impress your audience. This template can be altered and modified as per your expectations. So, grab it now.
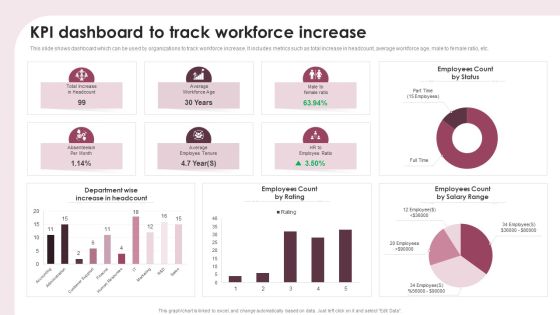
KPI Dashboard To Track Workforce Increase Ppt Show Portfolio PDF
This slide shows dashboard which can be used by organizations to track workforce increase. It includes metrics such as total increase in headcount, average workforce age, male to female ratio, etc. Pitch your topic with ease and precision using this KPI Dashboard To Track Workforce Increase Ppt Show Portfolio PDF. This layout presents information on Department Wise, Increase Headcount, Employees Count Rating. It is also available for immediate download and adjustment. So, changes can be made in the color, design, graphics or any other component to create a unique layout.

Application Download Or Traffic Assessment Dashboard Formats PDF
This slide covers post application launch app performance KPIs metrics such as paid installations, organic installations, top media sources, uninstallations etc. Presenting this PowerPoint presentation, titled Application Download Or Traffic Assessment Dashboard Formats PDF, with topics curated by our researchers after extensive research. This editable presentation is available for immediate download and provides attractive features when used. Download now and captivate your audience. Presenting this Application Download Or Traffic Assessment Dashboard Formats PDF. Our researchers have carefully researched and created these slides with all aspects taken into consideration. This is a completely customizable Application Download Or Traffic Assessment Dashboard Formats PDF that is available for immediate downloading. Download now and make an impact on your audience. Highlight the attractive features available with our PPTs.

Safety Measurement Dashboard With Key Kpis And Severity Sample PDF
This slide represents the dashboard showing performance measurement analysis of safety team of an organization. It includes details related to incidents, critical incidents and its cost, severity, type of incident and their consequence. Showcasing this set of slides titled Safety Measurement Dashboard With Key Kpis And Severity Sample PDF. The topics addressed in these templates are Incidents, Critical Incidents, Day Since Last Incident. All the content presented in this PPT design is completely editable. Download it and make adjustments in color, background, font etc. as per your unique business setting.
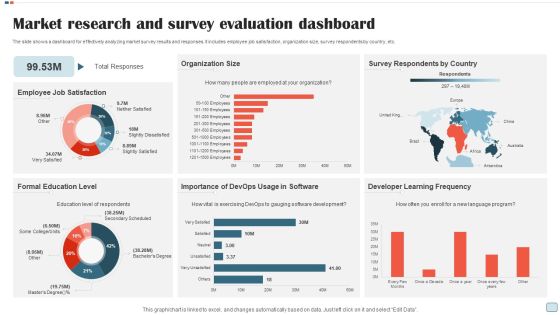
Market Research And Survey Evaluation Dashboard Rules PDF
The slide shows a dashboard for effectively analyzing market survey results and responses. It includes employee job satisfaction, organization size, survey respondents by country, etc. Pitch your topic with ease and precision using this Market Research And Survey Evaluation Dashboard Rules PDF. This layout presents information on Employee Job Satisfaction, Organization Size, Survey Respondents By Country. It is also available for immediate download and adjustment. So, changes can be made in the color, design, graphics or any other component to create a unique layout.

Financial Kpi Dashboard To Evaluate Fundraising Impact Topics PDF
This slide showcases dashboard that can help organization to evaluate key changes in financial KPIs post fundraising. Its key components are net profit margin, revenue, gross profit margin, debt to equity and return on equity. Do you have to make sure that everyone on your team knows about any specific topic I yes, then you should give Financial Kpi Dashboard To Evaluate Fundraising Impact Topics PDF a try. Our experts have put a lot of knowledge and effort into creating this impeccable Financial Kpi Dashboard To Evaluate Fundraising Impact Topics PDF. You can use this template for your upcoming presentations, as the slides are perfect to represent even the tiniest detail. You can download these templates from the Slidegeeks website and these are easy to edit. So grab these today.

Manufactured Products Sales Performance Monitoring Dashboard Information PDF
This slide shows the dashboard the data related to the sales performance of the products manufactured by the organization in order to effectively measure and monitor the performance of the sales team. It shows details related to revenue generated and units sold etc.Pitch your topic with ease and precision using this Manufactured Products Sales Performance Monitoring Dashboard Information PDF. This layout presents information on Monthly Revenue, Manufactured Products, Sales Performance Monitoring. It is also available for immediate download and adjustment. So, changes can be made in the color, design, graphics or any other component to create a unique layout.
Integrated Digital Marketing Strategy Dashboard For Lead Conversion Icons PDF
Following slide illustrates integrated marketing campaign dashboard utilized by organizations to improve business agility and increase operational efficiency. This slide provides data regarding lead conversion by campaign and channel, amount spent per campaign, monthly lead generations, etc. Showcasing this set of slides titled Integrated Digital Marketing Strategy Dashboard For Lead Conversion Icons PDF. The topics addressed in these templates are Total Page Views, Average Session Duration, Conversion. All the content presented in this PPT design is completely editable. Download it and make adjustments in color, background, font etc. as per your unique business setting.

Automation Project Status Dashboard Of Consulting Firm Report Background PDF
This slide showcases project status dashboard that provides a concise visual of key indicators progress and allow to compare actual performance with pre-built objectives. Key metrics covered are cost performance, time v or s project phase, timeline v or s resource capacity. Showcasing this set of slides titled Automation Project Status Dashboard Of Consulting Firm Report Background PDF. The topics addressed in these templates are Project Phase, Planned Value, Cost Performance Index. All the content presented in this PPT design is completely editable. Download it and make adjustments in color, background, font etc. as per your unique business setting.

Customer Related Quality Kpis Dashboard For Project Management Brochure PDF
This slide displays a dashboard for measurement of parameters related to customer satisfaction. It includes details such as net promoter score, customer retention rate, customer efforts, etc. Showcasing this set of slides titled Customer Related Quality Kpis Dashboard For Project Management Brochure PDF. The topics addressed in these templates are Customer Retention Rate, Net Promoter Score, Customer Effort Score. All the content presented in this PPT design is completely editable. Download it and make adjustments in color, background, font etc. as per your unique business setting.

Dashboard Showing Monitoring Campaign Of Marketing Ppt Infographics PDF
This slide represents dashboard showcasing campaign report. It includes recipients, email clients, open rate, spam complaints etc that enable organization in analyzing progress of marketing campaign to develop more effective strategies. Showcasing this set of slides titled Dashboard Showing Monitoring Campaign Of Marketing Ppt Infographics PDF. The topics addressed in these templates are Recipients, Open Rate, Spam Complaints, Shares. All the content presented in this PPT design is completely editable. Download it and make adjustments in color, background, font etc. as per your unique business setting.

KPI Dashboard To Analyze PPC Marketing Campaigns Performance Information PDF
This slide showcases the parameters that would help the business organization to evaluate Pay Per Click PPC marketing performance. It includes ad cost, clicks, impression, conversions, ad impressions, conversion rate, Cost Per Click CPC, etc. Presenting this PowerPoint presentation, titled KPI Dashboard To Analyze PPC Marketing Campaigns Performance Information PDF, with topics curated by our researchers after extensive research. This editable presentation is available for immediate download and provides attractive features when used. Download now and captivate your audience. Presenting this KPI Dashboard To Analyze PPC Marketing Campaigns Performance Information PDF. Our researchers have carefully researched and created these slides with all aspects taken into consideration. This is a completely customizable KPI Dashboard To Analyze PPC Marketing Campaigns Performance Information PDF that is available for immediate downloading. Download now and make an impact on your audience. Highlight the attractive features available with our PPTs.

CRM Application Dashboard Value Customer Relationship Management CRM Introduction PDF
Deliver and pitch your topic in the best possible manner with this crm application dashboard value customer relationship management crm introduction pdf. Use them to share invaluable insights on ongoing accounts, ongoing project, value, risk and impress your audience. This template can be altered and modified as per your expectations. So, grab it now.

Corporate Training Program Dashboard To Track Employee Performance Portrait PDF
This slide showcases dashboard that can help organization to track on job training program. Its key components are absenteeism rate, overtime hours, training duration and cost and overall labor effectiveness rate. Crafting an eye catching presentation has never been more straightforward. Let your presentation shine with this tasteful yet straightforward Corporate Training Program Dashboard To Track Employee Performance Portrait PDF template. It offers a minimalistic and classy look that is great for making a statement. The colors have been employed intelligently to add a bit of playfulness while still remaining professional. Construct the ideal Corporate Training Program Dashboard To Track Employee Performance Portrait PDF that effortlessly grabs the attention of your audience. Begin now and be certain to wow your customers.

Sales Opportunity Monitoring Dashboard Ppt Professional Mockup PDF
This Sales Opportunity Monitoring Dashboard Ppt Professional Mockup PDF is perfect for any presentation, be it in front of clients or colleagues. It is a versatile and stylish solution for organizing your meetings. The Sales Opportunity Monitoring Dashboard Ppt Professional Mockup PDF features a modern design for your presentation meetings. The adjustable and customizable slides provide unlimited possibilities for acing up your presentation. Slidegeeks has done all the homework before launching the product for you. So, do not wait, grab the presentation templates today
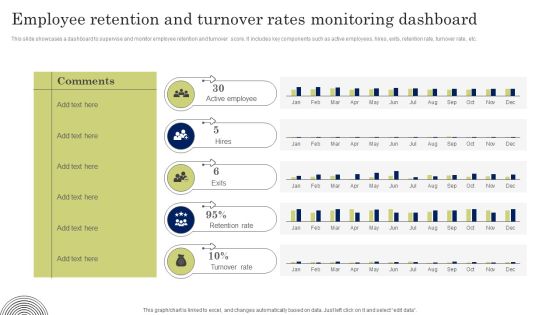
Employee Retention And Turnover Rates Monitoring Dashboard Designs PDF
This slide showcases a dashboard to supervise and monitor employee retention and turnover score. It includes key components such as active employees, hires, exits, retention rate, turnover rate, etc. Whether you have daily or monthly meetings, a brilliant presentation is necessary. Employee Retention And Turnover Rates Monitoring Dashboard Designs PDF can be your best option for delivering a presentation. Represent everything in detail using Employee Retention And Turnover Rates Monitoring Dashboard Designs PDF and make yourself stand out in meetings. The template is versatile and follows a structure that will cater to your requirements. All the templates prepared by Slidegeeks are easy to download and edit. Our research experts have taken care of the corporate themes as well. So, give it a try and see the results.

Dashboard Showing Work Resource Planning Management Microsoft PDF
This slide covers the dashboard depicting work resourcing plan which includes utilization, scheduled time, overtime capacity, waiting list, holiday, sick leave, other downtime with total scheduled, billable, non billable, unscheduled time with resource name, etc. Pitch your topic with ease and precision using this Dashboard Showing Work Resource Planning Management Microsoft PDF. This layout presents information on Software Developer, Team Leader, Information Architect. It is also available for immediate download and adjustment. So, changes can be made in the color, design, graphics or any other component to create a unique layout.

Construction Project Metrics Dashboard Showing Resource Allocation Professional PDF
This slide shows the project management dashboard which covers the allocation of resources among workers including their job profiles such as resource manager, consultant, director consulting services, etc. with actions like finding project for worker, searching candidates. Showcasing this set of slides titled Construction Project Metrics Dashboard Showing Resource Allocation Professional PDF. The topics addressed in these templates are Resource Manager, Services, Project. All the content presented in this PPT design is completely editable. Download it and make adjustments in color, background, font etc. as per your unique business setting.

Health And Risk KPI Dashboard Ppt Pictures Designs Download PDF
The slide highlights the health and safety key performance indicator dashboard illustrating key headings which includes key objectives, inspections, total reports vs over due reports, injuries by body part and accident trends. Pitch your topic with ease and precision using this Health And Risk KPI Dashboard Ppt Pictures Designs Download PDF. This layout presents information on Key Objectives, Inspections, Accidents Trends. It is also available for immediate download and adjustment. So, changes can be made in the color, design, graphics or any other component to create a unique layout.

Revenue Dashboard Of Digital Consultation Service Ppt Designs
This template shows the revenue generation dashboard of an online consulting business. The purpose of this slide is to measure the current and past revenue generation with new clients. It includes KPIs such as average comparison with revenue, CAC, etc. Pitch your topic with ease and precision using this Revenue Dashboard Of Digital Consultation Service Ppt Designs. This layout presents information on Revenue, Digital, Consultation. It is also available for immediate download and adjustment. So, changes can be made in the color, design, graphics or any other component to create a unique layout.
 Home
Home