AI PPT Maker
Templates
PPT Bundles
Design Services
Business PPTs
Business Plan
Management
Strategy
Introduction PPT
Roadmap
Self Introduction
Timelines
Process
Marketing
Agenda
Technology
Medical
Startup Business Plan
Cyber Security
Dashboards
SWOT
Proposals
Education
Pitch Deck
Digital Marketing
KPIs
Project Management
Product Management
Artificial Intelligence
Target Market
Communication
Supply Chain
Google Slides
Research Services
 One Pagers
All Categories
-
Home
- Customer Favorites
- Executive Summary Dashboard
Executive Summary Dashboard
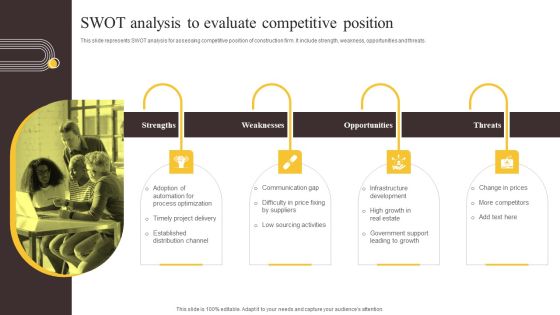
Global Construction Sector Industry Report SWOT Analysis To Evaluate Competitive Position Designs PDF
This slide represents SWOT analysis for assessing competitive position of construction firm. It include strength, weakness, opportunities and threats. The Global Construction Sector Industry Report SWOT Analysis To Evaluate Competitive Position Designs PDF is a compilation of the most recent design trends as a series of slides. It is suitable for any subject or industry presentation, containing attractive visuals and photo spots for businesses to clearly express their messages. This template contains a variety of slides for the user to input data, such as structures to contrast two elements, bullet points, and slides for written information. Slidegeeks is prepared to create an impression.

Data Management Vector Icon Ppt PowerPoint Presentation File Visual Aids PDF
Presenting this set of slides with name data management vector icon ppt powerpoint presentation file visual aids pdf. This is a three stage process. The stages in this process are data management vector icon. This is a completely editable PowerPoint presentation and is available for immediate download. Download now and impress your audience.

Comprehensive Customer Data Platform Guide Optimizing Promotional Initiatives Data Collection Segmentation Activation Rules PDF
The following slide depicts data collection, segmentation and activation procedure to determine target audience categories and assist marketers to enrich their profiles. It includes elements such as first party data sources, unification, campaign implementation etc. The Comprehensive Customer Data Platform Guide Optimizing Promotional Initiatives Data Collection Segmentation Activation Rules PDF is a compilation of the most recent design trends as a series of slides. It is suitable for any subject or industry presentation, containing attractive visuals and photo spots for businesses to clearly express their messages. This template contains a variety of slides for the user to input data, such as structures to contrast two elements, bullet points, and slides for written information. Slidegeeks is prepared to create an impression.

Guide To Create Advertising Campaign For Client Engagement Future Emerging Trends Of Marketing Campaigns Guidelines PDF
This slide provides an overview of the emerging trends to get greater social attention from the audience. The trends covered are video ads get shorter, live streaming is gaining momentum and Instagram stories more popular than Snapchat. The Guide To Create Advertising Campaign For Client Engagement Future Emerging Trends Of Marketing Campaigns Guidelines PDF is a compilation of the most recent design trends as a series of slides. It is suitable for any subject or industry presentation, containing attractive visuals and photo spots for businesses to clearly express their messages. This template contains a variety of slides for the user to input data, such as structures to contrast two elements, bullet points, and slides for written information. Slidegeeks is prepared to create an impression.

Business Diagram Map Shuffle Reduce Phases Shown In Big Data Analytic Processing Ppt Slide
This technology slide has been designed with graphic of map and data text. This diagram helps to depict concept of data analysis and processing. Use this diagram slide for computer technology related presentations.
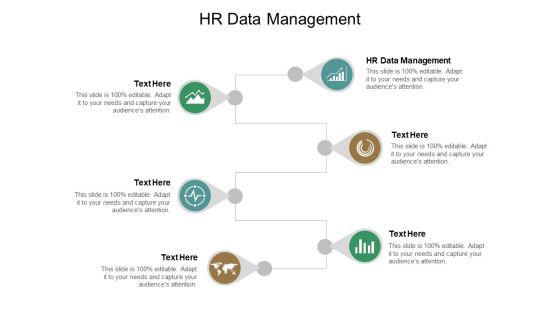
HR Data Management Ppt PowerPoint Presentation Outline Model Cpb
This is a hr data management ppt powerpoint presentation outline model cpb. This is a six stage process. The stages in this process are hr data management.
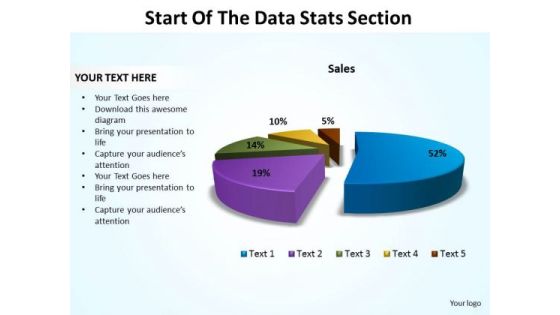
Business Marketing PowerPoint Templates Business Start Of The Data Stats Section Ppt Slides
Business Marketing PowerPoint Templates Business start of the data stats section PPT Slides-This Pie Chart is a simple template that provides a graphical, time-phased overview of a continuing sequence of stages, tasks, or events in a circular flow. You can divide a Pie Chart into segments for illustrating proportion-Business Marketing PowerPoint Templates Business start of the data stats section PPT Slides-This ppt can be used for concepts relating to-3d, Allocate, Allocation, Business, Chart, Circle, Data, Diagram, Divide, Division, Expensive, Financial, Graph Etc.
Statistical Analysis Icon Of Bar Chart Report Ppt PowerPoint Presentation Gallery Design Ideas PDF
Showcasing this set of slides titled statistical analysis icon of bar chart report ppt powerpoint presentation gallery design ideas pdf. The topics addressed in these templates are statistical analysis icon of bar chart report. All the content presented in this PPT design is completely editable. Download it and make adjustments in color, background, font etc. as per your unique business setting.
Marketers Guide To Data Analysis Optimization Tracking Social Media Engagement Rate For Improving Conversions Brochure PDF
This slide covers an overview of the social media engagement rate to identify if the content is reaching the target audience. It also includes improvement strategies such as having a consistent, authentic voice, knowing your algorithms, and creating shareable content. Do you have to make sure that everyone on your team knows about any specific topic I yes, then you should give Marketers Guide To Data Analysis Optimization Tracking Social Media Engagement Rate For Improving Conversions Brochure PDF a try. Our experts have put a lot of knowledge and effort into creating this impeccable Marketers Guide To Data Analysis Optimization Tracking Social Media Engagement Rate For Improving Conversions Brochure PDF. You can use this template for your upcoming presentations, as the slides are perfect to represent even the tiniest detail. You can download these templates from the Slidegeeks website and these are easy to edit. So grab these today.

Data Requirements For Employee Performance Analytics Graphics PDF
The following slide highlights data requirement for employee performance analysis which includes elements such as absenteeism rate, revenue per employee, overtime per employee and efficiency are along with key insights. Pitch your topic with ease and precision using this data requirements for employee performance analytics graphics pdf. This layout presents information on revenue, employee, rate. It is also available for immediate download and adjustment. So, changes can be made in the color, design, graphics or any other component to create a unique layout.

Predictive Analytics In The Age Of Big Data How Businesses Use Predictive Analytics Introduction PDF
This slide depicts the importance of predictive analytics that covers detecting fraud, improving operations, optimizing marketing campaigns, and reducing risks. Predictive analytics is being used by businesses to fix complex challenges and identify new possibilities. Do you have to make sure that everyone on your team knows about any specific topic I yes, then you should give Predictive Analytics In The Age Of Big Data How Businesses Use Predictive Analytics Introduction PDF a try. Our experts have put a lot of knowledge and effort into creating this impeccable Predictive Analytics In The Age Of Big Data How Businesses Use Predictive Analytics Introduction PDF. You can use this template for your upcoming presentations, as the slides are perfect to represent even the tiniest detail. You can download these templates from the Slidegeeks website and these are easy to edit. So grab these today.
Magnifying Glass Management Ppt PowerPoint Presentation Infographics Icons
This is a magnifying glass management ppt powerpoint presentation infographics icons. This is a three stage process. The stages in this process are magnifying glass, research, marketing, strategy, business.
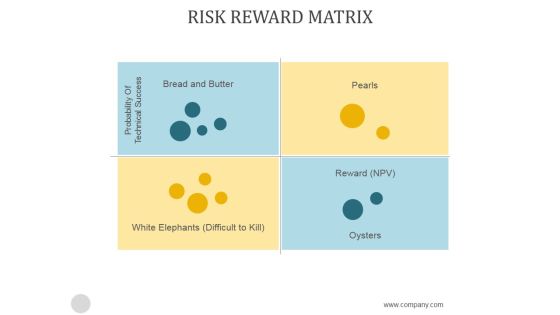
Risk Reward Matrix Template1 Ppt PowerPoint Presentation Backgrounds
This is a risk reward matrix template1 ppt powerpoint presentation backgrounds. This is a four stage process. The stages in this process are bread and butter, probability of technical success, white elephants difficult to kill, oysters, high.

Comprehensive Analysis Of Different Data Lineage Classification Benefits Of Data Lineage System Introduction PDF
This slide represents the regulatory, business and technology benefits of data lineage. The regulatory advantages include transparency, trust and business benefits caters to data governance and decision making. Technology benefits include analysis and improvements. Want to ace your presentation in front of a live audience Our Comprehensive Analysis Of Different Data Lineage Classification Benefits Of Data Lineage System Introduction PDF can help you do that by engaging all the users towards you.. Slidegeeks experts have put their efforts and expertise into creating these impeccable powerpoint presentations so that you can communicate your ideas clearly. Moreover, all the templates are customizable, and easy to edit and downloadable. Use these for both personal and commercial use.
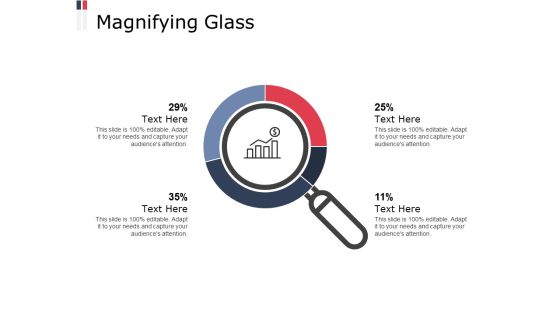
Magnifying Glass Research Planning Ppt PowerPoint Presentation Professional Influencers
Presenting this set of slides with name magnifying glass research planning ppt powerpoint presentation professional influencers. This is a four stage process. The stages in this process are magnifying glass, research, marketing, strategy, business. This is a completely editable PowerPoint presentation and is available for immediate download. Download now and impress your audience.

Kpis To Measure Performance Of Multiple Brands Ppt PowerPoint Presentation File Outline PDF
This slide showcases KPIs that can help organization to manage the performance of different brands. Metrics include customer acquisition cost, conversion rates, search traffic, landing page bounce rate, average lead score and social mentions. This Kpis To Measure Performance Of Multiple Brands Ppt PowerPoint Presentation File Outline PDF from Slidegeeks makes it easy to present information on your topic with precision. It provides customization options, so you can make changes to the colors, design, graphics, or any other component to create a unique layout. It is also available for immediate download, so you can begin using it right away. Slidegeeks has done good research to ensure that you have everything you need to make your presentation stand out. Make a name out there for a brilliant performance.

Define Quality Management System Ppt PowerPoint Presentation Picture
This is a define quality management system ppt powerpoint presentation picture. This is a one stage process. The stages in this process are quality, quality management, business.

Big Data Analytics Engineering Procedure Framework Brochure PDF
This slide showcase big data analytics processes of collecting, processing, cleansing, and analyzing datasets. It includes elements such as data sources, data pipeline, data storage, processing and data analysis Showcasing this set of slides titled Big Data Analytics Engineering Procedure Framework Brochure PDF. The topics addressed in these templates are Data Sources, Data Pipeline, Data Storage. All the content presented in this PPT design is completely editable. Download it and make adjustments in color, background, font etc. as per your unique business setting.

Example Of Good Strategic Plan Ppt PowerPoint Presentation Visual Aids Professional
Presenting this set of slides with name example of good strategic plan ppt powerpoint presentation visual aids professional. This is a five stage process. The stages in this process are 5 year business plan, business growth, strategic plan. This is a completely editable PowerPoint presentation and is available for immediate download. Download now and impress your audience.

Cluster Analysis In Marketing 9 Stages Ppt Fill The Blank Business Plan PowerPoint Slides
We present our cluster analysis in marketing 9 stages ppt fill the blank business plan PowerPoint Slides.Download and present our Flow Charts PowerPoint Templates because Our PowerPoint Templates and Slides are focused like a searchlight beam. They highlight your ideas for your target audience. Use our Process and Flows PowerPoint Templates because They will Put your wonderful verbal artistry on display. Our PowerPoint Templates and Slides will provide you the necessary glam and glitter. Use our Shapes PowerPoint Templates because They will Put your wonderful verbal artistry on display. Our PowerPoint Templates and Slides will provide you the necessary glam and glitter. Use our Circle Charts PowerPoint Templates because Our PowerPoint Templates and Slides will weave a web of your great ideas. They are gauranteed to attract even the most critical of your colleagues. Use our Marketing PowerPoint Templates because These PowerPoint Templates and Slides will give the updraft to your ideas. See them soar to great heights with ease.Use these PowerPoint slides for presentations relating to Mapping, vector, chart, flow, flowchart, process, model, step, tool, blank, processdiagram, concept, topic, presentation, relate, circle, graphic, data, report, marketing, idea, circlepattern, team, management, graph, cycle, illustration, connection, processchart,direction, plans, color, text, phase, organization, control, connect, link, explanation, mapping, present. The prominent colors used in the PowerPoint template are Blue light, White, Gray.
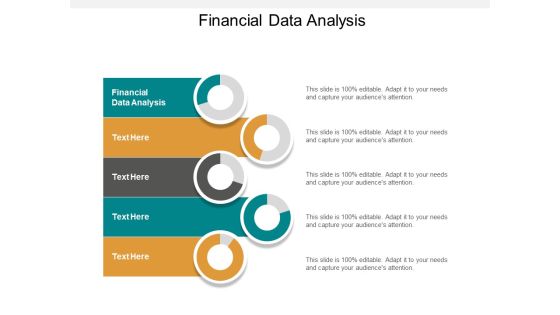
financial data analysis ppt powerpoint presentation infographics tips cpb
Presenting this set of slides with name financial data analysis ppt powerpoint presentation infographics tips cpb. This is a five stage process. The stages in this process are financial data analysis. This is a completely editable PowerPoint presentation and is available for immediate download. Download now and impress your audience.

Effective Ways To Handle Big Data And Analytics Framework Pictures PDF
Thus slide illustrates three different solutions to handle the purpose artificial intelligence ladder in analytics architecture properly. It includes elements such as hybrid data management, unified governance and integration and data science and business analytics Presenting Effective Ways To Handle Big Data And Analytics Framework Pictures PDF to dispense important information. This template comprises three stages. It also presents valuable insights into the topics including Management, Integration, Business Analytics. This is a completely customizable PowerPoint theme that can be put to use immediately. So, download it and address the topic impactfully.

Table Of Contents For Data Lake Architecture Future Of Data Analysis Rules Background PDF
Presenting Table Of Contents For Data Lake Architecture Future Of Data Analysis Rules Background PDF to provide visual cues and insights. Share and navigate important information on one stage that need your due attention. This template can be used to pitch topics like Central Repository, Concepts Of Data, Primary Components. In addtion, this PPT design contains high resolution images, graphics, etc, that are easily editable and available for immediate download.

Building Blocks For Enterprise Data Governance Icon Structure PDF
Showcasing this set of slides titled Building Blocks For Enterprise Data Governance Icon Structure PDF. The topics addressed in these templates are Building Blocks For Enterprise, Data Governance Icon. All the content presented in this PPT design is completely editable. Download it and make adjustments in color, background, font etc. as per your unique business setting.

Various Components Of Batch Processing Architecture System Microsoft PDF
Mentioned slide highlights the different components of batch processing system. Data sources, data storage, batch processing, analytical data store, analytics and reporting are some of the major components used to manager large volume of data. Showcasing this set of slides titled Various Components Of Batch Processing Architecture System Microsoft PDF. The topics addressed in these templates are Data Storage, Batch Processing, Analytical Data Store. All the content presented in this PPT design is completely editable. Download it and make adjustments in color, background, font etc. as per your unique business setting.

Data Analysis For Assessing Business Information Icon Ideas PDF
Pitch your topic with ease and precision using this data analysis for assessing business information icon ideas pdf. This layout presents information on data analysis for assessing business information icon. It is also available for immediate download and adjustment. So, changes can be made in the color, design, graphics or any other component to create a unique layout.
Vector Of Sales Planning To Ascertain Annual Financial Goals Ppt PowerPoint Presentation Icon Infographics PDF
Presenting this set of slides with name vector of sales planning to ascertain annual financial goals ppt powerpoint presentation icon infographics pdf. This is a three stage process. The stages in this process are vector of sales planning to ascertain annual financial goals. This is a completely editable PowerPoint presentation and is available for immediate download. Download now and impress your audience.

Space Emergency Response Plan Ppt PowerPoint Presentation Slides Topics Cpb
This is a space emergency response plan ppt powerpoint presentation slides topics cpb. This is a four stage process. The stages in this process are space emergency response plan.

What Is Big Data Analytics Ppt PowerPoint Presentation File Background Images PDF
This is a What Is Big Data Analytics Ppt PowerPoint Presentation File Background Images PDF template with various stages. Focus and dispense information on eight stages using this creative set, that comes with editable features. It contains large content boxes to add your information on topics like Cloud Technology, Visualization, Analysis. You can also showcase facts, figures, and other relevant content using this PPT layout. Grab it now.

Project Progress Gannt Chart Report Ppt PowerPoint Presentation Outline Images
This is a project progress gannt chart report ppt powerpoint presentation outline images. This is a eight stage process. The stages in this process are activity tracker, business, marketing.

Marketers Guide To Data Analysis Optimization Tracking Leads Generated Through Social Media Microsoft PDF
This slide covers an overview of social media leads for increasing customer conversion rates. It also includes strategies to generate more social media leads, such as optimizing your profile, using social lead ads, and offering the right incentive. Want to ace your presentation in front of a live audience Our Marketers Guide To Data Analysis Optimization Tracking Leads Generated Through Social Media Microsoft PDF can help you do that by engaging all the users towards you. Slidegeeks experts have put their efforts and expertise into creating these impeccable powerpoint presentations so that you can communicate your ideas clearly. Moreover, all the templates are customizable, and easy to edit and downloadable. Use these for both personal and commercial use.
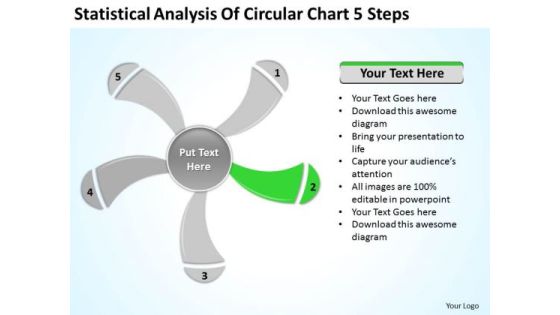
Statistical Analysis Of Circular Chart 5 Steps Ppt Business Plan PowerPoint Slide
We present our statistical analysis of circular chart 5 steps ppt business plan PowerPoint Slide.Download and present our Business PowerPoint Templates because Our PowerPoint Templates and Slides will definately Enhance the stature of your presentation. Adorn the beauty of your thoughts with their colourful backgrounds. Use our Signs PowerPoint Templates because Our PowerPoint Templates and Slides will give good value for money. They also have respect for the value of your time. Download our Shapes PowerPoint Templates because Our PowerPoint Templates and Slides team portray an attitude of elegance. Personify this quality by using them regularly. Use our Metaphors-Visual Concepts PowerPoint Templates because Our PowerPoint Templates and Slides will effectively help you save your valuable time. They are readymade to fit into any presentation structure. Use our Process and Flows PowerPoint Templates because our PowerPoint Templates and Slides are the string of your bow. Fire of your ideas and conquer the podium.Use these PowerPoint slides for presentations relating to graphically, graphic, vector, layout, business, computation, sign, infochart, visual, symbol, template, diagram, calculations, sector, data, revenue, schedule, element, analysis, drawing, report, technology, contour, classification, graph, modern, illustration, icon, comparison, object, chart, collection, science, color, growth, composition, professional, set, education, math, profits, information, symmetry, statistic, structure, infographics, button. The prominent colors used in the PowerPoint template are Green, Gray, White.
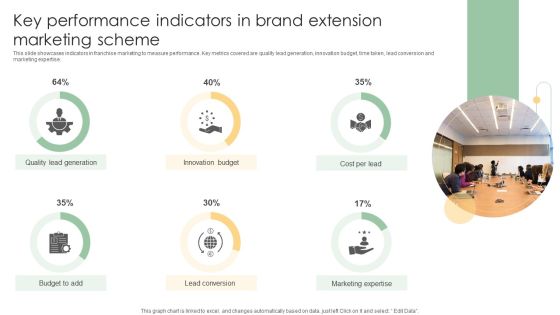
Key Performance Indicators In Brand Extension Marketing Scheme Ideas PDF
This slide showcases indicators in franchise marketing to measure performance. Key metrics covered are quality lead generation, innovation budget, time taken, lead conversion and marketing expertise.Pitch your topic with ease and precision using this Key Performance Indicators In Brand Extension Marketing Scheme Ideas PDF. This layout presents information on Quality Lead Generation, Innovation Budget, Lead Conversion. It is also available for immediate download and adjustment. So, changes can be made in the color, design, graphics or any other component to create a unique layout.

Comparison Between Data Governance And Data Stewardship Pictures PDF
This slide represents the comparison between data governance and data stewardship however, both are interconnected. Data governance describes the policies and regulations for data and data stewardship implements those policies in the organization. Here you can discover an assortment of the finest PowerPoint and Google Slides templates. With these templates, you can create presentations for a variety of purposes while simultaneously providing your audience with an eye catching visual experience. Download Comparison Between Data Governance And Data Stewardship Pictures PDF to deliver an impeccable presentation. These templates will make your job of preparing presentations much quicker, yet still, maintain a high level of quality. Slidegeeks has experienced researchers who prepare these templates and write high quality content for you. Later on, you can personalize the content by editing the Comparison Between Data Governance And Data Stewardship Pictures PDF.
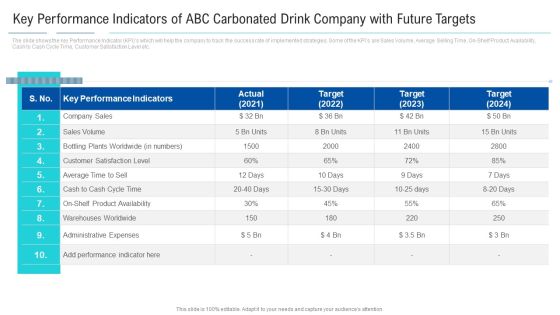
Key Performance Indicators Of ABC Carbonated Drink Company With Future Targets Introduction PDF
The slide shows the key Performance Indicator KPIs which will help the company to track the success rate of implemented strategies. Some of the KPIs are Sales Volume, Average Selling Time, On-Shelf Product Availability, Cash to Cash Cycle Time, Customer Satisfaction Level etc. Deliver an awe-inspiring pitch with this creative key performance indicators of abc carbonated drink company with future targets introduction pdf. bundle. Topics like key performance indicators, sales volume, average, warehouses worldwide, administrative expenses can be discussed with this completely editable template. It is available for immediate download depending on the needs and requirements of the user.
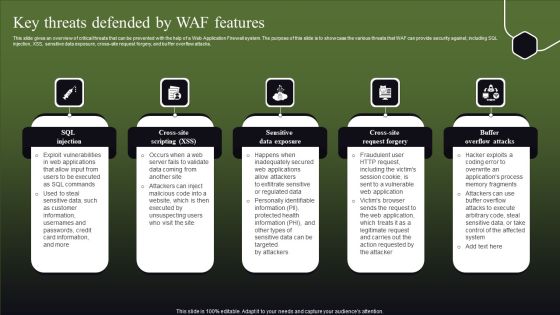
Key Threats Defended By WAF Features Ppt Pictures Elements PDF
This slide gives an overview of critical threats that can be prevented with the help of a Web Application Firewall system. The purpose of this slide is to showcase the various threats that WAF can provide security against, including SQL injection, XSS, sensitive data exposure, cross-site request forgery, and buffer overflow attacks. Explore a selection of the finest Key Threats Defended By WAF Features Ppt Pictures Elements PDF here. With a plethora of professionally designed and pre-made slide templates, you can quickly and easily find the right one for your upcoming presentation. You can use our Key Threats Defended By WAF Features Ppt Pictures Elements PDF to effectively convey your message to a wider audience. Slidegeeks has done a lot of research before preparing these presentation templates. The content can be personalized and the slides are highly editable. Grab templates today from Slidegeeks.

Business Case And Roadmap For Data Analytics Business Analysis Modification Toolkit Portrait PDF
Presenting Business Case And Roadmap For Data Analytics Business Analysis Modification Toolkit Portrait PDF to provide visual cues and insights. Share and navigate important information on five stages that need your due attention. This template can be used to pitch topics like Vision Objectives, Analytical Capabilities, Business Partners. In addtion, this PPT design contains high resolution images, graphics, etc, that are easily editable and available for immediate download.

Predictive Data Model Predictive Analytics In Identifying Prospects Faster Pictures PDF
This slide depicts how predictive analytics help identifies prospects faster in the marketing industry. It can reduce the sales cycle by better forecasting visitors behavior as they progress through the funnel. Here you can discover an assortment of the finest PowerPoint and Google Slides templates. With these templates, you can create presentations for a variety of purposes while simultaneously providing your audience with an eye-catching visual experience. Download Predictive Data Model Predictive Analytics In Identifying Prospects Faster Pictures PDF to deliver an impeccable presentation. These templates will make your job of preparing presentations much quicker, yet still, maintain a high level of quality. Slidegeeks has experienced researchers who prepare these templates and write high-quality content for you. Later on, you can personalize the content by editing the Predictive Data Model Predictive Analytics In Identifying Prospects Faster Pictures PDF.
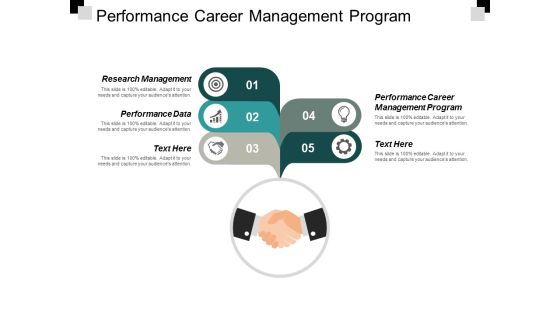
Performance Career Management Program Research Management Performance Data Ppt PowerPoint Presentation Outline Design Inspiration
This is a performance career management program research management performance data ppt powerpoint presentation outline design inspiration. This is a fivr stage process. The stages in this process are performance career management program, research management, performance data.
Risk Management Strategy Icon With Plus Symbol Ppt PowerPoint Presentation Gallery Master Slide PDF
Persuade your audience using this risk management strategy icon with plus symbol ppt powerpoint presentation gallery master slide pdf. This PPT design covers three stages, thus making it a great tool to use. It also caters to a variety of topics including risk management strategy icon with plus symbol Download this PPT design now to present a convincing pitch that not only emphasizes the topic but also showcases your presentation skills.

Storage Resource Management Ppt Slides
This is a storage resource management ppt slides. This is a one stage process. The stages in this process are data collection, analysis report generation, qsm repository, threshold checker, presentation.\n\n\n\n\n\n
Magnifying Glass Ppt PowerPoint Presentation Professional Show
This is a magnifying glass ppt powerpoint presentation professional show. This is a one stage process. The stages in this process are magnifying glass, business, management, planning, strategy, marketing.

Marketers Guide To Data Analysis Optimization Tracking Followers Count To Improve User Engagement Clipart PDF
This slide covers an overview of the follower count KPI to identify the number of users following the account on social media platforms. It also includes strategies to increase followers, such as throwing contests, posting exclusive content, and partnering with influencers. Slidegeeks is one of the best resources for PowerPoint templates. You can download easily and regulate Marketers Guide To Data Analysis Optimization Tracking Followers Count To Improve User Engagement Clipart PDF for your personal presentations from our wonderful collection. A few clicks is all it takes to discover and get the most relevant and appropriate templates. Use our Templates to add a unique zing and appeal to your presentation and meetings. All the slides are easy to edit and you can use them even for advertisement purposes.
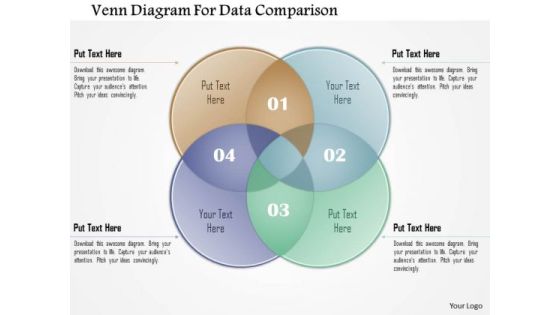
Business Diagram Venn Diagram For Data Comparison Presentation Template
Our above diagram displays venn diagrams that helps to display the interrelation of concepts by placing interrelated words in overlapping circles. This diagram helps you to communicate information visually.

Policy Support Ppt PowerPoint Presentation Background Images
This is a policy support ppt powerpoint presentation background images. This is a one stage process. The stages in this process are search, planning, management, marketing, strategy.
Magnifying Glass Ppt PowerPoint Presentation Icon
This is a magnifying glass ppt powerpoint presentation icon. This is a one stage process. The stages in this process are business, marketing, management, planning, magnifying glass.

Magnifying Glass Ppt PowerPoint Presentation Gallery Inspiration
This is a magnifying glass ppt powerpoint presentation gallery inspiration. This is a one stage process. The stages in this process are Magnifying glass, business, marketing, management, planning.

Data Audit Report With Check Mark Vector Icon Ppt PowerPoint Presentation Design Templates PDF
Presenting data audit report with check mark vector icon ppt powerpoint presentation design templates pdf to dispense important information. This template comprises three stages. It also presents valuable insights into the topics including data audit report with check mark vector icon. This is a completely customizable PowerPoint theme that can be put to use immediately. So, download it and address the topic impactfully.

IT Governance Task Allocation Report With Employee Name Ppt PowerPoint Presentation Pictures Example Introduction PDF
Showcasing this set of slides titled it governance task allocation report with employee name ppt powerpoint presentation pictures example introduction pdf. The topics addressed in these templates are objective, department, accuracy, reliability, quality assurance. All the content presented in this PPT design is completely editable. Download it and make adjustments in colour, background, font etc. as per your unique business setting.

hexagonal infographic for marketing strategy and branding ppt powerpoint presentation outline introduction pdf
Presenting this set of slides with name hexagonal infographic for marketing strategy and branding ppt powerpoint presentation outline introduction pdf. This is a seven stage process. The stages in this process are capital access, customer base, economies of scale, financial performance, human capital, market environment, marketing strategy and branding. This is a completely editable PowerPoint presentation and is available for immediate download. Download now and impress your audience.

Agency Performance Template 2 Ppt Powerpoint Presentation Slides Designs
This is a agency performance template 2 ppt powerpoint presentation slides designs. This is a four stage process. The stages in this process are tra score, viewability, brand safety, industry snapshot.
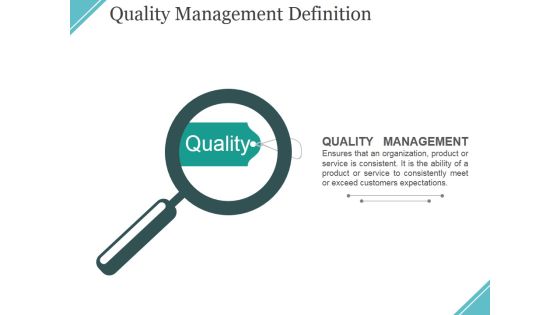
Quality Management Definition Ppt PowerPoint Presentation Model Graphics
This is a quality management definition ppt powerpoint presentation model graphics. This is a one stage process. The stages in this process are quality, management, business, marketing, communication.

Call Center Key Performance Indicators Report Ppt PowerPoint Presentation Icon Images PDF
Pitch your topic with ease and precision using this call center key performance indicators report ppt powerpoint presentation icon images pdf. This layout presents information on call center key performance indicators report. It is also available for immediate download and adjustment. So, changes can be made in the color, design, graphics or any other component to create a unique layout.
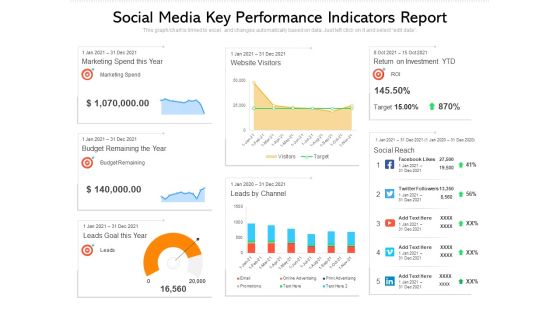
Social Media Key Performance Indicators Report Ppt PowerPoint Presentation Pictures Example File PDF
Pitch your topic with ease and precision using this social media key performance indicators report ppt powerpoint presentation pictures example file pdf. This layout presents information on social media key performance indicators report. It is also available for immediate download and adjustment. So, changes can be made in the color, design, graphics or any other component to create a unique layout.

Automated Government Procedures E Governance Website Portal Kpis Portrait PDF
This slide covers the Key performance indicators for analysing social media platforms, email campaigns and website performance. Presenting automated government procedures e governance website portal kpis portrait pdf to provide visual cues and insights. Share and navigate important information on seven stages that need your due attention. This template can be used to pitch topics like e governance website or portal kpis. In addition, this PPT design contains high-resolution images, graphics, etc, that are easily editable and available for immediate download.

Predictive Data Model Regression Model For Predictive Analytics Sample PDF
This slide represents the regression model of predictive analytics that is most commonly used in statistical analysis. This model is used to identify patterns in large amounts of data and works by calculating a formula. There are so many reasons you need a Predictive Data Model Regression Model For Predictive Analytics Sample PDF. The first reason is you can not spend time making everything from scratch, Thus, Slidegeeks has made presentation templates for you too. You can easily download these templates from our website easily.

Online Data Constraints Information Limitation Analysis For Digital Organizations Information PDF
This slide depicts the challenges faced while storing digital data. The purpose of this template is to analyze the security limitations faced in the technology industries. It also includes elements such as cyberattack, loss of devices, etc.Pitch your topic with ease and precision using this Online Data Constraints Information Limitation Analysis For Digital Organizations Information PDF. This layout presents information on Percentage Impact, Technology Industry, Security Technologies. It is also available for immediate download and adjustment. So, changes can be made in the color, design, graphics or any other component to create a unique layout.
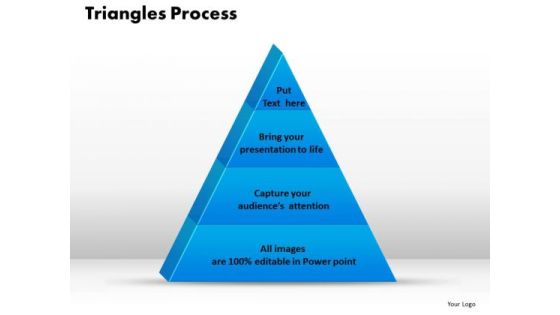
PowerPoint Template Triangle Process Diagram Ppt Presentation
PowerPoint Template triangle process Diagram PPT Presentation-This Triangle Process Graphic is an attractive template superbly designed to illustrate various components of a same process effectively.-business, chart, color, concept, conceptual, construction, corporate, creating, data, design, diagram, direction, focus, graph, group, growth, hierarchy, illustration, information, isolated, layer, layered, level, manage, management, model, object, organization, performance, population, presentation, principal, process, progress, pyramid, rank, resource, shape, stage, structure, support, symbol, top, triangle, vector-PowerPoint Template triangle process Diagram PPT Presentation

Content Analyze Data Ppt Powerpoint Presentation Outline Influencers
This is a content analyze data ppt powerpoint presentation outline influencers. This is a one stage process. The stages in this process are business, management, planning, strategy, marketing.

Data Structure And Algorithm Analysis Ppt PowerPoint Presentation Slides Graphics Design
This is a data structure and algorithm analysis ppt powerpoint presentation slides graphics design. This is a one stage process. The stages in this process are data, analysis, data science, information science.
