AI PPT Maker
Templates
PPT Bundles
Design Services
Business PPTs
Business Plan
Management
Strategy
Introduction PPT
Roadmap
Self Introduction
Timelines
Process
Marketing
Agenda
Technology
Medical
Startup Business Plan
Cyber Security
Dashboards
SWOT
Proposals
Education
Pitch Deck
Digital Marketing
KPIs
Project Management
Product Management
Artificial Intelligence
Target Market
Communication
Supply Chain
Google Slides
Research Services
 One Pagers
All Categories
-
Home
- Customer Favorites
- Executive Summary Dashboard
Executive Summary Dashboard

Calculate Facebook Key Performance Indicator The Specific Campaign Details Introduction PDF
Showcasing this set of slides titled calculate facebook key performance indicator the specific campaign details introduction pdf. The topics addressed in these templates are calculate facebook key performance indicator the specific campaign details. All the content presented in this PPT design is completely editable. Download it and make adjustments in color, background, font etc. as per your unique business setting.

Key Strategic Planning And Research Team Structure Ppt PowerPoint Presentation File Inspiration PDF
This slide provides glimpse about roles and responsibilities of strategic planning and research team with the team reporting structure. It includes team members such as strategic planning manager, financial analyst, market research analyst, business analyst, etc. Find highly impressive Key Strategic Planning And Research Team Structure Ppt PowerPoint Presentation File Inspiration PDF on Slidegeeks to deliver a meaningful presentation. You can save an ample amount of time using these presentation templates. No need to worry to prepare everything from scratch because Slidegeeks experts have already done a huge research and work for you. You need to download Key Strategic Planning And Research Team Structure Ppt PowerPoint Presentation File Inspiration PDF for your upcoming presentation. All the presentation templates are 100 percent editable and you can change the color and personalize the content accordingly. Download now.

Magnifying Glass Ppt PowerPoint Presentation Model Smartart
This is a magnifying glass ppt powerpoint presentation model smartart. This is a four stage process. The stages in this process are magnifying glass, business, marketing, management, finance.
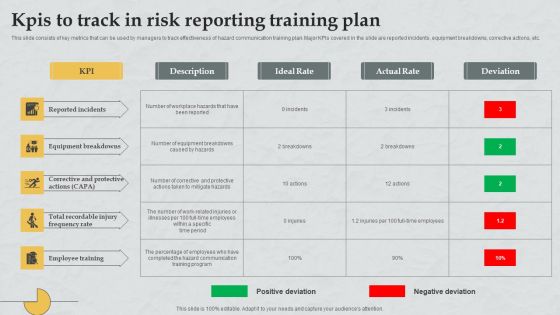
Kpis To Track In Risk Reporting Training Plan Introduction PDF
This slide consists of key metrics that can be used by managers to track effectiveness of hazard communication training plan. Major KPIs covered in the slide are reported incidents, equipment breakdowns, corrective actions, etc. Showcasing this set of slides titled Kpis To Track In Risk Reporting Training Plan Introduction PDF. The topics addressed in these templates are Reported Incidents, Equipment Breakdowns, Corrective Protective Actions. All the content presented in this PPT design is completely editable. Download it and make adjustments in color, background, font etc. as per your unique business setting.

Comprehensive Customer Data Platform Guide Optimizing Promotional Initiatives Statistics Highlighting Customer Data Template PDF
The following slide showcases the key trends of customer data platform industry to evaluate the rising demand of first party data. It includes elements such as industry revenue, software market growth, B2B and B2C customers, market size etc. Present like a pro with Comprehensive Customer Data Platform Guide Optimizing Promotional Initiatives Statistics Highlighting Customer Data Template PDF Create beautiful presentations together with your team, using our easy to use presentation slides. Share your ideas in real time and make changes on the fly by downloading our templates. So whether you are in the office, on the go, or in a remote location, you can stay in sync with your team and present your ideas with confidence. With Slidegeeks presentation got a whole lot easier. Grab these presentations today.
Project Timeline Ppt PowerPoint Presentation Icon Designs
This is a project timeline ppt powerpoint presentation icon designs. This is a six stage process. The stages in this process are project name, table, cost, data, management.
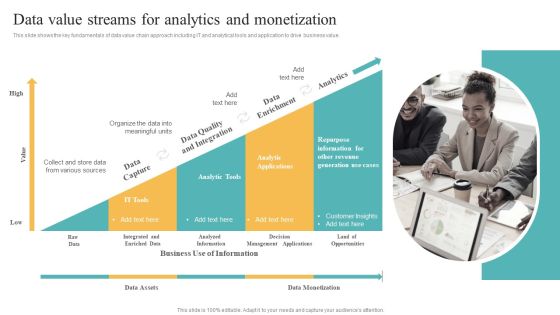
Transformation Toolkit Competitive Intelligence Information Analysis Data Value Streams For Analytics And Monetization Designs PDF
This slide shows the key fundamentals of data value chain approach including IT and analytical tools and application to drive business value. Get a simple yet stunning designed Transformation Toolkit Competitive Intelligence Information Analysis Data Value Streams For Analytics And Monetization Designs PDF. It is the best one to establish the tone in your meetings. It is an excellent way to make your presentations highly effective. So, download this PPT today from Slidegeeks and see the positive impacts. Our easy to edit Transformation Toolkit Competitive Intelligence Information Analysis Data Value Streams For Analytics And Monetization Designs PDF can be your go to option for all upcoming conferences and meetings. So, what are you waiting for Grab this template today.
PowerPoint Slide Triangle Process Graphic Ppt Designs
PowerPoint Slide triangle process Graphic PPT Designs-This Triangle Process Graphic is an attractive template superbly designed to illustrate various components of a same process effectively.-business, chart, color, concept, conceptual, construction, corporate, creating, data, design, diagram, direction, focus, graph, group, growth, hierarchy, illustration, information, isolated, layer, layered, level, manage, management, model, object, organization, performance, population, presentation, principal, process, progress, pyramid, rank, resource, shape, stage, structure, support, symbol, top, triangle, vector-PowerPoint Slide triangle process Graphic PPT Designs

Business Agenda Template 2 Ppt PowerPoint Presentation Layouts Guidelines
This is a business agenda template 2 ppt powerpoint presentation layouts guidelines. This is a three stage process. The stages in this process are agenda, planning, business, marketing, success.
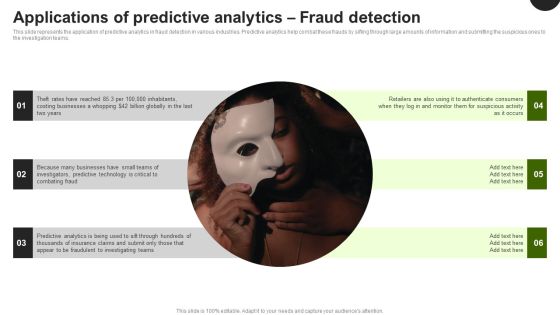
Predictive Analytics In The Age Of Big Data Applications Of Predictive Analytics Fraud Detection Formats PDF
This slide represents the application of predictive analytics in fraud detection in various industries. Predictive analytics help combat these frauds by sifting through large amounts of information and submitting the suspicious ones to the investigation teams. Boost your pitch with our creative Predictive Analytics In The Age Of Big Data Applications Of Predictive Analytics Fraud Detection Formats PDF. Deliver an awe-inspiring pitch that will mesmerize everyone. Using these presentation templates you will surely catch everyones attention. You can browse the ppts collection on our website. We have researchers who are experts at creating the right content for the templates. So you do not have to invest time in any additional work. Just grab the template now and use them.

Comprehensive Business Digitization Deck Advantage Of Big Data Analytic For Organization Sample PDF
The purpose of the following slide is to show multiple advantages that the firm can reap by using big data analytics, these benefits can be identifying and catering niche market, attaining operational agility and time reduction. Presenting comprehensive business digitization deck advantage of big data analytic for organization sample pdf to provide visual cues and insights. Share and navigate important information on four stages that need your due attention. This template can be used to pitch topics like catering niche market, operational agility, time reduction. In addtion, this PPT design contains high resolution images, graphics, etc, that are easily editable and available for immediate download.
Business Diagram Four Staged Vertical Text Box Diagram Presentation Template
This PPT slide contains the concept of business data analysis. This Power Point template slide has been designed with graphic of four staged vertical text boxes diagram. Use this PPT slide and build an innovative presentation for your viewers.
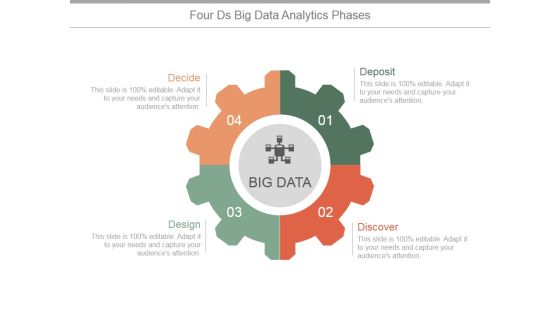
Four Ds Big Data Analytics Phases Ppt PowerPoint Presentation Shapes
This is a four ds big data analytics phases ppt powerpoint presentation shapes. This is a four stage process. The stages in this process are deposit, discover, design, decide.

Saas Application Cloud Security Infrastructure Icon Ppt PowerPoint Presentation Gallery Introduction PDF
Persuade your audience using this Saas Application Cloud Security Infrastructure Icon Ppt PowerPoint Presentation Gallery Introduction PDF. This PPT design covers four stages, thus making it a great tool to use. It also caters to a variety of topics including Saas Application, Cloud Security, Infrastructure Icon. Download this PPT design now to present a convincing pitch that not only emphasizes the topic but also showcases your presentation skills.

Application Areas Of Healthcare Data Analysis Slides PDF
This slide shows different areas of healthcare industry, where data analytics can be applied to improve quality of services. Showcasing this set of slides titled Application Areas Of Healthcare Data Analysis Slides PDF. The topics addressed in these templates are Disease Prevention, Diagnosis And Treatment, Post Care Monitoring. All the content presented in this PPT design is completely editable. Download it and make adjustments in color, background, font etc. as per your unique business setting.

Analysis Of Different Debt Collection System Ppt PowerPoint Presentation Outline Graphics Download PDF
Showcasing this set of slides titled analysis of different debt collection system ppt powerpoint presentation outline graphics download pdf. The topics addressed in these templates are invoicing options, data integration, automation. All the content presented in this PPT design is completely editable. Download it and make adjustments in color, background, font etc. as per your unique business setting.

Data Warehousing IT Data Warehouse Architecture With Staging Area Ppt Styles Objects PDF
This slide describes a data warehouse architecture with a staging area and how staging helps clean and process the information before entering it into the data warehouse. Presenting data warehousing it data warehouse architecture with staging area ppt styles objects pdf to provide visual cues and insights. Share and navigate important information on three stages that need your due attention. This template can be used to pitch topics like operational system, analysis, reporting, mining, flat files. In addtion, this PPT design contains high resolution images, graphics, etc, that are easily editable and available for immediate download.

Employee Pension Plan Ppt Powerpoint Presentation Pictures Clipart Cpb
This is a employee pension plan ppt powerpoint presentation pictures clipart cpb. This is a three stage process. The stages in this process are employee pension plan.
Quality Control Check Sheet Ppt PowerPoint Presentation Icon Vector
This is a quality control check sheet ppt powerpoint presentation icon vector. This is a seven stage process. The stages in this process are table, quality control, marketing, analysis, management.
Ways Manufacturing Data Analysis Increases Productivity And Profitability Template PDF
Persuade your audience using this Ways Manufacturing Data Analysis Increases Productivity And Profitability Template PDF. This PPT design covers four stages, thus making it a great tool to use. It also caters to a variety of topics including Increases Productivity, Manufacturing Data, Profitability. Download this PPT design now to present a convincing pitch that not only emphasizes the topic but also showcases your presentation skills.

CSR Report On Employees Statistics During Pandemic Icons PDF
This slide illustrates data related to CSR human resources of a corporation. It includes global employees, dough-nut chart of North American employees, global employees by age etc. Showcasing this set of slides titled CSR Report On Employees Statistics During Pandemic Icons PDF. The topics addressed in these templates are Global Employees, Supporting Workforce Transformation, Employees Statistics During Pandemic. All the content presented in this PPT design is completely editable. Download it and make adjustments in color, background, font etc. as per your unique business setting.
Disaster Recovery Planning Checklist Ppt Powerpoint Presentation Infographics Model Cpb
This is a disaster recovery planning checklist ppt powerpoint presentation infographics model cpb. This is a three stage process. The stages in this process are disaster recovery planning checklist.

Ml And Big Data In Information Technology Processes Global Aiops Market Slides PDF
The following slide displays a global overview of the AIOps market by region, the provided world map highlights multiple key regions such as North America, South America, APAC, Europe and Australia. Welcome to our selection of the Ml And Big Data In Information Technology Processes Global Aiops Market Slides PDF. These are designed to help you showcase your creativity and bring your sphere to life. Planning and Innovation are essential for any business that is just starting out. This collection contains the designs that you need for your everyday presentations. All of our PowerPoints are 100 percent editable, so you can customize them to suit your needs. This multi purpose template can be used in various situations. Grab these presentation templates today.

Marketing Success Metrics Key Elements Of Successful Marketing Analytics Portrait PDF
This slide covers three major components of effective market data analysis. It includes elements such as strategy to plan and run campaigns, analysis to collect and analyze relevant data, meaning to ensure data meets business goals. Boost your pitch with our creative Marketing Success Metrics Key Elements Of Successful Marketing Analytics Portrait PDF. Deliver an awe-inspiring pitch that will mesmerize everyone. Using these presentation templates you will surely catch everyones attention. You can browse the ppts collection on our website. We have researchers who are experts at creating the right content for the templates. So you dont have to invest time in any additional work. Just grab the template now and use them.
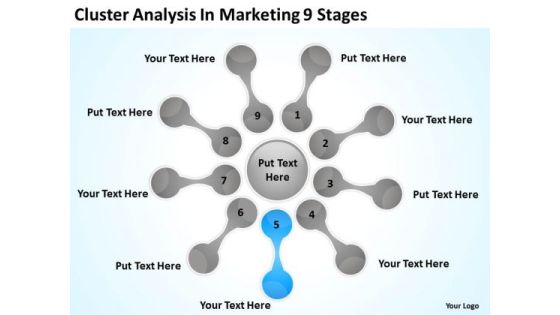
Cluster Analysis In Marketing 9 Stages Ppt Business Plan Format PowerPoint Templates
We present our cluster analysis in marketing 9 stages ppt business plan format PowerPoint templates.Download and present our Flow Charts PowerPoint Templates because Your ideas provide food for thought. Our PowerPoint Templates and Slides will help you create a dish to tickle the most discerning palate. Present our Process and Flows PowerPoint Templates because Our PowerPoint Templates and Slides help you pinpoint your timelines. Highlight the reasons for your deadlines with their use. Download and present our Shapes PowerPoint Templates because you can Break through with our PowerPoint Templates and Slides. Bring down the mental barriers of your audience. Use our Circle Charts PowerPoint Templates because Our PowerPoint Templates and Slides will let you Hit the target. Go the full distance with ease and elan. Download our Marketing PowerPoint Templates because our PowerPoint Templates and Slides will give your ideas the shape.Use these PowerPoint slides for presentations relating to Mapping, vector, chart, flow, flowchart, process, model, step, tool, blank, processdiagram, concept, topic, presentation, relate, circle, graphic, data, report, marketing, idea, circlepattern, team, management, graph, cycle, illustration, connection, processchart,direction, plans, color, text, phase, organization, control, connect, link, explanation, mapping, present. The prominent colors used in the PowerPoint template are Blue light, White, Gray.

Alliance Evaluation Magnifying Glass Ppt Layouts Graphics Tutorials PDF
Presenting this set of slides with name alliance evaluation magnifying glass ppt layouts graphics tutorials pdf. This is a three stage process. The stages in this process are magnifying glass. This is a completely editable PowerPoint presentation and is available for immediate download. Download now and impress your audience.
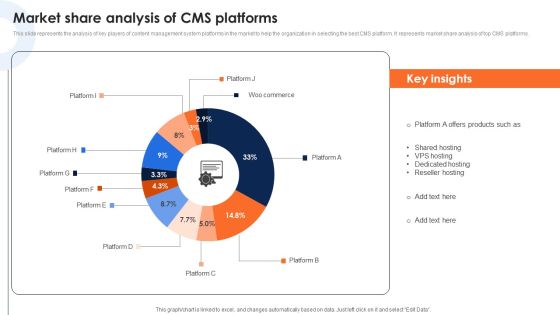
Market Share Analysis Of Cms Platforms Deploying Ecommerce Order Management Software Topics PDF
This slide represents the analysis of key players of content management system platforms in the market to help the organization in selecting the best CMS platform. It represents market share analysis of top CMS platforms.The Market Share Analysis Of Cms Platforms Deploying Ecommerce Order Management Software Topics PDF is a compilation of the most recent design trends as a series of slides. It is suitable for any subject or industry presentation, containing attractive visuals and photo spots for businesses to clearly express their messages. This template contains a variety of slides for the user to input data, such as structures to contrast two elements, bullet points, and slides for written information. Slidegeeks is prepared to create an impression.

BI Implementation To Enhance Hiring Process Business Intelligence Hybrid Architecture Framework Structure PDF
This slide represents the hybrid architecture including both technologies of data mart and OLAP cubes. It includes key recommendations such as implementation of data marts as part of data security for data aggregation etc.Slidegeeks is here to make your presentations a breeze with BI Implementation To Enhance Hiring Process Business Intelligence Hybrid Architecture Framework Structure PDF With our easy-to-use and customizable templates, you can focus on delivering your ideas rather than worrying about formatting. With a variety of designs to choose from, you are sure to find one that suits your needs. And with animations and unique photos, illustrations, and fonts, you can make your presentation pop. So whether you are giving a sales pitch or presenting to the board, make sure to check out Slidegeeks first.

Financial Enterprise Data Governance Plan Ppt Icon Visuals PDF
This slide showcases an ideal structure to utilize data within the organization to ensure security and reliability of data in enterprises according to the data usage policies and standards. The key strategies include identify data source, define data, standardize data and data handling. Persuade your audience using this Financial Enterprise Data Governance Plan Ppt Icon Visuals PDF. This PPT design covers four stages, thus making it a great tool to use. It also caters to a variety of topics including Identify Data Source, Define Data, Standardize Data, Data Handling. Download this PPT design now to present a convincing pitch that not only emphasizes the topic but also showcases your presentation skills.

Cash Flow Statement Kpis Template 1 Ppt PowerPoint Presentation Outline Deck
This is a cash flow statement kpis template 1 ppt powerpoint presentation outline deck. This is a four stage process. The stages in this process are operations, financing activities, investing activities, net increase in cash.

Oracle Cloud Competitive Analysis Based On Features Introduction PDF
This slide represents competitive analysis of oracle cloud with competitors available in market-based on certain services provided. It includes services such as analytics and BI, blockchain NFT, data management, business application, hardened compute, etc. If your project calls for a presentation, then Slidegeeks is your go-to partner because we have professionally designed, easy-to-edit templates that are perfect for any presentation. After downloading, you can easily edit Oracle Cloud Competitive Analysis Based On Features Introduction PDF and make the changes accordingly. You can rearrange slides or fill them with different images. Check out all the handy templates

Magnifying Glass Ppt PowerPoint Presentation Styles Influencers
This is a magnifying glass ppt powerpoint presentation styles influencers. This is a three stage process. The stages in this process are magnifying glass, business, marketing, management, planning.

Big Data Analytics Vector Icon Ppt PowerPoint Presentation Layouts Show
Presenting this set of slides with name big data analytics vector icon ppt powerpoint presentation layouts show. This is a three stage process. The stages in this process are marketing, management, measuring results. This is a completely editable PowerPoint presentation and is available for immediate download. Download now and impress your audience.

Technology Trend Ppt PowerPoint Presentation Styles Slideshow
This is a technology trend ppt powerpoint presentation styles slideshow. This is a three stage process. The stages in this process are business, marketing, technology x, parameters, technology xyz, technology.
Magnifying Glass Template 2 Ppt PowerPoint Presentation Pictures Deck
This is a magnifying glass template 2 ppt powerpoint presentation pictures deck. This is a one stage process. The stages in this process are business, magnifying glass, marketing, technology, planning.

Project Management Reporting Ppt PowerPoint Presentation Outline Microsoft Cpb
Presenting this set of slides with name project management reporting ppt powerpoint presentation outline microsoft cpb. This is an editable Powerpoint four stages graphic that deals with topics like project management reporting to help convey your message better graphically. This product is a premium product available for immediate download and is 100 percent editable in Powerpoint. Download this now and use it in your presentations to impress your audience.

Circular Technology Marketing Ppt Powerpoint Presentation Slides Shapes
This is a circular technology marketing ppt powerpoint presentation slides shapes. This is a four stage process. The stages in this process are marketing, business, management, planning, strategy.

Steps To Create Well Structured Business Report Ppt PowerPoint Presentation Ideas Gridlines
Presenting this set of slides with name steps to create well structured business report ppt powerpoint presentation ideas gridlines. This is a five stage process. The stages in this process are data report, infographics brochure, business statement. This is a completely editable PowerPoint presentation and is available for immediate download. Download now and impress your audience.

Trend Analysis Yearly Comparison Ppt Powerpoint Presentation Layouts Slideshow
This is a trend analysis yearly comparison ppt powerpoint presentation layouts slideshow. This is a two stage process. The stages in this process are finance, marketing, management, investment, analysis.

Cash Flow Statement Kpis Business Ppt PowerPoint Presentation Gallery Introduction
This is a cash flow statement kpis business ppt powerpoint presentation gallery introduction. This is a four stage process. The stages in this process are compare, marketing, business, management, planning.

Cross Channel Marketing Plan For Clients Magnifying Glass Ppt Portfolio Templates PDF
Presenting this set of slides with name cross channel marketing plan for clients magnifying glass ppt portfolio templates pdf. This is a seven stage process. The stages in this process are magnifying glass. This is a completely editable PowerPoint presentation and is available for immediate download. Download now and impress your audience.

Univariate Analysis Techniques For Data Visualization Introduction PDF
This slide depicts the univariate analysis technique for data visualization, including distribution, box and whisker, and the violin plot. If your project calls for a presentation, then Slidegeeks is your go to partner because we have professionally designed, easy to edit templates that are perfect for any presentation. After downloading, you can easily edit Univariate Analysis Techniques For Data Visualization Introduction PDF and make the changes accordingly. You can rearrange slides or fill them with different images. Check out all the handy templates.
Magnifying Glass Management Ppt PowerPoint Presentation Icon Images
This is a magnifying glass management ppt powerpoint presentation icon images. This is a two stage process. The stages in this process are technology, marketing, planning, business, management.
Magnifying Glass Management Ppt PowerPoint Presentation Portfolio Clipart
This is a magnifying glass management ppt powerpoint presentation portfolio clipart. This is a four stage process. The stages in this process are technology, marketing, planning, business, management.

Pyramid Showing Key Performance Indicators For Supply Chain Evaluation Ppt PowerPoint Presentation Pictures Introduction PDF
Presenting pyramid showing key performance indicators for supply chain evaluation ppt powerpoint presentation pictures introduction pdf to dispense important information. This template comprises four stages. It also presents valuable insights into the topics including inventory days of supply, customer order cycle time, cash to cash cycle time, error free order. This is a completely customizable PowerPoint theme that can be put to use immediately. So, download it and address the topic impactfully.
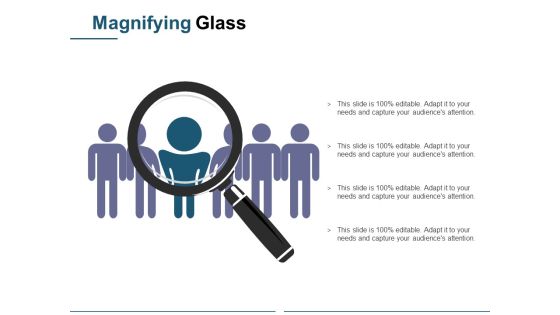
Magnifying Glass Ppt PowerPoint Presentation Infographic Template Themes
This is a magnifying glass ppt powerpoint presentation infographic template themes. This is a one stage process. The stages in this process are business, marketing, magnifying glass, management, technology.

Data Governance Plan With Server Management Vector Icon Ppt PowerPoint Presentation File Information PDF
Persuade your audience using this data governance plan with server management vector icon ppt powerpoint presentation file information pdf. This PPT design covers three stages, thus making it a great tool to use. It also caters to a variety of topics including data governance plan with server management vector icon. Download this PPT design now to present a convincing pitch that not only emphasizes the topic but also showcases your presentation skills.

Enterprise Data Governance Program For Technology Solutions Themes PDF
The mentioned slide highlights the data governance program which include business strategy, data strategy, data management and business intelligence.Pitch your topic with ease and precision using this Enterprise Data Governance Program For Technology Solutions Themes PDF This layout presents information on Business Intelligence, Management For Competitive Advantage, Business Strategy It is also available for immediate download and adjustment. So, changes can be made in the color, design, graphics or any other component to create a unique layout.

Data And Customer Analysis Company Outline Revenue TAM And Growth Rate Infographics PDF
This slide highlights the Nielsen company revenue, total addressable market, medium term growth rate, growth drivers for audience measurement, audience outcomes and Gracenote content services. Are you searching for a Data And Customer Analysis Company Outline Revenue TAM And Growth Rate Infographics PDF that is uncluttered, straightforward, and original Its easy to edit, and you can change the colors to suit your personal or business branding. For a presentation that expresses how much effort you have put in, this template is ideal. With all of its features, including tables, diagrams, statistics, and lists, its perfect for a business plan presentation. Make your ideas more appealing with these professional slides. Download Data And Customer Analysis Company Outline Revenue TAM And Growth Rate Infographics PDF from Slidegeeks today.

Big Data Analytics Lifecycle Why Big Data Management Is Important Ppt Outline Maker PDF
This slide depicts the importance of big data and how collected data will help organizations in cost-saving, time savings, new product launching, and decision making. Slidegeeks is here to make your presentations a breeze with Big Data Analytics Lifecycle Why Big Data Management Is Important Ppt Outline Maker PDF With our easy-to-use and customizable templates, you can focus on delivering your ideas rather than worrying about formatting. With a variety of designs to choose from, youre sure to find one that suits your needs. And with animations and unique photos, illustrations, and fonts, you can make your presentation pop. So whether youre giving a sales pitch or presenting to the board, make sure to check out Slidegeeks first.
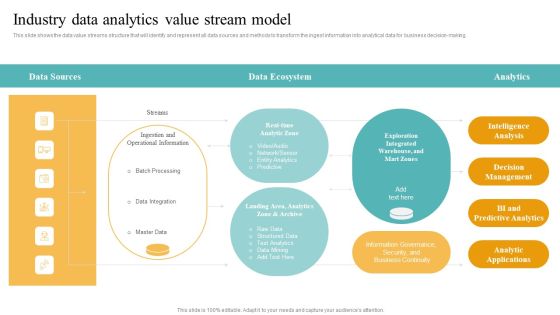
Transformation Toolkit Competitive Intelligence Information Analysis Industry Data Analytics Value Stream Model Raw Mockup PDF
This slide illustrates the workflow related to performing the data analytics project along with key responsible owners to accomplish the activities. If you are looking for a format to display your unique thoughts, then the professionally designed Transformation Toolkit Competitive Intelligence Information Analysis Industry Data Analytics Value Stream Model Raw Mockup PDF is the one for you. You can use it as a Google Slides template or a PowerPoint template. Incorporate impressive visuals, symbols, images, and other charts. Modify or reorganize the text boxes as you desire. Experiment with shade schemes and font pairings. Alter, share or cooperate with other people on your work. Download Transformation Toolkit Competitive Intelligence Information Analysis Industry Data Analytics Value Stream Model Raw Mockup PDF and find out how to give a successful presentation. Present a perfect display to your team and make your presentation unforgettable.
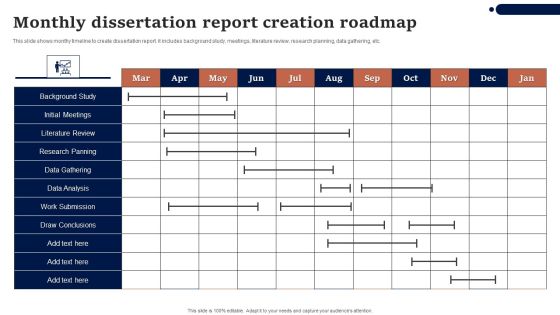
Monthly Dissertation Report Creation Roadmap Background PDF
This slide shows monthy timeline to create dissertation report. it includes background study, meetings, literature review, research planning, data gathering, etc. Pitch your topic with ease and precision using this Monthly Dissertation Report Creation Roadmap Background PDF. This layout presents information on Data Gathering, Data Analysis, Research Panning. It is also available for immediate download and adjustment. So, changes can be made in the color, design, graphics or any other component to create a unique layout.
Vector Illustration Of Holistic Approach Icon Ppt PowerPoint Presentation File Templates PDF
Persuade your audience using this vector illustration of holistic approach icon ppt powerpoint presentation file templates pdf. This PPT design covers three stages, thus making it a great tool to use. It also caters to a variety of topics including vector illustration of holistic approach icon. Download this PPT design now to present a convincing pitch that not only emphasizes the topic but also showcases your presentation skills.
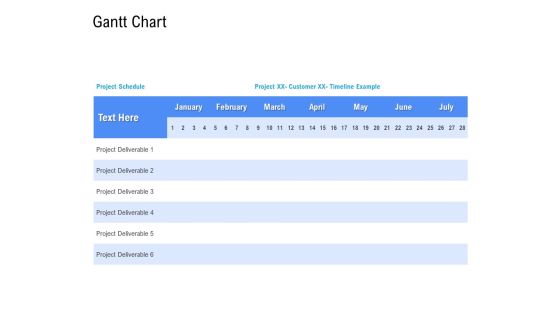
Revenue Cycle Management Deal Gantt Chart Ppt Slides Graphics Download PDF
Your complex projects can be managed and organized simultaneously using this detailed revenue cycle management deal gantt chart ppt slides graphics download pdf template. Track the milestones, tasks, phases, activities, and subtasks to get an updated visual of your project. Share your planning horizon and release plan with this well-crafted presentation template. This exemplary template can be used to plot various dependencies to distinguish the tasks in the pipeline and their impact on the schedules and deadlines of the project. Apart from this, you can also share this visual presentation with your team members and stakeholders. It a resourceful tool that can be incorporated into your business structure. Therefore, download and edit it conveniently to add the data and statistics as per your requirement.

Magnifying Glass Technology Ppt PowerPoint Presentation Diagram Templates
Presenting this set of slides with name magnifying glass technology ppt powerpoint presentation diagram templates. This is a five stage process. The stages in this process are magnifying glass, research, marketing, strategy, business. This is a completely editable PowerPoint presentation and is available for immediate download. Download now and impress your audience.

Various Power Meter Panel In Factory Control Room Ppt PowerPoint Presentation Gallery Smartart PDF
Pitch your topic with ease and precision using this various power meter panel in factory control room ppt powerpoint presentation gallery smartart pdf. This layout presents information on various power meter panel in factory control room. It is also available for immediate download and adjustment. So, changes can be made in the color, design, graphics or any other component to create a unique layout.
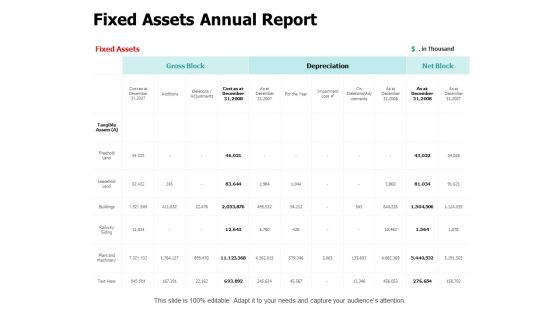
Fixed Assets Annual Report Ppt PowerPoint Presentation Outline Information
Presenting this set of slides with name fixed assets annual report ppt powerpoint presentation outline information. The topics discussed in these slides are business, management, planning, strategy, marketing. This is a completely editable PowerPoint presentation and is available for immediate download. Download now and impress your audience.

Table Of Content Template 4 Ppt PowerPoint Presentation Infographic Template
This is a table of content template 4 ppt powerpoint presentation infographic template. This is a six stage process. The stages in this process are business overview, financial performance, client and project updates, competitor s analysis, future roadmap.

DIKM Pyramid Infographics Layout Ppt PowerPoint Presentation Outline Brochure PDF
Persuade your audience using this dikm pyramid infographics layout ppt powerpoint presentation outline brochure pdf. This PPT design covers four stages, thus making it a great tool to use. It also caters to a variety of topics including wisdom, knowledge, information, data. Download this PPT design now to present a convincing pitch that not only emphasizes the topic but also showcases your presentation skills.

Warehouse Key Efficiency Indicators For Operations Management Slides PDF
This slide shows the table representing key metrics for measuring the performance of warehouse by the operations management team. It includes performance measurement of four activities of receiving, pick and pack, shipping and overall management of orders. Pitch your topic with ease and precision using this Warehouse Key Efficiency Indicators For Operations Management Slides PDF. This layout presents information on Operations Mgmt Shipping, Operations Mgmt. Receiving. It is also available for immediate download and adjustment. So, changes can be made in the color, design, graphics or any other component to create a unique layout.
