Executive Kpi

Social Platforms Data Analysis Sites Data Mining Icon Guidelines PDF
Showcasing this set of slides titled Social Platforms Data Analysis Sites Data Mining Icon Guidelines PDF. The topics addressed in these templates are Social Platforms Data Analysis, Sites Data Mining Icon. All the content presented in this PPT design is completely editable. Download it and make adjustments in color, background, font etc. as per your unique business setting.
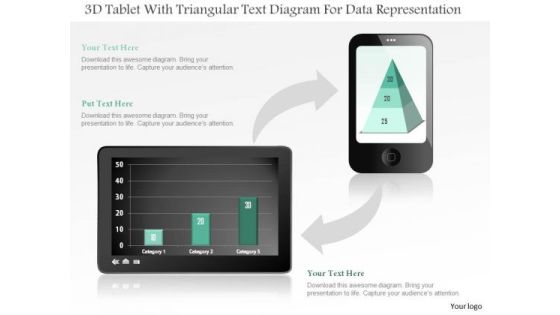
Business Diagram 3d Tablet With Triangular Text Diagram For Data Representation PowerPoint Slide
This business diagram displays bar graph on tablet and pyramid chart on mobile phone. Use this diagram, to make reports for interactive business presentations. Create professional presentations using this diagram.
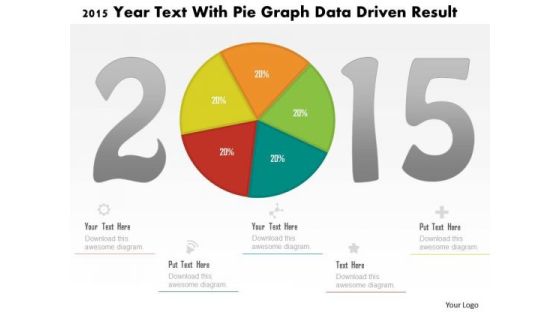
Business Diagram 2015 Year Text With Pie Graph Data Driven Result PowerPoint Slide
This business diagram displays 2015 year numbers with pie chart. This diagram is suitable to display business strategy for year 2015. Download this professional slide to present information in an attractive manner
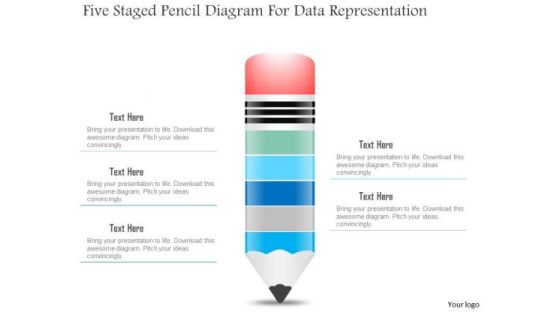
Business Diagram Five Staged Pencil Diagram For Data Representation PowerPoint Slide
This business slide displays five staged pencil diagram. It contains pencil graphic divided into five parts. This diagram slide depicts processes, stages, steps, points, options and education information display. Use this diagram, in your presentations to express your views innovatively.
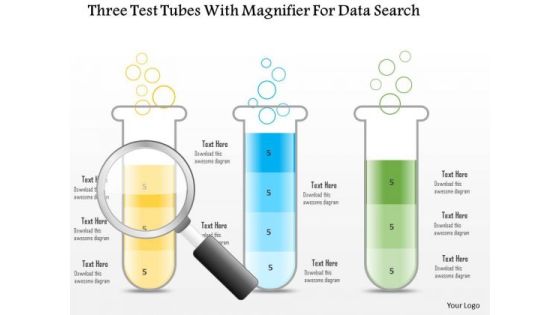
Business Diagram Three Test Tubes With Magnifier For Data Search PowerPoint Slide
This business diagram displays three test tubes with magnifying glass. This diagram is suitable to depict flow of business activities or steps. Download this professional slide to present information in an attractive manner.

Business Diagram Three Trucks For Data Representation For Business PowerPoint Slide
This business diagram displays three trucks graphic. This diagram contains trucks for percentage value growth. Use this diagram to display business growth over a period of time.
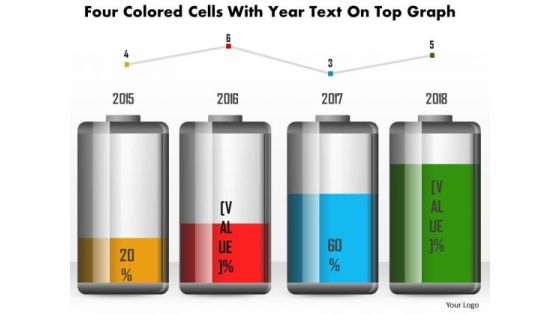
Business Diagram Four Colored Cells With Year Text On Top Graph PowerPoint Slide
This business diagram has been designed with battery cell graphic for business timeline. This slide can be used for business planning and management. Use this diagram for your business and success milestones related presentations.

Data Governance IT Data Stewardship Replication By Sector And Data Community Elements PDF
This slide shows the data stewardship replication by domain and data community. It includes the role of the data stewardship head, business leaders, data stewards, data owners, data process owners, and data custodians. Do you have to make sure that everyone on your team knows about any specific topic I yes, then you should give Data Governance IT Data Stewardship Replication By Sector And Data Community Elements PDF a try. Our experts have put a lot of knowledge and effort into creating this impeccable Data Governance IT Data Stewardship Replication By Sector And Data Community Elements PDF. You can use this template for your upcoming presentations, as the slides are perfect to represent even the tiniest detail. You can download these templates from the Slidegeeks website and these are easy to edit. So grab these today.
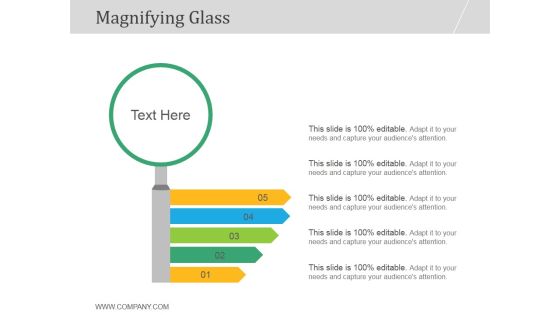
Magnifying Glass Ppt PowerPoint Presentation Deck
This is a magnifying glass ppt powerpoint presentation deck. This is a five stage process. The stages in this process are magnifying, process, marketing, success, business.

Money Investment Strategy Ppt PowerPoint Presentation Summary Example Topics Cpb
This is a money investment strategy ppt powerpoint presentation summary example topics cpb. This is a five stage process. The stages in this process are money investment strategy.

Key Performance Indicator Tree For Application Performance Management Background PDF
Persuade your audience using this key performance indicator tree for application performance management background pdf. This PPT design covers six stages, thus making it a great tool to use. It also caters to a variety of topics including collaboration platforms, competency development, knowledge management programmers. Download this PPT design now to present a convincing pitch that not only emphasizes the topic but also showcases your presentation skills.
Human Resource Management Analysis And Audit System Icon Infographics PDF
Persuade your audience using this Human Resource Management Analysis And Audit System Icon Infographics PDF. This PPT design covers three sstages, thus making it a great tool to use. It also caters to a variety of topics including Human Resource Management, Analysis And Audit System Icon. Download this PPT design now to present a convincing pitch that not only emphasizes the topic but also showcases your presentation skills.
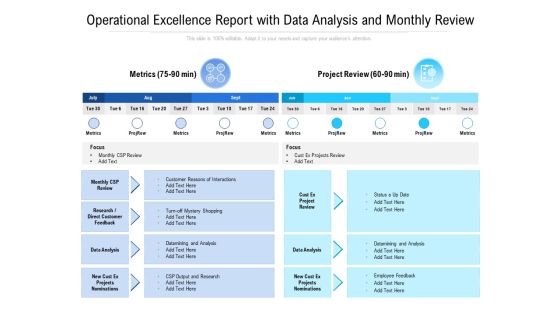
Operational Excellence Report With Data Analysis And Monthly Review Ppt PowerPoint Presentation Show Example File PDF
Presenting this set of slides with name operational excellence report with data analysis and monthly review ppt powerpoint presentation show example file pdf. The topics discussed in these slides are project review, metrics, data analysis, employee feedback, datamining and analysis, status a up date, focus. This is a completely editable PowerPoint presentation and is available for immediate download. Download now and impress your audience.

Data Representation Vector Icon Ppt PowerPoint Presentation Infographic Template Samples
Presenting this set of slides with name data representation vector icon ppt powerpoint presentation infographic template samples. This is a one stage process. The stages in this process are data visualization icon, research analysis, business focus. This is a completely editable PowerPoint presentation and is available for immediate download. Download now and impress your audience.
Visual Representation Of Data Ppt PowerPoint Presentation Icon Sample
Presenting this set of slides with name visual representation of data ppt powerpoint presentation icon sample. This is a one stage process. The stages in this process are data visualization icon, research analysis, business focus. This is a completely editable PowerPoint presentation and is available for immediate download. Download now and impress your audience.
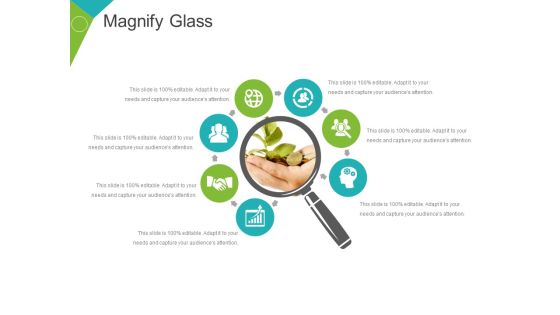
Magnify Glass Ppt PowerPoint Presentation Infographic Template Template
This is a magnify glass ppt powerpoint presentation infographic template template. This is a seven stage process. The stages in this process are magnify glass, technology, business, planning.

Hierarchy Process Ppt PowerPoint Presentation Gallery
This is a hierarchy process ppt powerpoint presentation gallery. This is a three stage process. The stages in this process are hierarchy, process, management, business, presentation, analysis, strategy.
Magnifying Glass Technologey Ppt PowerPoint Presentation Example
This is a magnifying glass technologey ppt powerpoint presentation example. This is a four stage process. The stages in this process are magnifying glass, management, marketing, business, strategy.
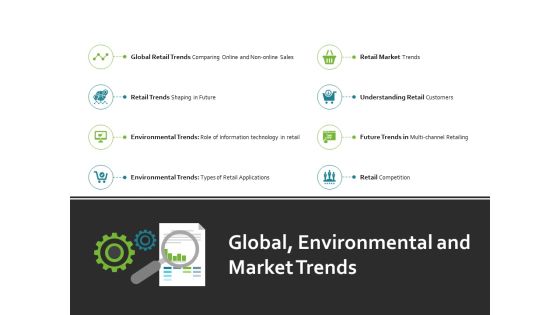
Global Environmental And Market Trends Ppt PowerPoint Presentation File Outline
This is a global environmental and market trends ppt powerpoint presentation file outline. This is a eight stage process. The stages in this process are retail competition, retail market, environmental trends, marketing, planning.
Magnifying Glass Data Analysis Ppt PowerPoint Presentation Styles Images
Presenting this set of slides with name magnifying glass data analysis ppt powerpoint presentation styles images. This is a four stage process. The stages in this process are technology, marketing, planning, business, management. This is a completely editable PowerPoint presentation and is available for immediate download. Download now and impress your audience.
Magnifier Glass Data Analysis Ppt PowerPoint Presentation Model Elements
Presenting this set of slides with name magnifier glass data analysis ppt powerpoint presentation model elements. This is a five stage process. The stages in this process are technology, marketing, planning, business, management. This is a completely editable PowerPoint presentation and is available for immediate download. Download now and impress your audience.

Magnifying Glass Big Data Analysis Ppt PowerPoint Presentation Diagram Templates
Presenting this set of slides with name magnifying glass big data analysis ppt powerpoint presentation diagram templates. This is a four stage process. The stages in this process are technology, marketing, planning, business, management. This is a completely editable PowerPoint presentation and is available for immediate download. Download now and impress your audience.
Magnifying Ppt PowerPoint Presentation Background Designs
This is a magnifying ppt powerpoint presentation background designs. This is a four stage process. The stages in this process are business, marketing, success, management, icons.

Marketing Strategy To Enhance Magnifying Glass Ppt Infographic Template Deck PDF
Do you know about Slidesgeeks Marketing Strategy To Enhance Magnifying Glass Ppt Infographic Template Deck PDF These are perfect for delivering any kind od presentation. Using it, create PowerPoint presentations that communicate your ideas and engage audiences. Save time and effort by using our pre-designed presentation templates that are perfect for a wide range of topic. Our vast selection of designs covers a range of styles, from creative to business, and are all highly customizable and easy to edit. Download as a PowerPoint template or use them as Google Slides themes.

Business Diagram Three Staged Pencil Diagram For Graph Formation PowerPoint Slide
This business diagram displays set of pencils. This Power Point template has been designed to compare and present business data. Download this diagram to represent stages of business growth.

Data Interpretation And Analysis Playbook Data Management Framework After Data Analytics Solution Structure PDF
This template illustrates the BI company data governance framework after the implementation of data science analytics solutions. It includes data discovery, data sharing, reuse of data for another insights, data acquisition etc. This is a data interpretation and analysis playbook data management framework after data analytics solution structure pdf template with various stages. Focus and dispense information on six stages using this creative set, that comes with editable features. It contains large content boxes to add your information on topics like data discovery, data sharing, data reuse, data harmonization, data translation, data acquisition. You can also showcase facts, figures, and other relevant content using this PPT layout. Grab it now.

Sustainable Energy Resources Magnifying Glass Ppt PowerPoint Presentation Gallery Inspiration PDF
Presenting Sustainable Energy Resources Magnifying Glass Ppt PowerPoint Presentation Gallery Inspiration PDF to provide visual cues and insights. Share and navigate important information on one stages that need your due attention. This template can be used to pitch topics like Magnifying Glass. In addtion, this PPT design contains high resolution images, graphics, etc, that are easily editable and available for immediate download.
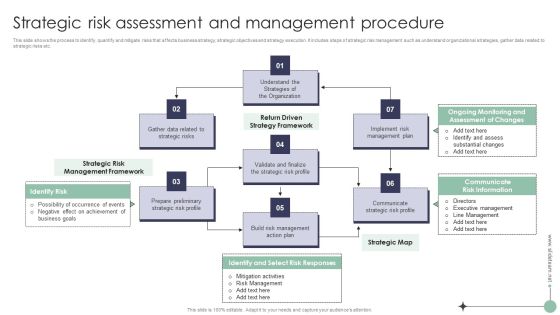
Risk Analysis And Mitigation Plan Strategic Risk Assessment And Management Procedure Background PDF
This slide shows the process to identify, quantify and mitigate risks that affects business strategy, strategic objectives and strategy execution. It includes steps of strategic risk management such as understand organizational strategies, gather data related to strategic risks etc. There are so many reasons you need a Risk Analysis And Mitigation Plan Strategic Risk Assessment And Management Procedure Background PDF. The first reason is you cant spend time making everything from scratch, Thus, Slidegeeks has made presentation templates for you too. You can easily download these templates from our website easily.

Dynamic Consumer Risk Assessment Benefits Ppt Styles Slides PDF
This slide showcases the benefits of dynamic customer risk assessment over traditional risk management. The purpose is to develop and implement appropriate risk-based procedures for continuous dynamic risk management. Presenting Dynamic Consumer Risk Assessment Benefits Ppt Styles Slides PDF to dispense important information. This template comprises THREE stages. It also presents valuable insights into the topics including Features, Dynamic Risk, Traditional Risk. This is a completely customizable PowerPoint theme that can be put to use immediately. So, download it and address the topic impactfully.

Comprehensive Analysis Of Different Data Lineage Classification Data Lineage And Data Governance Demonstration PDF
This slide represents the relationship between data lineage and data governance, including how data lineage meets the data governance objectives. Data lineage is an essential part of data governance. Slidegeeks is here to make your presentations a breeze with Comprehensive Analysis Of Different Data Lineage Classification Data Lineage And Data Governance Demonstration PDF With our easy to use and customizable templates, you can focus on delivering your ideas rather than worrying about formatting. With a variety of designs to choose from, you are sure to find one that suits your needs. And with animations and unique photos, illustrations, and fonts, you can make your presentation pop. So whether you are giving a sales pitch or presenting to the board, make sure to check out Slidegeeks first
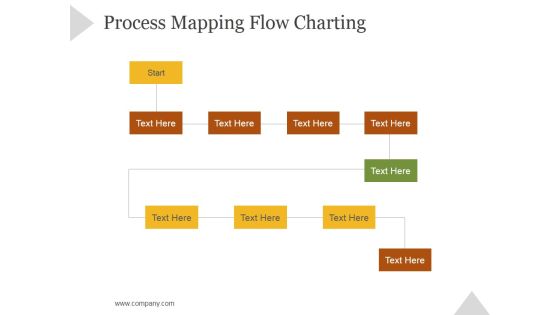
Process Mapping Flow Charting Ppt PowerPoint Presentation Slide Download
This is a process mapping flow charting ppt powerpoint presentation slide download. This is a ten stage process. The stages in this process are business, strategy, marketing, success, growth strategy, flowchart.

Competitive Analysis Techniques Ppt Powerpoint Images
This is a competitive analysis techniques ppt powerpoint images. This is a six stage process. The stages in this process are competitor analysis, distribution, success, innovation, benefits, research, customer.

Administered Data And Analytic Quality Playbook Business Intelligence And Predictive Download PDF
This template covers the problems while implementing BI and predictive analytics in the organization. The challenges are undefined KPIs and metrics, and unable to hire right data science talent. Deliver and pitch your topic in the best possible manner with this Administered Data And Analytic Quality Playbook Business Intelligence And Predictive Download PDF Use them to share invaluable insights on Common Misconception, Operationalizing, Production Deployment and impress your audience. This template can be altered and modified as per your expectations. So, grab it now.

Rebranding Brand Fresh Face Development Case Study Brand Reboot For Improved Inspiration PDF
This slide provides information regarding case study showcasing brand reboot for improved performance management. It includes details about goal, existing brand perception, initiatives, duration, etc. Slidegeeks has constructed Rebranding Brand Fresh Face Development Case Study Brand Reboot For Improved Inspiration PDF after conducting extensive research and examination. These presentation templates are constantly being generated and modified based on user preferences and critiques from editors. Here, you will find the most attractive templates for a range of purposes while taking into account ratings and remarks from users regarding the content. This is an excellent jumping-off point to explore our content and will give new users an insight into our top-notch PowerPoint Templates.
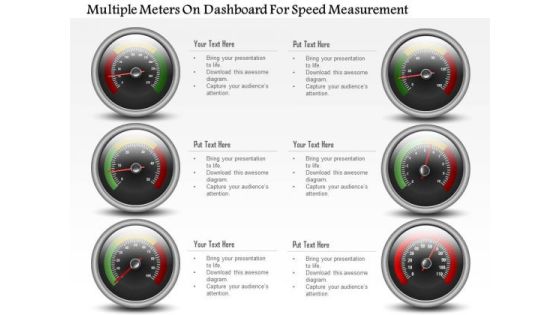
Business Diagram Multiple Meters On Dashboard For Speed Measurement PowerPoint Slide
This business diagram has been designed with multiple meters on dashboard. This slide can be used for business planning and progress. Use this diagram for your business and success milestones related presentations.

Analysis Techniques For Sales Growth Sales Target Metrics Pictures PDF
This slide presents multiple techniques to analyse Sales Target Metrics for sales growth helpful to investigate underlying data and look for efficiencies. It includes methods such as net working capital, sales growth, affordable growth rate and break even percentage that can prove to be highly effective. Presenting Analysis Techniques For Sales Growth Sales Target Metrics Pictures PDF to dispense important information. This template comprises four stages. It also presents valuable insights into the topics including Net Working Capital, Affordable Growth Rate, Break Even Percentage. This is a completely customizable PowerPoint theme that can be put to use immediately. So, download it and address the topic impactfully.
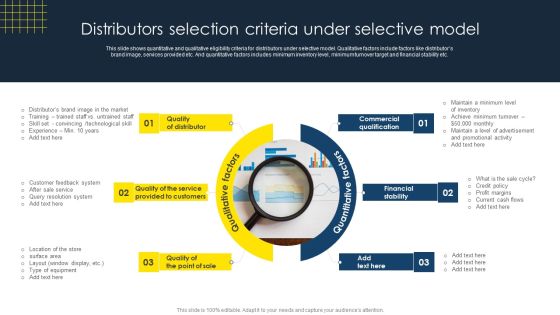
Optimize Business Sales Distributors Selection Criteria Under Selective Model Structure PDF
This slide shows quantitative and qualitative eligibility criteria for distributors under selective model. Qualitative factors include factors like distributors brand image, services provided etc. And quantitative factors includes minimum inventory level, minimum turnover target and financial stability etc. This Optimize Business Sales Distributors Selection Criteria Under Selective Model Structure PDF from Slidegeeks makes it easy to present information on your topic with precision. It provides customization options, so you can make changes to the colors, design, graphics, or any other component to create a unique layout. It is also available for immediate download, so you can begin using it right away. Slidegeeks has done good research to ensure that you have everything you need to make your presentation stand out. Make a name out there for a brilliant performance.
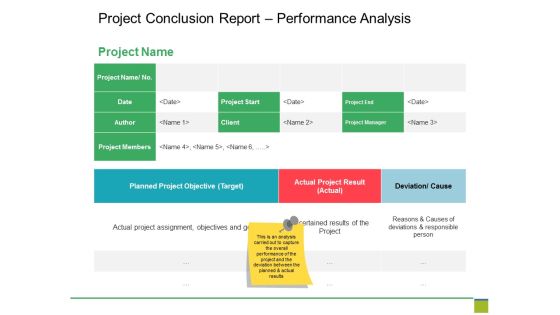
Project Conclusion Report Performance Analysis Ppt PowerPoint Presentation Inspiration Display
This is a project conclusion report performance analysis ppt powerpoint presentation inspiration display. This is a three stage process. The stages in this process are date, planned project objective, actual project result, project members, project start.

Personal Data Visualization On Computer Screen Ppt PowerPoint Presentation Show Layout Ideas
Presenting this set of slides with name personal data visualization on computer screen ppt powerpoint presentation show layout ideas. This is a one stage process. The stages in this process are data visualization icon, research analysis, business focus. This is a completely editable PowerPoint presentation and is available for immediate download. Download now and impress your audience.
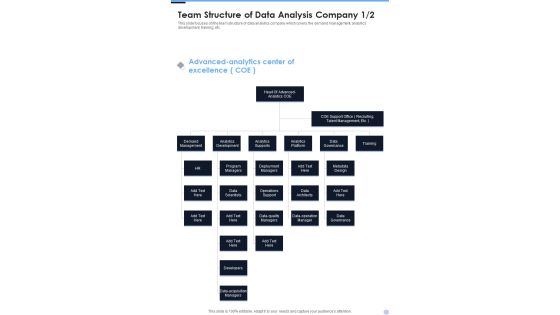
Proposal For Data Analysis In Research Project Team Structure Of Data Analysis Company One Pager Sample Example Document
Presenting you an exemplary Proposal For Data Analysis In Research Project Team Structure Of Data Analysis Company One Pager Sample Example Document. Our one-pager comprises all the must-have essentials of an inclusive document. You can edit it with ease, as its layout is completely editable. With such freedom, you can tweak its design and other elements to your requirements. Download this Proposal For Data Analysis In Research Project Team Structure Of Data Analysis Company One Pager Sample Example Document brilliant piece now.
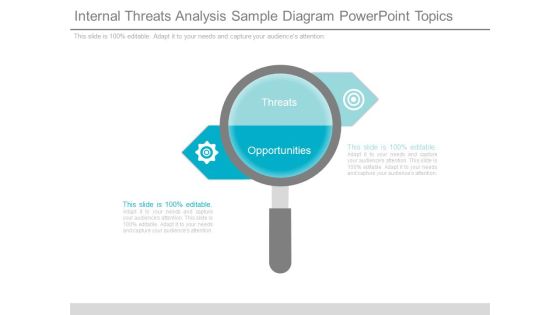
Internal Threats Analysis Sample Diagram Powerpoint Topics
This is a Internal Threats Analysis Sample Diagram Powerpoint Topics. This is a two stage process. The stages in this process are threats, opportunities.
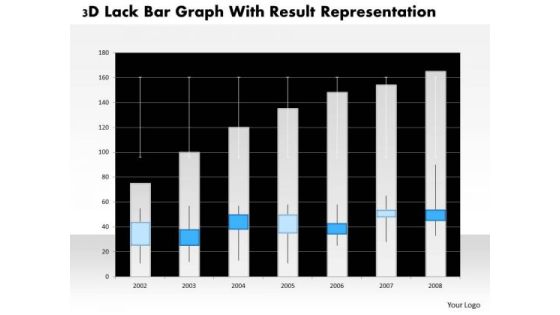
Business Diagram 3d Lack Bar Graph With Result Representation PowerPoint Slide
This business diagram has graphic of 3d lack bar graph. This diagram is a data visualization tool that gives you a simple way to present statistical information. This slide helps your audience examine and interpret the data you present.

Business Diagram Battery Connected With Bulb For Idea Generation PowerPoint Slide
This business slide displays battery icon connected with bulb. This diagram is a data visualization tool that gives you a simple way to present statistical information. This slide helps your audience examine and interpret the data you present.

Work Breakdown Structure Ppt PowerPoint Presentation Slides
This is a work breakdown structure ppt powerpoint presentation slides. This is a five stage process. The stages in this process are project management, scope narrative, deliverable structure, flow diagram, schedule, budget.

Activity Analysis Ppt PowerPoint Presentation Professional Picture
This is a activity analysis ppt powerpoint presentation professional picture. This is a one stage process. The stages in this process are survey, customer surveys, product testers, acquisition, idea collection.

Activity Analysis Ppt PowerPoint Presentation File Outfit
This is a activity analysis ppt powerpoint presentation file outfit. This is a one stage process. The stages in this process are survey, customer video contest, customer surveys, product testers, acquisition.

Cloud Computing Data Performance Gap Analysis Icon Microsoft PDF
Persuade your audience using this Cloud Computing Data Performance Gap Analysis Icon Microsoft PDF. This PPT design covers three stages, thus making it a great tool to use. It also caters to a variety of topics including Cloud Computing Data, Performance Gap Analysis Icon. Download this PPT design now to present a convincing pitch that not only emphasizes the topic but also showcases your presentation skills.

Business Diagram Five Staged Timeline Diagram For Business PowerPoint Slide
This PowerPoint template displays five points timeline diagram. This business diagram has been designed with graphic of timeline with five points, text space and start, end points. Use this diagram, in your presentations to display process steps, stages, timelines and business management. Make wonderful presentations using this business slide.

Business Diagram Human Mind Diagram With Pie Graph For Representation PowerPoint Slide
This diagram displays human face graphic divided into sections. This section can be used for data display. Use this diagram to build professional presentations for your viewers.

Business Diagram Six Staged Pie Charts For Text Representation PowerPoint Slide
This slide displays graphic six staged pie charts. Download this diagram to present and compare business data. Use this diagram to display business process workflows in any presentation.

Human Resources Planning Development Methods Ppt PowerPoint Presentation Complete Deck With Slides
This is a human resources planning development methods ppt powerpoint presentation complete deck with slides. This is a one stage process. The stages in this process are finance, data analysis, graph representation, planning, process.
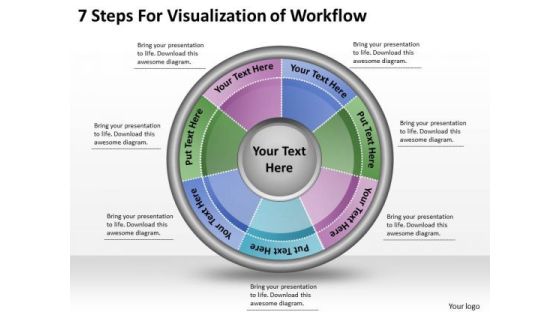
Timeline Ppt Template 7 Steps For Visualization Of Workflow
Get The Domestics Right With Our Timeline Ppt Template 7 Steps For Visualization Of Workflow Powerpoint Templates. Create The Base For Thoughts To Grow.
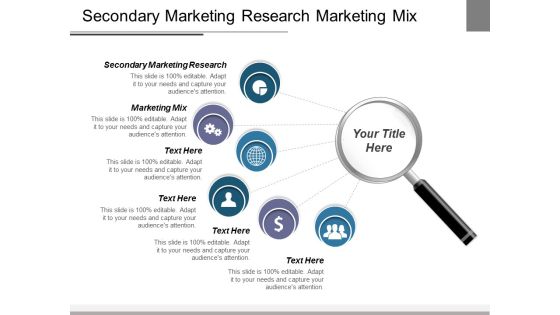
Secondary Marketing Research Marketing Mix Ppt PowerPoint Presentation Model Show
This is a secondary marketing research marketing mix ppt powerpoint presentation model show. This is a six stage process. The stages in this process are secondary marketing research, marketing mix.

Magnify Glass Research Ppt PowerPoint Presentation Styles Gallery
This is a magnify glass research ppt powerpoint presentation styles gallery. This is a three stage process. The stages in this process are magnifying glass, research, marketing, strategy, business.
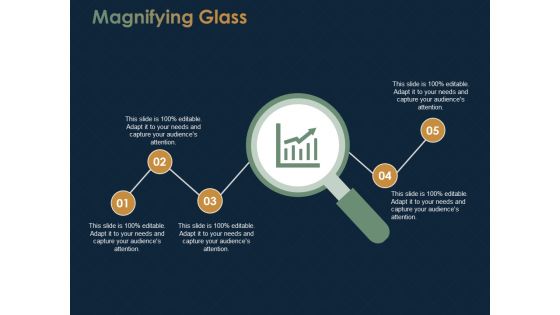
Magnifying Glass Research Ppt PowerPoint Presentation Gallery Clipart Images
This is a magnifying glass research ppt powerpoint presentation gallery clipart images. This is a five stage process. The stages in this process are magnifying glass, research, marketing, strategy, business.
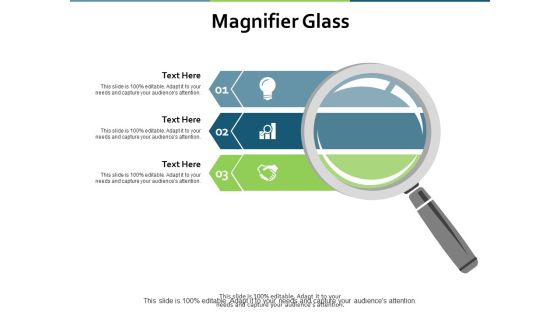
Magnifier Glass Research Ppt PowerPoint Presentation Layouts Templates
This is a magnifier glass research ppt powerpoint presentation layouts templates. This is a three stage process. The stages in this process are magnifying glass, research, marketing, strategy, business.

Compensation Structure Ppt PowerPoint Presentation Styles Graphics Example Cpb
This is a compensation structure ppt powerpoint presentation styles graphics example cpb. This is a three stage process. The stages in this process are compensation structure.

Employee Kip Ppt PowerPoint Presentation Ideas Clipart Images Cpb
This is a employee kip ppt powerpoint presentation ideas clipart images cpb. This is a six stage process. The stages in this process are employee kip.

Business Strategy Service Ppt PowerPoint Presentation Pictures Background Images Cpb
This is a business strategy service ppt powerpoint presentation pictures background images cpb. This is a five stage process. The stages in this process are business strategy service.

Network Marketing Businesses Ppt PowerPoint Presentation Professional Grid Cpb
This is a network marketing businesses ppt powerpoint presentation professional grid cpb. This is a six stage process. The stages in this process are network marketing businesses.

 Home
Home