Executive Kpi
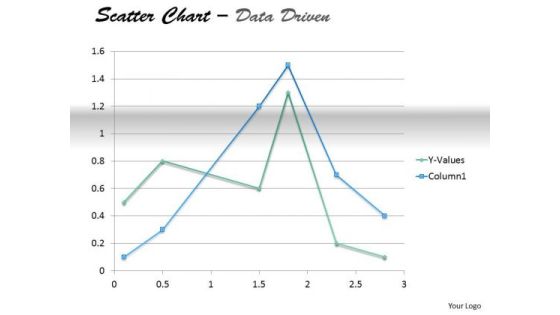
Examples Of Data Analysis Market Driven Present In Scatter Chart PowerPoint Slides Templates
Your Thoughts Will Take To Our examples of data analysis market driven present in scatter chart powerpoint slides Templates Like A Duck To Water. They Develop A Binding Affinity.

Customer Data Analysis Matrix For Assessment Of Sales Channel Template PDF
This slide shows the win loss analysis matrix for the assessment of best sales channel in terms of development resources and costs and revenue potential. Presenting customer data analysis matrix for assessment of sales channel template pdf to dispense important information. This template comprises four stages. It also presents valuable insights into the topics including customer data analysis matrix for assessment of sales channel. This is a completely customizable PowerPoint theme that can be put to use immediately. So, download it and address the topic impactfully.

Business Diagram Data Visualization Workflow From Data Access To Graphs Ppt Slide
Graphic of workflow has been used to design this diagram. This diagram slide depicts the concept of data visualization from data access. This diagrams suitable for technology and internet related presentations.

Big Data Software Application Brain Diagram Ppt PowerPoint Presentation Slides
This is a big data software application brain diagram ppt powerpoint presentation slides. This is a one stage process. The stages in this process are big data, communication, business, marketing, idea.
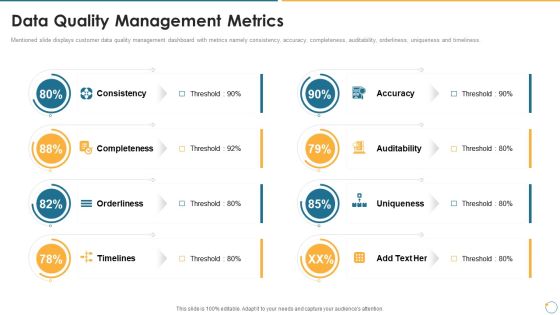
Collection Of Quality Assurance PPT Data Quality Management Metrics Information PDF
Mentioned slide displays customer data quality management dashboard with metrics namely consistency, accuracy, completeness, auditability, orderliness, uniqueness and timeliness. This is a collection of quality assurance ppt data quality management metrics information pdf template with various stages. Focus and dispense information on eight stages using this creative set, that comes with editable features. It contains large content boxes to add your information on topics like accuracy, auditability, consistency, completeness, uniqueness. You can also showcase facts, figures, and other relevant content using this PPT layout. Grab it now.

Data Collection And Analysis Flow Chart Ppt PowerPoint Presentation Sample
This is a data collection and analysis flow chart ppt powerpoint presentation sample. This is a five stage process. The stages in this process are business, strategy, marketing, process, growth strategy, finance.

Companies Branding Analysis Ppt Sample
This is a companies branding analysis ppt sample. This is a five stage process. The stages in this process are growth, loyalty, success, sales, customer.
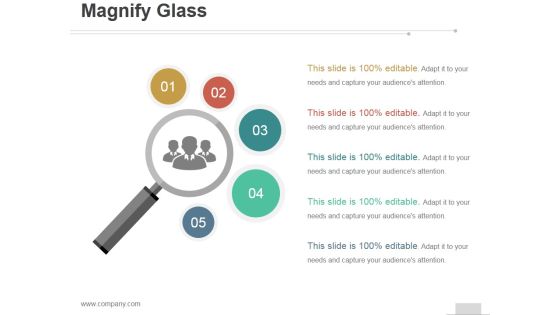
Magnify Glass Ppt PowerPoint Presentation Influencers
This is a magnify glass ppt powerpoint presentation influencers. This is a five stage process. The stages in this process are business, marketing, success, searching, strategy.
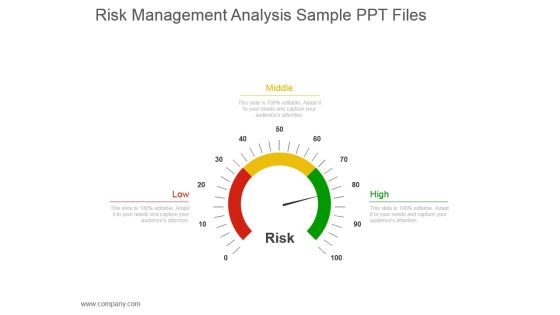
Risk Management Analysis Sample Ppt Files
This is a risk management analysis sample ppt files. This is a three stage process. The stages in this process are middle, low, high, risk.
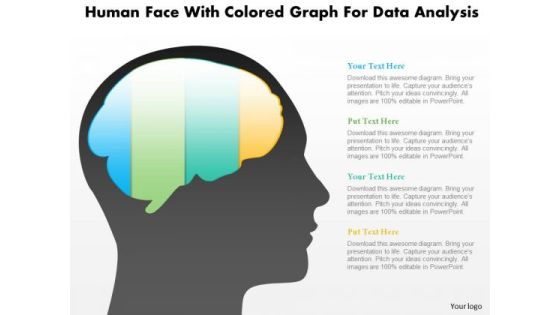
Business Diagram Human Face With Colored Graph For Data Analysis PowerPoint Slide
This diagram displays human face graphic with colored graph. This diagram can be used to represent strategy, planning, thinking of business plan. Display business options in your presentations by using this creative diagram.

Cyber Security Administration In Organization Cyber Threats Management Dashboard Formats PDF
This slide portrays information regarding the dashboard that firm will use to manage cyber threats. The dashboard will provide clear picture of threats risks prevailing and how they are treated to technical engineers and board level executives. Deliver an awe inspiring pitch with this creative cyber security administration in organization cyber threats management dashboard formats pdf bundle. Topics like cyber threats management dashboard can be discussed with this completely editable template. It is available for immediate download depending on the needs and requirements of the user.
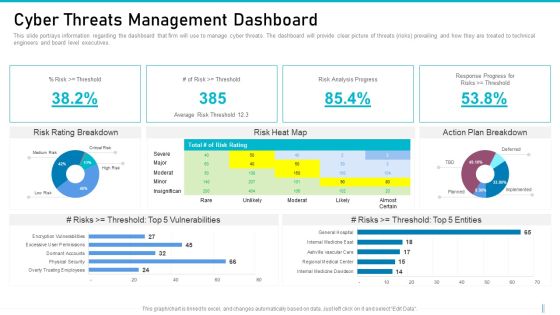
Risk Management For Organization Essential Assets Cyber Threats Management Dashboard Graphics PDF
This slide portrays information regarding the dashboard that firm will use to manage cyber threats. The dashboard will provide clear picture of threats risks prevailing and how they are treated to technical engineers and board level executives. Deliver and pitch your topic in the best possible manner with this risk management for organization essential assets cyber threats management dashboard graphics pdf. Use them to share invaluable insights on risk analysis, vulnerabilities, entities and impress your audience. This template can be altered and modified as per your expectations. So, grab it now.
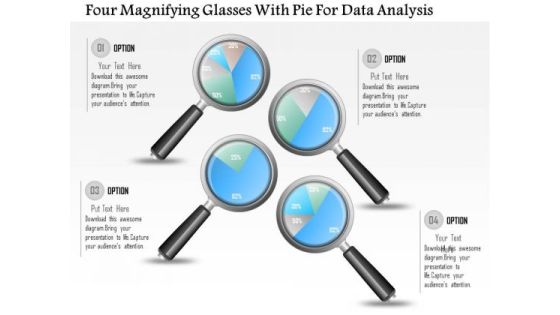
Business Diagram Four Magnifying Glasses With Pie For Data Analysis PowerPoint Slide
This business diagram displays graphic of pie charts in shape of magnifying glasses This business slide is suitable to present and compare business data. Use this diagram to build professional presentations for your viewers.
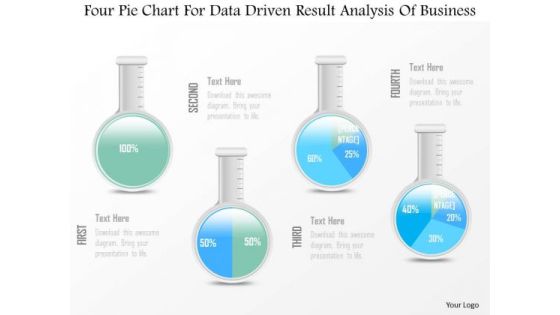
Business Diagram Four Pie Chart For Data Driven Result Analysis Of Business PowerPoint Slide
This business diagram displays graphic of pie charts in shape of flasks. This business slide is suitable to present and compare business data. Use this diagram to build professional presentations for your viewers.

Customer Satisfaction Data Insights Dashboard Ideas PDF
The following slide highlights the key metrics of the customer satisfaction survey conducted to measure and enhance the user experience. It includes satisfaction, recommendation rate, customers professional background and reviews. Showcasing this set of slides titled Customer Satisfaction Data Insights Dashboard Ideas PDF. The topics addressed in these templates are Recommendation Rate, Customer Satisfaction Rate, Customer Professional Background. All the content presented in this PPT design is completely editable. Download it and make adjustments in color, background, font etc. as per your unique business setting.
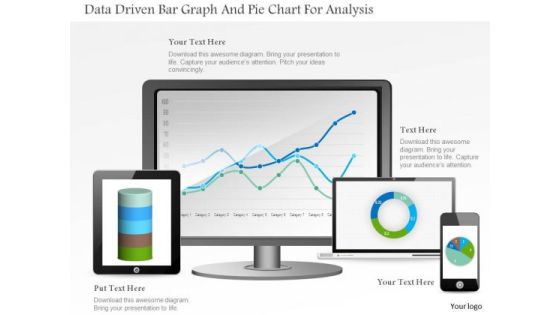
Business Diagram Data Driven Bar Graph And Pie Chart For Analysis PowerPoint Slide
This PowerPoint template displays technology gadgets with various business charts. Use this diagram slide, in your presentations to make business reports for statistical analysis. You may use this diagram to impart professional appearance to your presentations.

Big Data Processing Application Ppt PowerPoint Presentation Shapes
This is a big data processing application ppt powerpoint presentation shapes. This is a two stage process. The stages in this process are small data, big data, low volumes, batch velocities, structured varieties, into petabyte volumes.

Data And Analytics Ppt PowerPoint Presentation Icon Layouts Cpb
This is a data and analytics ppt powerpoint presentation icon layouts cpb. This is a five stage process. The stages in this process are data and analytics.
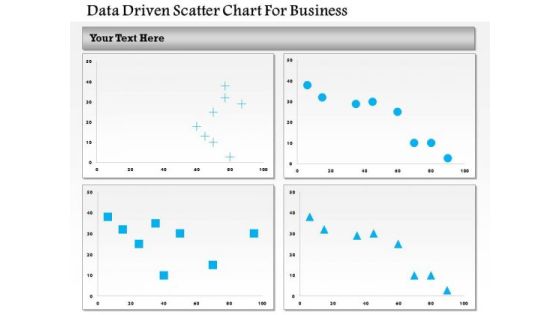
Business Diagram Data Driven Scatter Chart For Business PowerPoint Slide
This business diagram has been designed with four comparative charts. This slide suitable for data representation. You can also use this slide to present business analysis and reports. Use this diagram to present your views in a wonderful manner.
Magnifying Glass Ppt PowerPoint Presentation Outline Clipart Images
This is a magnifying glass ppt powerpoint presentation outline clipart images. This is a one stage process. The stages in this process are business, marketing, success, data analysis, technology.

Marketers Guide To Data Analysis Optimization Major Types Of Marketing Analytics Models Microsoft PDF
This slide covers three types of models to conduct marketing analytics. The mentioned models are descriptive models to identify what happened, predictive models to know what will happen, and prescriptive models to determine how to make it happen. Take your projects to the next level with our ultimate collection of Marketers Guide To Data Analysis Optimization Major Types Of Marketing Analytics Models Microsoft PDF. Slidegeeks has designed a range of layouts that are perfect for representing task or activity duration, keeping track of all your deadlines at a glance. Tailor these designs to your exact needs and give them a truly corporate look with your own brand colors they will make your projects stand out from the rest.

Data Analytics Management Big Data Types Unstructured Data Brochure PDF
This slide depicts the unstructured data form of big data and how it can be any form such as videos, audio, likes, and comments. Deliver and pitch your topic in the best possible manner with this Data Analytics Management Big Data Types Unstructured Data Brochure PDF. Use them to share invaluable insights on Unorganized Information, Format Collected, Document Stored and impress your audience. This template can be altered and modified as per your expectations. So, grab it now.

Annual Financial Budget Analysis Example Of Ppt
This is a annual financial budget analysis example of ppt. This is a five stage process. The stages in this process are business, strategy, finance, planning, compare.

Data Interpretation And Analysis Playbook How To Overcome Analytics From All The Data At Scale Challenges Designs PDF
This template illustrates that the high-performance computation engine of the analytics software company, the data platform connects to various data sources, automates the data preparation workflow, and scales to big data scenarios. This is a data interpretation and analysis playbook how to overcome analytics from all the data at scale challenges designs pdf template with various stages. Focus and dispense information on three stages using this creative set, that comes with editable features. It contains large content boxes to add your information on topics like marketing, analysis, capabilities, service, databases, sources. You can also showcase facts, figures, and other relevant content using this PPT layout. Grab it now.

Customer Centric Business Model Ppt Presentation
This is a customer centric business model ppt presentation. This is a four stage process. The stages in this process are success, arrows, business.
Target Market Assessment Analysis Icon Mockup PDF
Persuade your audience using this Target Market Assessment Analysis Icon Mockup PDF. This PPT design covers four stages, thus making it a great tool to use. It also caters to a variety of topics including Target Market Assessment, Analysis Icon. Download this PPT design now to present a convincing pitch that not only emphasizes the topic but also showcases your presentation skills.

Business Process Impact Analysis Icon Demonstration PDF
Persuade your audience using this Business Process Impact Analysis Icon Demonstration PDF. This PPT design covers three stages, thus making it a great tool to use. It also caters to a variety of topics including Business Process, Impact Analysis Icon. Download this PPT design now to present a convincing pitch that not only emphasizes the topic but also showcases your presentation skills.
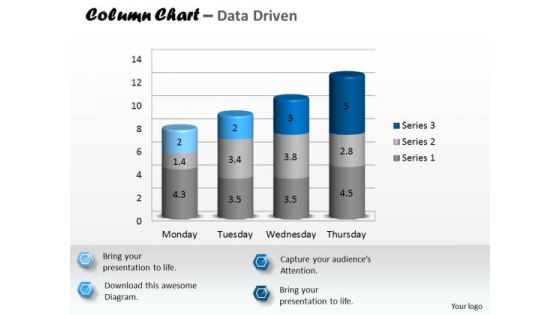
Data Analysis In Excel 3d Column Chart To Represent Information PowerPoint Templates
Rake In The Dough With

Multivariate Data Analysis Driven Line Chart For Market Survey PowerPoint Slides Templates
Rake In The Dough With

Flowchart For Quantitative Data Analysis Collection And Analysis Professional PDF
This slide presents a flowchart for qualitative and quantitative data collection and analysis to examine certain findings in the process. It includes stages such as qualitative and quantitative data collection, analyzation and interpretation. Presenting Flowchart For Quantitative Data Analysis Collection And Analysis Professional PDF to dispense important information. This template comprises one stages. It also presents valuable insights into the topics including Interpretation Results, Analyze Qualitative Data, Collect Qualitative Data. This is a completely customizable PowerPoint theme that can be put to use immediately. So, download it and address the topic impactfully.

Computer Screen With Cloud Icon Ppt PowerPoint Presentation Outline Designs
Presenting this set of slides with name computer screen with cloud icon ppt powerpoint presentation outline designs. This is a three stage process. The stages in this process are data visualization icon, research analysis, business focus. This is a completely editable PowerPoint presentation and is available for immediate download. Download now and impress your audience.

Cost Comparison Analysis Powerpoint Slide Deck
This is a cost comparison analysis powerpoint slide deck. This is a two stage process. The stages in this process are cost comparison, business, strategy, marketing.
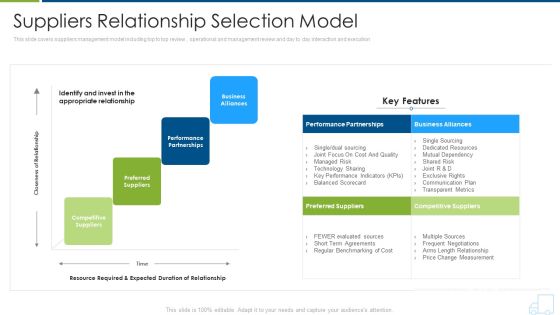
Distributor Strategy Suppliers Relationship Selection Model Diagrams PDF
This slide covers suppliers management model including top to top review , operational and management review and day to day interaction and execution. Deliver and pitch your topic in the best possible manner with this distributor strategy suppliers relationship selection model diagrams pdf. Use them to share invaluable insights on communication, plan, metrics, risk, resources and impress your audience. This template can be altered and modified as per your expectations. So, grab it now.

Corporate Security And Risk Management Cyber Threats Management Dashboard Ideas PDF
This slide portrays information regarding the dashboard that firm will use to manage cyber threats. The dashboard will provide clear picture of threats risks prevailing and how they are treated to technical engineers and board level executives. Deliver and pitch your topic in the best possible manner with this corporate security and risk management cyber threats management dashboard ideas pdf. Use them to share invaluable insights on cyber threats management dashboard and impress your audience. This template can be altered and modified as per your expectations. So, grab it now.

Business Diagram Flask With Data Driven Chart PowerPoint Slide
This data driven diagram has been designed with flask graphics. Download this diagram to give your presentations more effective look. It helps in clearly conveying your message to clients and audience.

Business Diagram Laptop With Data Driven Area Chart PowerPoint Slide
This diagram has been designed with laptop and data driven area chart. Download this diagram to give your presentations more effective look. It helps in clearly conveying your message to clients and audience.

Business Diagram Thumb Diagram With Five Stages For Data Representation PowerPoint Slide
This business diagram displays thumb up with five stages. This diagram contains text boxes for data representation. Use this diagram to display business process workflows in any presentations.

Overview Of Data Driven Decision Making Microsoft PDF
This slide represents the introduction to DDDM which uses facts, key metrics and corporate data to guide enterprise in making strategic business decisions which aligns with corporate objectives and initiatives. It includes details related to importance of data driven decision making for enterprise. This Overview Of Data Driven Decision Making Microsoft PDF is perfect for any presentation, be it in front of clients or colleagues. It is a versatile and stylish solution for organizing your meetings. The Overview Of Data Driven Decision Making Microsoft PDF features a modern design for your presentation meetings. The adjustable and customizable slides provide unlimited possibilities for acing up your presentation. Slidegeeks has done all the homework before launching the product for you. So, do not wait, grab the presentation templates today

Bar Graph Icon For Research Analysis Ppt PowerPoint Presentation Summary Portfolio
Presenting this set of slides with name bar graph icon for research analysis ppt powerpoint presentation summary portfolio. This is a three stage process. The stages in this process are data visualization icon, research analysis, business focus. This is a completely editable PowerPoint presentation and is available for immediate download. Download now and impress your audience.

Data Maturity Framework Assessment Icon Ppt PowerPoint Presentation Icon Infographic Template PDF
Presenting Data Maturity Framework Assessment Icon Ppt PowerPoint Presentation Icon Infographic Template PDF to dispense important information. This template comprises one stages. It also presents valuable insights into the topics including Data Maturity Framework, Assessment Icon. This is a completely customizable PowerPoint theme that can be put to use immediately. So, download it and address the topic impactfully.
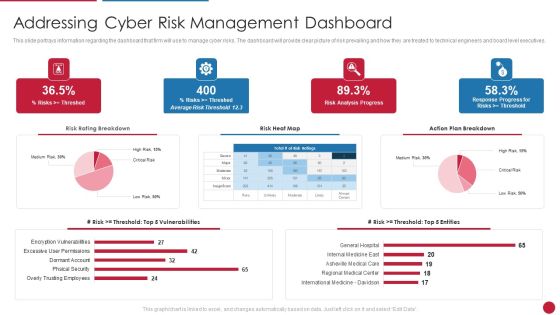
Facilitating IT Intelligence Architecture Addressing Cyber Risk Management Dashboard Professional PDF
This slide portrays information regarding the dashboard that firm will use to manage cyber risks. The dashboard will provide clear picture of risk prevailing and how they are treated to technical engineers and board level executives.Deliver and pitch your topic in the best possible manner with this Facilitating IT Intelligence Architecture Addressing Cyber Risk Management Dashboard Professional PDF Use them to share invaluable insights on International Medicine Davidson, Regional Medical Center, Asheville Medical Care and impress your audience. This template can be altered and modified as per your expectations. So, grab it now.
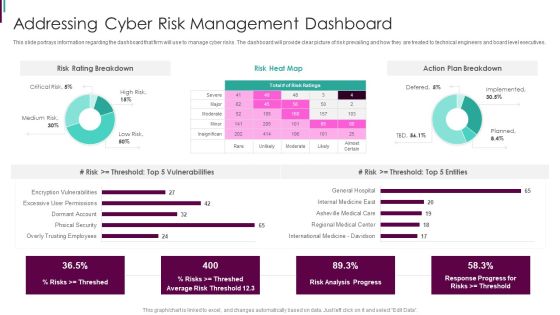
Developing Business Analytics Framework Addressing Cyber Risk Management Dashboard Graphics PDF
This slide portrays information regarding the dashboard that firm will use to manage cyber risks. The dashboard will provide clear picture of risk prevailing and how they are treated to technical engineers and board level executives.Deliver and pitch your topic in the best possible manner with this Developing Business Analytics Framework Addressing Cyber Risk Management Dashboard Graphics PDF Use them to share invaluable insights on Risk Breakdown, Action Breakdown, Vulnerabilities and impress your audience. This template can be altered and modified as per your expectations. So, grab it now.

Magnify Glass Ppt PowerPoint Presentation Styles
This is a magnify glass ppt powerpoint presentation styles. This is a five stage process. The stages in this process are big data, analysis, success, business, strategy.

Due Diligence For M And A With Magnifying Glass Icon Ppt Visual Aids Infographics PDF
Persuade your audience using this Due Diligence For M And A With Magnifying Glass Icon Ppt Visual Aids Infographics PDF. This PPT design covers one stages, thus making it a great tool to use. It also caters to a variety of topics including Ensure Alignment, Stakeholders, Senior Leaders Cooperation. Download this PPT design now to present a convincing pitch that not only emphasizes the topic but also showcases your presentation skills.

Keys To Building A Successful Marketing Communication Strategy Ppt PowerPoint Presentation Portfolio Summary
Presenting this set of slides with name keys to building a successful marketing communication strategy ppt powerpoint presentation portfolio summary. This is a six stage process. The stages in this process are understand target audience, define unique selling proposition, define branding elements, define success metrics, execution. This is a completely editable PowerPoint presentation and is available for immediate download. Download now and impress your audience.
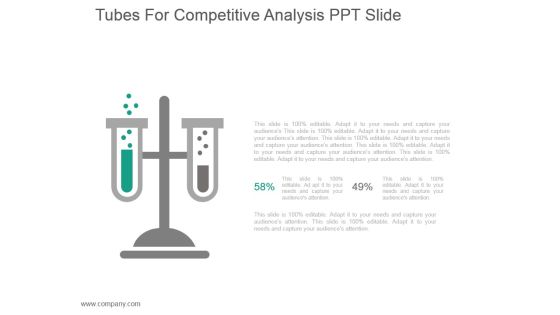
Tubes For Competitive Analysis Ppt Slide
This is a tubes for competitive analysis ppt slide. This is a two stage process. The stages in this process are business, strategy, marketing, compare, finance, management.

Competitive Analysis Matrix Ppt PowerPoint Presentation Inspiration
This is a competitive analysis matrix ppt powerpoint presentation inspiration. This is a six stage process. The stages in this process are tables, benefits, data, analysis, marketing.

Breakeven Analysis Ppt PowerPoint Presentation Professional Design Templates
This is a breakeven analysis ppt powerpoint presentation professional design templates. This is a six stage process. The stages in this process are units of output, fixed cost, variable cost, total cost, sales revenue.

Business Plan Competition India Ppt PowerPoint Presentation Portfolio Slide Download Cpb
This is a business plan competition india ppt powerpoint presentation portfolio slide download cpb. This is a four stage process. The stages in this process are business plan competition india.

Customer Engagement Data Through Social Platforms Data Analysis Brochure PDF
This slide demonstrates the dashboard representing the user engagement related to campaign A organized by ABC company. It includes statistical data related to no. of reach, custom button clicks, no. of shares, post engagement rate, taps on website link by users etc. Showcasing this set of slides titled Customer Engagement Data Through Social Platforms Data Analysis Brochure PDF. The topics addressed in these templates are Customer Engagement Data, Social Platforms Data Analysis. All the content presented in this PPT design is completely editable. Download it and make adjustments in color, background, font etc. as per your unique business setting.
Business Diagram 3d Capsule With Multiple Icons For Business Data Flow PowerPoint Slide
This diagram has been designed with 3d graphic of capsule with multiple icons. This data driven PowerPoint slide can be used to give your presentations more effective look. It helps in clearly conveying your message to clients and audience.
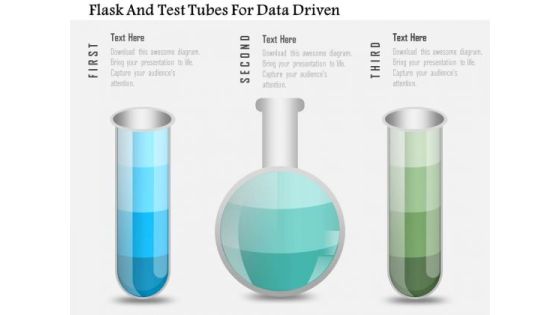
Business Diagram Flask And Test Tubes For Data Driven PowerPoint Slide
This data driven diagram has been designed with flask and test tubes. Download this diagram to give your presentations more effective look. It helps in clearly conveying your message to clients and audience.
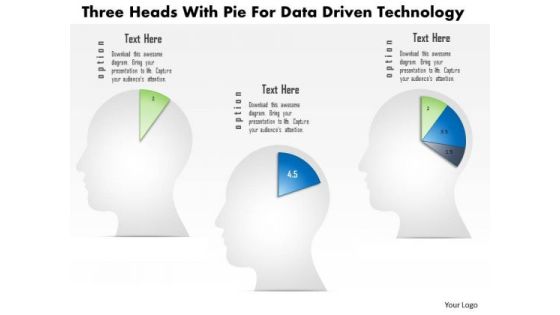
Business Diagram Three Heads With Pie For Data Driven Technology PowerPoint Slide
This business diagram displays three human faces with pie charts. This Power Point template has been designed to compare and present business data. You may use this diagram to impart professional appearance to your presentations.

Business Diagram Two Tablets With Growth Bar Graph Data Driven PowerPoint Slide
This business diagram has been designed with comparative charts on tablets. This slide suitable for data representation. You can also use this slide to present business reports and information. Use this diagram to present your views in a wonderful manner.
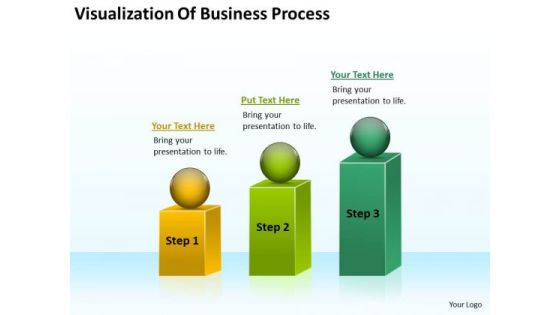
Visualization Of Business Process Ppt Plan PowerPoint Templates
We present our visualization of business process ppt plan PowerPoint templates.Present our Process and Flows PowerPoint Templates because Our PowerPoint Templates and Slides will Embellish your thoughts. They will help you illustrate the brilliance of your ideas. Download and present our Spheres PowerPoint Templates because It will Raise the bar of your Thoughts. They are programmed to take you to the next level. Use our Flow Charts PowerPoint Templates because Our PowerPoint Templates and Slides are conceived by a dedicated team. Use them and give form to your wondrous ideas. Use our Shapes PowerPoint Templates because Our PowerPoint Templates and Slides has conjured up a web of all you need with the help of our great team. Use them to string together your glistening ideas. Download and present our Marketing PowerPoint Templates because Our PowerPoint Templates and Slides will let you Leave a lasting impression to your audiences. They possess an inherent longstanding recall factor.Use these PowerPoint slides for presentations relating to Diagram, chart, market, statistics, square, grow, infograph, bar, corporate, business, vector, success, presentation, growing, circle, finance,analyst, goal, report, marketing, different, accounting, management, graph, illustration, geometric, sphere, design, growth, infographic, progress, profit,information, increase, aim, analyze, financial, rising, measure, block. The prominent colors used in the PowerPoint template are Green, Green lime, Yellow.

Data And Analysis Ppt PowerPoint Presentation Portfolio Layouts
This is a data and analysis ppt powerpoint presentation portfolio layouts. This is a six stage process. The stages in this process are root cause analysis, opportunity analysis, timeline analysis, force field analysis, fmea analysis.

Web Marketing Analysis Diagram Ppt Slides Design
This is a web marketing analysis diagram ppt slides design. This is a five stage process. The stages in this process are communication, global reach, growth, business plan, financial.

Business Diagram Alarm Clock With Pie Chart For Result Analysis PowerPoint Slide
This business slide displays alarm clock with pie chart. This diagram is a data visualization tool that gives you a simple way to present statistical information. This slide helps your audience examine and interpret the data you present.

 Home
Home
