AI PPT Maker
Templates
PPT Bundles
Design Services
Business PPTs
Business Plan
Management
Strategy
Introduction PPT
Roadmap
Self Introduction
Timelines
Process
Marketing
Agenda
Technology
Medical
Startup Business Plan
Cyber Security
Dashboards
SWOT
Proposals
Education
Pitch Deck
Digital Marketing
KPIs
Project Management
Product Management
Artificial Intelligence
Target Market
Communication
Supply Chain
Google Slides
Research Services
 One Pagers
All Categories
-
Home
- Customer Favorites
- Executive Dashboard
Executive Dashboard
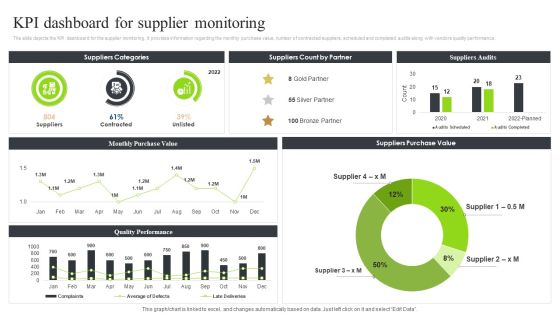
Strategic Sourcing And Supplier Quality Kpi Dashboard For Supplier Monitoring Graphics PDF
The slide depicts the KPI dashboard for the supplier monitoring. It provides information regarding the monthly purchase value, number of contracted suppliers, scheduled and completed audits along with vendors quality performance.Take your projects to the next level with our ultimate collection of Strategic Sourcing And Supplier Quality Kpi Dashboard For Supplier Monitoring Graphics PDF. Slidegeeks has designed a range of layouts that are perfect for representing task or activity duration, keeping track of all your deadlines at a glance. Tailor these designs to your exact needs and give them a truly corporate look with your own brand colors they all make your projects stand out from the rest.
System Deployment Project Software Implementation Project Progress Tracking Dashboard Structure PDF
This slide represents the dashboard to track the progress of software implementation project. It includes details related to health, tasks, project, time, cost and workload of software implementation project. Take your projects to the next level with our ultimate collection of System Deployment Project Software Implementation Project Progress Tracking Dashboard Structure PDF. Slidegeeks has designed a range of layouts that are perfect for representing task or activity duration, keeping track of all your deadlines at a glance. Tailor these designs to your exact needs and give them a truly corporate look with your own brand colors theyll make your projects stand out from the rest
Optimizing AI Strategies To Improve Financial Services Digital Media Tracking Dashboard Professional PDF
This slide covers the digital marketing dashboard along with the lead breakdown, google analytics traffic, and social media channels. Do you know about Slidesgeeks Optimizing AI Strategies To Improve Financial Services Digital Media Tracking Dashboard Professional PDF These are perfect for delivering any kind od presentation. Using it, create PowerPoint presentations that communicate your ideas and engage audiences. Save time and effort by using our pre designed presentation templates that are perfect for a wide range of topic. Our vast selection of designs covers a range of styles, from creative to business, and are all highly customizable and easy to edit. Download as a PowerPoint template or use them as Google Slides themes.

Dashboard For Cloud Storage Tracking Ppt PowerPoint Presentation File Example PDF
This slide represents the dashboard for cloud storage tracking by covering details of users, available workspaces, shared files, downloads, uploads, and moves. Take your projects to the next level with our ultimate collection of Dashboard For Cloud Storage Tracking Ppt PowerPoint Presentation File Example PDF. Slidegeeks has designed a range of layouts that are perfect for representing task or activity duration, keeping track of all your deadlines at a glance. Tailor these designs to your exact needs and give them a truly corporate look with your own brand colors they will make your projects stand out from the rest.

Dashboard For Monitoring Project Team Workload And Capacity Utilization Topics PDF
The following slide depicts dashboard for observing project resource utilization. It provides information about billable utilization, company target, project hours, over hours, project allocations, etc. Take your projects to the next level with our ultimate collection of Dashboard For Monitoring Project Team Workload And Capacity Utilization Topics PDF. Slidegeeks has designed a range of layouts that are perfect for representing task or activity duration, keeping track of all your deadlines at a glance. Tailor these designs to your exact needs and give them a truly corporate look with your own brand colors they will make your projects stand out from the rest.

Client Retargeting Strategy Dashboard For Tracking Impact Of Customer Retargeting Professional PDF
This slide covers a KPI dashboard for analyzing consumer retargeting advertisements. It includes metrics such as total clicks before retargeting, after retargeting, top references by share, and top retargeting regions. Take your projects to the next level with our ultimate collection of Client Retargeting Strategy Dashboard For Tracking Impact Of Customer Retargeting Professional PDF. Slidegeeks has designed a range of layouts that are perfect for representing task or activity duration, keeping track of all your deadlines at a glance. Tailor these designs to your exact needs and give them a truly corporate look with your own brand colors theyll make your projects stand out from the rest.

Revolutionizing Customer Support Through Digital Transformation KPI Dashboard To Measure Customer Elements PDF
This slide represents dashboard to measure customer service performance. It includes number of issues, average time to close, average response time etc. Take your projects to the next level with our ultimate collection of Revolutionizing Customer Support Through Digital Transformation KPI Dashboard To Measure Customer Elements PDF. Slidegeeks has designed a range of layouts that are perfect for representing task or activity duration, keeping track of all your deadlines at a glance. Tailor these designs to your exact needs and give them a truly corporate look with your own brand colors they will make your projects stand out from the rest.

Customer Service Dashboard Through AI Aiops Integration Summary Report Microsoft PDF
The following slide highlights the customer service dashboard that shows the use of AI in customer satisfaction. Coming up with a presentation necessitates that the majority of the effort goes into the content and the message you intend to convey. The visuals of a PowerPoint presentation can only be effective if it supplements and supports the story that is being told. Keeping this in mind our experts created Customer Service Dashboard Through AI Aiops Integration Summary Report Microsoft PDF to reduce the time that goes into designing the presentation. This way, you can concentrate on the message while our designers take care of providing you with the right template for the situation.

Corporate Product And Overall Product Branding Performance Tracking Dashboard Summary PDF
This slide provides information regarding product branding performance tracking dashboard in terms of revenues, new customers, customer satisfaction rate. Do you know about Slidesgeeks Corporate Product And Overall Product Branding Performance Tracking Dashboard Summary PDF These are perfect for delivering any kind od presentation. Using it, create PowerPoint presentations that communicate your ideas and engage audiences. Save time and effort by using our pre-designed presentation templates that are perfect for a wide range of topic. Our vast selection of designs covers a range of styles, from creative to business, and are all highly customizable and easy to edit. Download as a PowerPoint template or use them as Google Slides themes.
Providing Efficient Client Services Kpi Dashboard For Tracking Customer Retention Diagrams PDF
This slide covers the dashboard for analyzing customer loyalty with metrics such as NPS, loyal customer rate, premium users, CLV, customer churn, revenue churn, net retention, MRR growth, etc. Take your projects to the next level with our ultimate collection of Providing Efficient Client Services Kpi Dashboard For Tracking Customer Retention Diagrams PDF. Slidegeeks has designed a range of layouts that are perfect for representing task or activity duration, keeping track of all your deadlines at a glance. Tailor these designs to your exact needs and give them a truly corporate look with your own brand colors they will make your projects stand out from the rest.

KPI Dashboard To Track First Time Leads Ppt PowerPoint Presentation File Pictures PDF
The following slide showcases dashboard which can help businesses assess information about newly generated leads. It provides information about leads, permissions gained by source, revenue, sales closed, MailChimp, email, ads, etc. Take your projects to the next level with our ultimate collection of KPI Dashboard To Track First Time Leads Ppt PowerPoint Presentation File Pictures PDF. Slidegeeks has designed a range of layouts that are perfect for representing task or activity duration, keeping track of all your deadlines at a glance. Tailor these designs to your exact needs and give them a truly corporate look with your own brand colors they will make your projects stand out from the rest.

Consumer Journey Mapping Techniques Dashboard For Tracking Social Media Platforms Introduction PDF
This slide covers the KPI dashboard for analyzing social media channels. It includes metrics such as social media followers, Facebook daily reach, Facebook engaged users and page impressions, etc. Pitch your topic with ease and precision using this Consumer Journey Mapping Techniques Dashboard For Tracking Social Media Platforms Introduction PDF. This layout presents information on Linkedin Key Metrics, Social Media Followers, Awareness. It is also available for immediate download and adjustment. So, changes can be made in the color, design, graphics or any other component to create a unique layout.

Customer Behavior Analytics Dashboard To Improve Satisfaction Ppt File Infographics PDF
The following slide provides an insight of websites performance that includes date parameters. The dashboard includes sessions, users, pageviews, bounce rate and percentage of new sessions. Pitch your topic with ease and precision using this Customer Behavior Analytics Dashboard To Improve Satisfaction Ppt File Infographics PDF. This layout presents information on Session, Avg Session Duration, Bounce Rate. It is also available for immediate download and adjustment. So, changes can be made in the color, design, graphics or any other component to create a unique layout.

E Commerce Operations In B2b B2b Ecommerce Dashboard To Track Website Infographics PDF
This slide represents metric dashboard to track and analyze b2b ecommerce website performance. It covers total user visits, sales, average return per user etc. Find a pre designed and impeccable E Commerce Operations In B2b B2b Ecommerce Dashboard To Track Website Infographics PDF. The templates can ace your presentation without additional effort. You can download these easy to edit presentation templates to make your presentation stand out from others. So, what are you waiting for Download the template from Slidegeeks today and give a unique touch to your presentation.
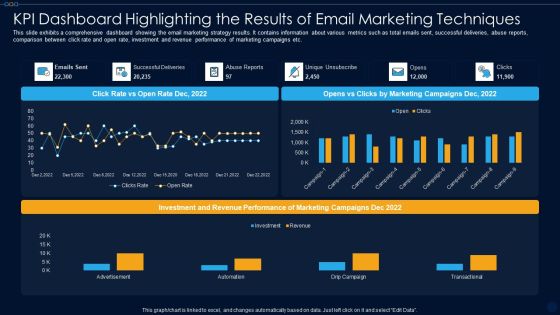
KPI Dashboard Highlighting The Results Of Email Marketing Techniques Ppt PowerPoint Presentation File Format PDF
This slide exhibits a comprehensive dashboard showing the email marketing strategy results. It contains information about various metrics such as total emails sent, successful deliveries, abuse reports, comparison between click rate and open rate, investment and revenue performance of marketing campaigns etc. Showcasing this set of slides titled kpi dashboard highlighting the results of email marketing techniques ppt powerpoint presentation file format pdf. The topics addressed in these templates are advertisement, automation, drip campaign, transactional. All the content presented in this PPT design is completely editable. Download it and make adjustments in color, background, font etc. as per your unique business setting.
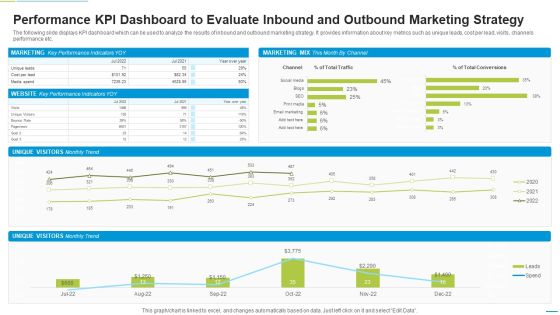
Performance KPI Dashboard To Evaluate Inbound And Outbound Marketing Strategy Mockup PDF
The following slide displays KPI dashboard which can be used to analyze the results of inbound and outbound marketing strategy. It provides information about key metrics such as unique leads, cost per lead, visits, channels performance etc. Showcasing this set of slides titled Performance KPI Dashboard To Evaluate Inbound And Outbound Marketing Strategy Mockup PDF. The topics addressed in these templates are Marketing, Unique Visitors, Cost Per Lead. All the content presented in this PPT design is completely editable. Download it and make adjustments in color, background, font etc. as per your unique business setting.

Customer Behavior Analytics Dashboard With Yearly Users Ppt Portfolio Ideas PDF
The following slide showcases dashboard that provides an insight on customer buying behavior from ecommerce website. Key metrics covered are yearly users, average time on page, bounce rate, unique page views session duration, purchased products, visitors, page performance and top search terms. Showcasing this set of slides titled Customer Behavior Analytics Dashboard With Yearly Users Ppt Portfolio Ideas PDF. The topics addressed in these templates are Yearly Users, Yearly Bounce Rate, Top Search Terms. All the content presented in this PPT design is completely editable. Download it and make adjustments in color, background, font etc. as per your unique business setting.

Integrating Digital Marketing Campaign Strategy Dashboard With Lead Breakdown Slides PDF
This slide depicts an integrating digital marketing campaign dashboard used to track lead generation and user traffic generated. It includes lead breakdown per day, google analytics traffic channels and key conversion metrics. Showcasing this set of slides titled Integrating Digital Marketing Campaign Strategy Dashboard With Lead Breakdown Slides PDF. The topics addressed in these templates are Lead Current Month, Website Users, Top Social Media Channels. All the content presented in this PPT design is completely editable. Download it and make adjustments in color, background, font etc. as per your unique business setting.

Performance KPI Dashboard To Analyze Healthcare Marketing Strategies Performance Elements PDF
The following slide showcases a comprehensive dashboard which can be used to evaluate the effectiveness of marketing strategies. The key metrics are total searches, brand mentions, customer value, total spending on advertisement etc. If your project calls for a presentation, then Slidegeeks is your go to partner because we have professionally designed, easy to edit templates that are perfect for any presentation. After downloading, you can easily edit Performance KPI Dashboard To Analyze Healthcare Marketing Strategies Performance Elements PDF and make the changes accordingly. You can rearrange slides or fill them with different images. Check out all the handy templates.

Ways To Accomplish ISO 27001 Accreditation Dashboard To Measure Total Risks Encountered Download PDF
Mentioned slide portrays dashboard for measuring total risk encountered by the firm in specific period and total risks resolved. Key metrics included in the slide are issues by status, issues by priority and resolved status. Deliver an awe inspiring pitch with this creative Ways To Accomplish ISO 27001 Accreditation Dashboard To Measure Total Risks Encountered Download PDF bundle. Topics like Pending Approval, Action Plan, Resolved Status can be discussed with this completely editable template. It is available for immediate download depending on the needs and requirements of the user.
Real Estate Sales Tracking Dashboard With Inquiry Referrals Ppt PowerPoint Presentation File Samples PDF
This slide showcases dashboard to track property sales KPIs for smooth flow of operations. It includes information such as rent, social media, digital ads, agent wise sales, etc. Showcasing this set of slides titled Real Estate Sales Tracking Dashboard With Inquiry Referrals Ppt PowerPoint Presentation File Samples PDF. The topics addressed in these templates are Property Inquiry Referrals, Properties Sold And Rent By Agent, Sales By Religion, Sales Target. All the content presented in this PPT design is completely editable. Download it and make adjustments in color, background, font etc. as per your unique business setting.

Performance Tracking Dashboard For E Marketplace Platform Ppt Summary Gridlines PDF
This slide displays dashboard to track average sales of E-marketplace for organization to formulate appropriate strategies. It includes KPIs such as health, orders, dispatch status, overdue, etc. Showcasing this set of slides titled Performance Tracking Dashboard For E Marketplace Platform Ppt Summary Gridlines PDF. The topics addressed in these templates are Total Scale, Dispatch Status, Account, Health, Orders. All the content presented in this PPT design is completely editable. Download it and make adjustments in color, background, font etc. as per your unique business setting.

Consumer Acquisition And Retention Dashboard With Loyal Consumer Rate And CLV Brochure PDF
This slide contains the complete dashboard of customer retention and acquisition matrix details. It includes current and previous months comparison of various types of KPIs used for strong customer base like customer churn, revenue churn, net retention and MRR growth. Showcasing this set of slides titled Consumer Acquisition And Retention Dashboard With Loyal Consumer Rate And CLV Brochure PDF. The topics addressed in these templates are Consumer Churn, Revenue Churn, Premium Users. All the content presented in this PPT design is completely editable. Download it and make adjustments in color, background, font etc. as per your unique business setting.
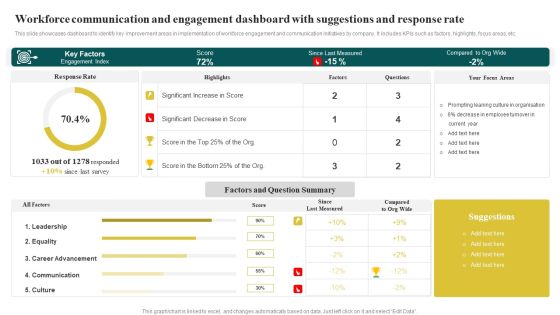
Workforce Communication And Engagement Dashboard With Suggestions And Response Rate Microsoft PDF
This slide showcases dashboard to identify key improvement areas in implementation of workforce engagement and communication initiatives by company. It includes KPIs such as factors, highlights, focus areas, etc. Pitch your topic with ease and precision using this Workforce Communication And Engagement Dashboard With Suggestions And Response Rate Microsoft PDF. This layout presents information on Key Factors, Since Last Measured, Factors And Que. It is also available for immediate download and adjustment. So, changes can be made in the color, design, graphics or any other component to create a unique layout.

KPI Dashboard Of Technical Customer Support Service Ppt Layouts Professional PDF
This slide covers KPI dashboard of technical customer support service. It involves KPIs such as overdue tickets, problem types, tickets by customer types and detail about technical support engineers. Showcasing this set of slides titled KPI Dashboard Of Technical Customer Support Service Ppt Layouts Professional PDF. The topics addressed in these templates are Overdue Tickets, Problems Types, Technical Support Engineers. All the content presented in this PPT design is completely editable. Download it and make adjustments in color, background, font etc. as per your unique business setting.

Attain Production Goals And Objectives KPI Dashboard Ppt Pictures Graphics PDF
This slide covers a dashboard for tracking manufacturing metrics. It includes production KPIs such as quantity, rework quantity, manufacturing cost, labor cost, runtime vs. downtime, etc. Showcasing this set of slides titled Attain Production Goals And Objectives KPI Dashboard Ppt Pictures Graphics PDF. The topics addressed in these templates are Product Name, Quantity, Rework Quantity, Manufacturing Cost. All the content presented in this PPT design is completely editable. Download it and make adjustments in color, background, font etc. as per your unique business setting.

Creating And Introducing A Web Based Application Performance Dashboard Guidelines PDF
This slide covers application performance in market KPIs and metrics such as impressions, clicks, searches for app, conversion rate etc, Get a simple yet stunning designed Creating And Introducing A Web Based Application Performance Dashboard Guidelines PDF. It is the best one to establish the tone in your meetings. It is an excellent way to make your presentations highly effective. So, download this PPT today from Slidegeeks and see the positive impacts. Our easy-to-edit Creating And Introducing A Web Based Application Performance Dashboard Guidelines PDF can be your go-to option for all upcoming conferences and meetings. So, what are you waiting for Grab this template today.

Dashboard To Analyze Performance Of Google Adwords Strategic Campaign Inspiration PDF
This slide displays dashboard for real time tracking and monitoring of marketing KPIs to review campaign performance. It includes elements such as spend, conversions, clicks, impressions, CTR, etc. Pitch your topic with ease and precision using this Dashboard To Analyze Performance Of Google Adwords Strategic Campaign Inspiration PDF. This layout presents information on Spend, Conversions, Cost Benefit Analysis . It is also available for immediate download and adjustment. So, changes can be made in the color, design, graphics or any other component to create a unique layout.

Dashboard To Compare Google Adwords Strategic Campaign With Facebook Microsoft PDF
This slide showcases KPI dashboard to compare performance of google adwords campaign to identify the most efficient one. It includes KPIs such as cost, conversions, channel performance overview, clicks, impressions, etc. Showcasing this set of slides titled Dashboard To Compare Google Adwords Strategic Campaign With Facebook Microsoft PDF. The topics addressed in these templates are Cost, Conversions, Revenue. All the content presented in this PPT design is completely editable. Download it and make adjustments in color, background, font etc. as per your unique business setting.

Call Center Metrics Dashboard To Measure Customer Satisfaction Level Slides PDF
Mentioned slide outlines call center KPI dashboard which will assist various call centers to evaluate the customer satisfaction level. The critical KPIs mentioned in the template are total revenue earned, cost per support, average time taken to solve an issue etc. Showcasing this set of slides titled Call Center Metrics Dashboard To Measure Customer Satisfaction Level Slides PDF. The topics addressed in these templates are Total Revenue, Support Costs, Customer Satisfaction. All the content presented in this PPT design is completely editable. Download it and make adjustments in color, background, font etc. as per your unique business setting.

Dashboard For Strategic Evaluation Of Key Business Financials Ppt Gallery Aids PDF
This slide displays dashboard to review business performance and formulate appropriate improvement strategies. It further includes kpis such as revenue comparison, top selling categories, sales by month, customer satisfaction, etc. Showcasing this set of slides titled Dashboard For Strategic Evaluation Of Key Business Financials Ppt Gallery Aids PDF. The topics addressed in these templates are Revenue Comparison, Top Selling Categories, New Customer. All the content presented in this PPT design is completely editable. Download it and make adjustments in color, background, font etc. as per your unique business setting.
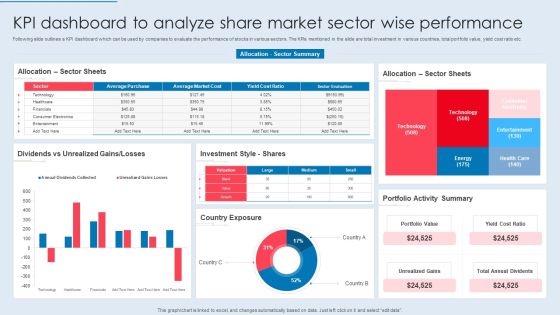
KPI Dashboard To Analyze Share Market Sector Wise Performance Summary PDF
Following slide outlines a KPI dashboard which can be used by companies to evaluate the performance of stocks in various sectors. The KPIs mentioned in the slide are total investment in various countries, total portfolio value, yield cost ratio etc. Pitch your topic with ease and precision using this KPI Dashboard To Analyze Share Market Sector Wise Performance Summary PDF. This layout presents information on Sector Sheets, Dividends Vs Unrealized, Investment Style. It is also available for immediate download and adjustment. So, changes can be made in the color, design, graphics or any other component to create a unique layout.
Online Marketing Analytics To Enhance Business Growth Website Landing Page KPI Tracking Dashboard Sample PDF
This slide covers a dashboard for analyzing the metrics of the website landing page. It includes KPIs such as conversions, conversion rate, sessions, bounce rate, engagement sickness, etc. If your project calls for a presentation, then Slidegeeks is your go to partner because we have professionally designed, easy to edit templates that are perfect for any presentation. After downloading, you can easily edit Online Marketing Analytics To Enhance Business Growth Website Landing Page KPI Tracking Dashboard Sample PDF and make the changes accordingly. You can rearrange slides or fill them with different images. Check out all the handy templates
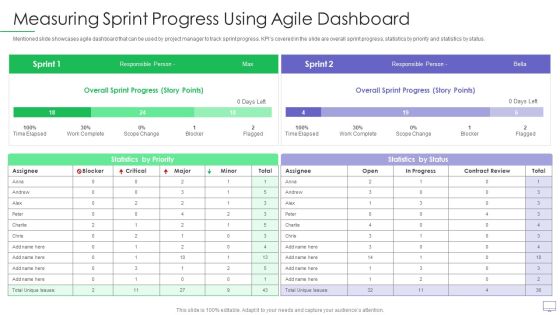
Guide For Software Developers Measuring Sprint Progress Using Agile Dashboard Rules PDF
Mentioned slide showcases agile dashboard that can be used by project manager to track sprint progress. KPIs covered in the slide are overall sprint progress, statistics by priority and statistics by status. Deliver and pitch your topic in the best possible manner with this guide for software developers measuring sprint progress using agile dashboard rules pdf. Use them to share invaluable insights on overall sprint progress, statistics by priority and impress your audience. This template can be altered and modified as per your expectations. So, grab it now.

Declining Of A Motor Vehicle Company Vehicle Sales Dashboard Diagrams PDF
Deliver and pitch your topic in the best possible manner with this declining of a motor vehicle company vehicle sales dashboard diagrams pdf. Use them to share invaluable insights on government, corporate, commercial, sales, market and impress your audience. This template can be altered and modified as per your expectations. So, grab it now.
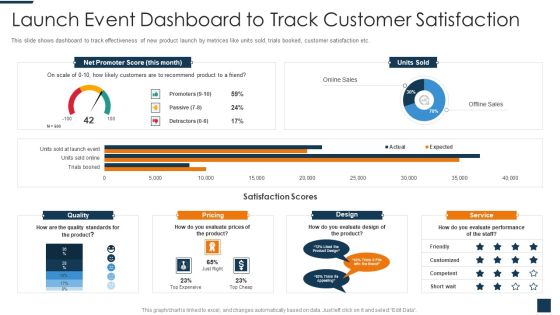
Go To Market Strategy For New Product Launch Event Dashboard To Track Customer Satisfaction Introduction PDF
This slide shows dashboard to track effectiveness of new product launch by metrices like units sold, trials booked, customer satisfaction etc. Deliver and pitch your topic in the best possible manner with this go to market strategy for new product launch event dashboard to track customer satisfaction introduction pdf. Use them to share invaluable insights on net promoter score, units sold, quality, pricing, design, service and impress your audience. This template can be altered and modified as per your expectations. So, grab it now.

Sustainability Calculation With KPI Cash Flow Dashboard Liquidity Ratio Inspiration PDF Introduction PDF
Following slide covers cash flow dashboard covering details like beginning cash on hand, cash going in, cash going out, profit loss and ending cash on hand. It also includes detail of accounts receivable and payable. Deliver an awe inspiring pitch with this creative sustainability calculation with kpi cash flow dashboard cash designs pdf bundle. Topics like beginning cash on hand, cash going out, profit and loss, ending cash on hand can be discussed with this completely editable template. It is available for immediate download depending on the needs and requirements of the user.

Cyber Risk Dashboard With Current Risks And Security Service Formats PDF
The following slide focuses on the cyber threat dashboard which highlights current threats, current risks, regulation and policy coverage, security service and asset control issues. Pitch your topic with ease and precision using this cyber risk dashboard with current risks and security service formats pdf. This layout presents information on current threats, current risks, regulation and policy coverage. It is also available for immediate download and adjustment. So, changes can be made in the color, design, graphics or any other component to create a unique layout.

Customer Texting Platforms Dashboard Indicating Conversation Stats And Sources Details Ideas PDF
This slide showcase customer messaging platform dashboard indicating conversation stats and sources details beneficial for companies to make any changes or improvements in prevailing bulk texts being sent to consumers. It contains information about assigned, unanswered, operators online, average response time, duration of conversation, users, message sources, etc.Showcasing this set of slides titled customer texting platforms dashboard indicating conversation stats and sources details ideas pdf The topics addressed in these templates are total conversations, total assigned, total unanswered All the content presented in this PPT design is completely editable. Download it and make adjustments in color, background, font etc. as per your unique business setting.
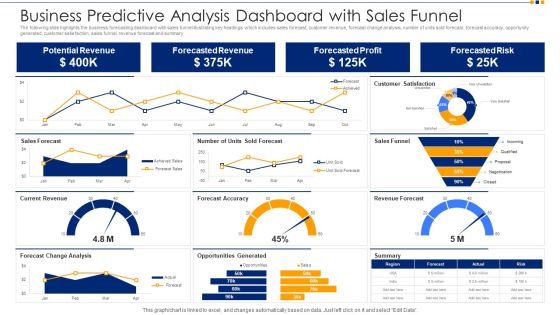
Business Predictive Analysis Dashboard With Sales Funnel Ppt Show Images PDF
The following slide highlights the business forecasting dashboard with sales funnel illustrating key headings which includes sales forecast, customer revenue, forecast change analysis, number of units sold forecast, forecast accuracy, opportunity generated, customer satisfaction, sales funnel, revenue forecast and summary. Pitch your topic with ease and precision using this business predictive analysis dashboard with sales funnel ppt show images pdf. This layout presents information on potential revenue, forecasted revenue, forecasted profit, forecasted risk. It is also available for immediate download and adjustment. So, changes can be made in the color, design, graphics or any other component to create a unique layout.
Email Marketing Dashboard Illustrating Campaign Performance Results Ppt PowerPoint Presentation File Icon PDF
Mentioned slide displays email campaign dashboard which can be used by marketers to track performance of their marketing campaigns. Marketers can track metrics such as total subscribers growth, overall bounce rate, unsubscribe rate, open rate, click rate etc. Showcasing this set of slides titled email marketing dashboard illustrating campaign performance results ppt powerpoint presentation file icon pdf. The topics addressed in these templates are marketing, list health, total subscribers, percentage. All the content presented in this PPT design is completely editable. Download it and make adjustments in color, background, font etc. as per your unique business setting.
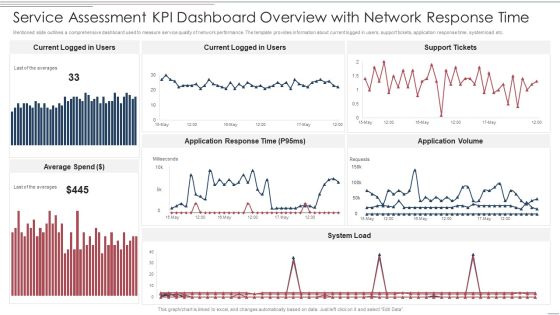
Service Assessment Kpi Dashboard Overview With Network Response Time Themes PDF
Mentioned slide outlines a comprehensive dashboard used to measure service quality of network performance. The template provides information about current logged in users, support tickets, application response time, system load etc. Pitch your topic with ease and precision using this Service Assessment Kpi Dashboard Overview With Network Response Time Themes PDF. This layout presents information on Average Spend, System Load, Application Response Time. It is also available for immediate download and adjustment. So, changes can be made in the color, design, graphics or any other component to create a unique layout.

Brand Revenue Comparative Analysis With Net Promoter Score Dashboard Mockup PDF
This slide illustrates graphical representation of revenue of three brands. It includes weekly revenue line graphs and net promoter score by age of customers.Pitch your topic with ease and precision using this Brand Revenue Comparative Analysis With Net Promoter Score Dashboard Mockup PDF. This layout presents information on Brand Revenue Comparative Analysis With Net Promoter Score Dashboard. It is also available for immediate download and adjustment. So, changes can be made in the color, design, graphics or any other component to create a unique layout.

Sales Dashboard With Average Real Estate Size And Inquiry Referrals Ppt PowerPoint Presentation Gallery Slides PDF
This slide showcases property dashboard to keep track of units sold by each agent and profitability of the business. It includes information about advertised and actual sales, monthly inventory, rented by agent, etc. Showcasing this set of slides titled Sales Dashboard With Average Real Estate Size And Inquiry Referrals Ppt PowerPoint Presentation Gallery Slides PDF. The topics addressed in these templates are Month Inventory. All the content presented in this PPT design is completely editable. Download it and make adjustments in color, background, font etc. as per your unique business setting.
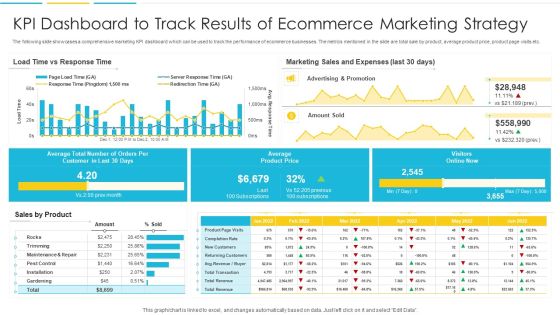
KPI Dashboard To Track Results Of Ecommerce Marketing Strategy Structure PDF
The following slide showcases a comprehensive marketing KPI dashboard which can be used to track the performance of ecommerce businesses. The metrics mentioned in the slide are total sale by product, average product price, product page visits etc. Showcasing this set of slides titled KPI Dashboard To Track Results Of Ecommerce Marketing Strategy Structure PDF. The topics addressed in these templates are Average, Customer, Marketing. All the content presented in this PPT design is completely editable. Download it and make adjustments in color, background, font etc. as per your unique business setting.
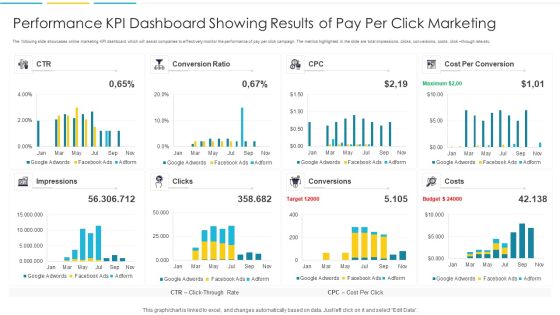
Performance KPI Dashboard Showing Results Of Pay Per Click Marketing Portrait PDF
The following slide showcases online marketing KPI dashboard which will assist companies to effectively monitor the performance of pay per click campaign. The metrics highlighted in the slide are total impressions, clicks, conversions, costs, click through rate etc. Pitch your topic with ease and precision using this Performance KPI Dashboard Showing Results Of Pay Per Click Marketing Portrait PDF. This layout presents information on Impressions, Target, Budget. It is also available for immediate download and adjustment. So, changes can be made in the color, design, graphics or any other component to create a unique layout.
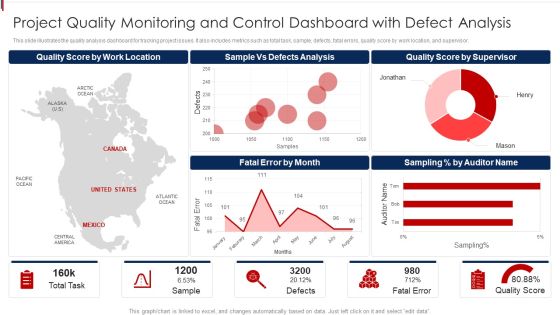
Project Quality Monitoring And Control Dashboard With Defect Analysis Demonstration PDF
This slide illustrates the quality analysis dashboard for tracking project issues. It also includes metrics such as total task, sample, defects, fatal errors, quality score by work location, and supervisor. Pitch your topic with ease and precision using this Project Quality Monitoring And Control Dashboard With Defect Analysis Demonstration PDF. This layout presents information on Location, Analysis, Supervisor. It is also available for immediate download and adjustment. So, changes can be made in the color, design, graphics or any other component to create a unique layout.
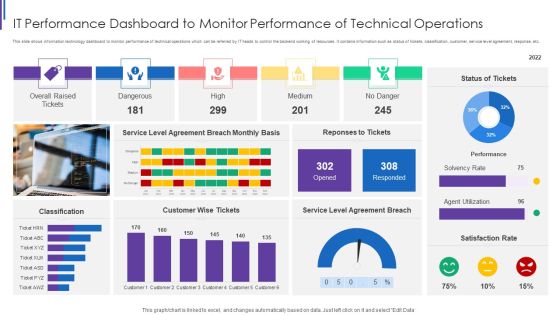
IT Performance Dashboard To Monitor Performance Of Technical Operations Download PDF
This slide shows information technology dashboard to monitor performance of technical operations which can be referred by IT heads to control the backend working of resources. It contains information such as status of tickets, classification, customer, service level agreement, response, etc. Showcasing this set of slides titled IT Performance Dashboard To Monitor Performance Of Technical Operations Download PDF. The topics addressed in these templates are Overall Raised Tickets, Dangerous High Medium, Service Level Agreement, Customer Wise Tickets. All the content presented in this PPT design is completely editable. Download it and make adjustments in color, background, font etc. as per your unique business setting.

KPI Dashboard For Informational Technology Department To Analyze Key Financials Structure PDF
This slide shows KPI dashboard for informational technology department to analyze key financials of companies which assists in decision making for growth. It also includes information about IT department ROI, expenditure vs. Allocated budget, it cost breakdown and it expenditure vs. Revenue. Pitch your topic with ease and precision using this KPI Dashboard For Informational Technology Department To Analyze Key Financials Structure PDF. This layout presents information on Expenditure Vs Allocated, Budget IT Cost, Break Down IT, Expenditure Vs Revenue, IT Department ROI. It is also available for immediate download and adjustment. So, changes can be made in the color, design, graphics or any other component to create a unique layout.
Mobile User Interface Issue Tracker Dashboard In Information Technology Ideas PDF
This slide shows mobile user interface issue tracker dashboard in information technology which can be referred by software engineers to rectify smartphone issues. It contains information about project, component, generated vs. completed issues, issue by status, issue count by project and component and incomplete issues. Pitch your topic with ease and precision using this Mobile User Interface Issue Tracker Dashboard In Information Technology Ideas PDF. This layout presents information on Issues Count By, Project And Components, Incomplete Issues By, Priority And Project. It is also available for immediate download and adjustment. So, changes can be made in the color, design, graphics or any other component to create a unique layout.
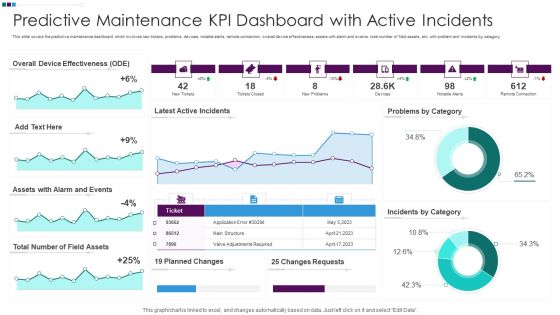
Predictive Maintenance KPI Dashboard With Active Incidents Ppt Slides Backgrounds PDF
This slide covers the predictive maintenance dashboard which involves new tickets, problems, devices, notable alerts, remote connection, overall device effectiveness, assets with alarm and events, total number of field assets, etc. with problem and incidents by category. Showcasing this set of slides titled Predictive Maintenance KPI Dashboard With Active Incidents Ppt Slides Backgrounds PDF. The topics addressed in these templates are Overall Device Effectiveness, Assets Alarm Events, Total Number Field. All the content presented in this PPT design is completely editable. Download it and make adjustments in color, background, font etc. as per your unique business setting.
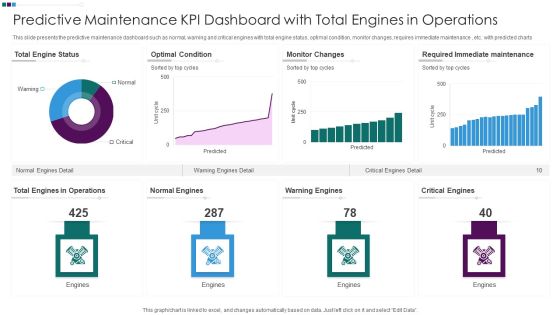
Predictive Maintenance KPI Dashboard With Total Engines In Operations Ppt Professional Inspiration PDF
This slide presents the predictive maintenance dashboard such as normal, warning and critical engines with total engine status, optimal condition, monitor changes, requires immediate maintenance , etc. with predicted charts. Pitch your topic with ease and precision using this Predictive Maintenance KPI Dashboard With Total Engines In Operations Ppt Professional Inspiration PDF. This layout presents information on Total Engine Status, Optimal Condition Monitor, Changes Warning Engines, Required Immediate Maintenance. It is also available for immediate download and adjustment. So, changes can be made in the color, design, graphics or any other component to create a unique layout.
Development And Operations KPI Dashboard With Central Processing Unit Statistics Icons PDF
This slide covers devops KPI metrics dashboard with central processing unit statistics about input output statistics , network traffic volume under during recorded sessions. Further, this template includes numbers of sessions with waiting time.Showcasing this set of slides titled Development And Operations KPI Dashboard With Central Processing Unit Statistics Icons PDF The topics addressed in these templates are Central Processing, Output Statistics, Resource Limits All the content presented in this PPT design is completely editable. Download it and make adjustments in color, background, font etc. as per your unique business setting.
How To Implement Cloud Collaboration Cloud Platform Dashboard For Tracking Project Team Professional PDF
The following slide depicts project team task tracking cloud dashboard. It provides information about hours worked, projects worked, time spent, daily limit, product design, weekly activity, etc. Deliver and pitch your topic in the best possible manner with this How To Implement Cloud Collaboration Cloud Platform Dashboard For Tracking Project Team Professional PDF. Use them to share invaluable insights on Today Activity, Daily Limits, Recent Activity and impress your audience. This template can be altered and modified as per your expectations. So, grab it now.

CRM Performance Metrics Dashboard Showing Sales In Real Estate Customer Information PDF
This slide represents the dashboard showing the sales performance of a real estate company. It includes details related top 5 agents US sales, sales vs target per agent, top 5 banks-sold units, sales by top 5 agencies. Pitch your topic with ease and precision using this CRM Performance Metrics Dashboard Showing Sales In Real Estate Customer Information PDF. This layout presents information on Us Sales, Sold Units, Target Per Agent. It is also available for immediate download and adjustment. So, changes can be made in the color, design, graphics or any other component to create a unique layout.

Dashboard Of Shipment Logistics KPI With Operating Cost Ppt Styles Example Topics PDF
The following slide highlights dashboard of shipment transportation with operating cost illustrating transportation operating cost, monthly order completion rate, operating cost distribution, order completion trend, transportation by destination and transportation efficiency. Showcasing this set of slides titled Dashboard Of Shipment Logistics KPI With Operating Cost Ppt Styles Example Topics PDF. The topics addressed in these templates are Transportation Operating Cost, Monthly Order, Completion Rate, Operating Cost Distribution. All the content presented in this PPT design is completely editable. Download it and make adjustments in color, background, font etc. as per your unique business setting.
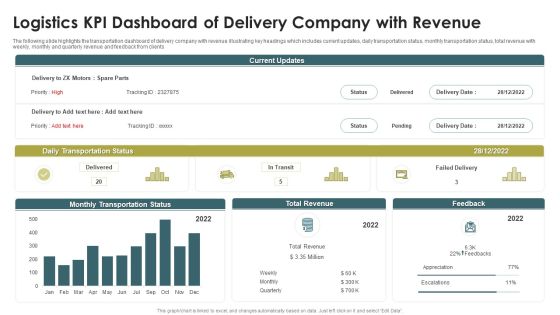
Logistics KPI Dashboard Of Delivery Company With Revenue Ppt Show PDF
The following slide highlights the transportation dashboard of delivery company with revenue illustrating key headings which includes current updates, daily transportation status, monthly transportation status, total revenue with weekly, monthly and quarterly revenue and feedback from clients. Showcasing this set of slides titled Logistics KPI Dashboard Of Delivery Company With Revenue Ppt Show PDF. The topics addressed in these templates are Daily Transportation Status, Monthly Transportation Status, Total Revenue. All the content presented in this PPT design is completely editable. Download it and make adjustments in color, background, font etc. as per your unique business setting.

Dashboard For International Logistics KPI Via Third Party Carriers Rules PDF
The following slide highlights the dashboard for international transportation via third party carriers illustrating total shipment, payment method, revenue, shipment status and shipment details such as company, tracking id, Item, weight, address, payment, status to monitor the transportation. Showcasing this set of slides titled Dashboard For International Logistics KPI Via Third Party Carriers Rules PDF. The topics addressed in these templates are Total Shipment, Payment Method, Revenue, 20. All the content presented in this PPT design is completely editable. Download it and make adjustments in color, background, font etc. as per your unique business setting.

Fashion Marketing And Advertisement Analysis Dashboard Ppt PowerPoint Presentation Gallery Topics PDF
This slide defines the dashboard for fashion marketing and Advertisement revenue analysis . It includes information related to the revenue, sales, brands and gender breakdown. Pitch your topic with ease and precision using this Fashion Marketing And Advertisement Analysis Dashboard Ppt PowerPoint Presentation Gallery Topics PDF. This layout presents information on Total Revenue, Total Brands, Total Sales. It is also available for immediate download and adjustment. So, changes can be made in the color, design, graphics or any other component to create a unique layout.
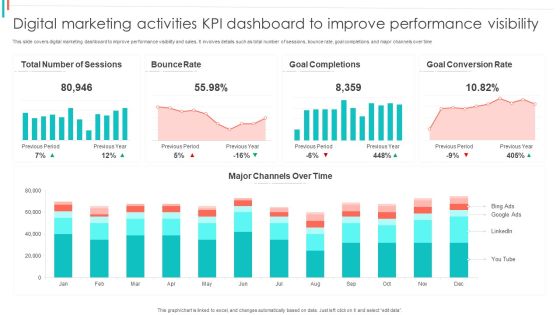
Digital Marketing Activities KPI Dashboard To Improve Performance Visibility Summary PDF
This slide covers digital marketing dashboard to improve performance visibility and sales. It involves details such as total number of sessions, bounce rate, goal completions and major channels over time.Showcasing this set of slides titled Digital Marketing Activities KPI Dashboard To Improve Performance Visibility Summary PDF. The topics addressed in these templates are Bounce Rate, Goal Completions, Goal Conversion. All the content presented in this PPT design is completely editable. Download it and make adjustments in color, background, font etc. as per your unique business setting.
