AI PPT Maker
Templates
PPT Bundles
Design Services
Business PPTs
Business Plan
Management
Strategy
Introduction PPT
Roadmap
Self Introduction
Timelines
Process
Marketing
Agenda
Technology
Medical
Startup Business Plan
Cyber Security
Dashboards
SWOT
Proposals
Education
Pitch Deck
Digital Marketing
KPIs
Project Management
Product Management
Artificial Intelligence
Target Market
Communication
Supply Chain
Google Slides
Research Services
 One Pagers
All Categories
-
Home
- Customer Favorites
- Executive Dashboard
Executive Dashboard

Comparative Health And Risk Key Performance Indicator Dashboard Ppt Portfolio Slide PDF
The slide highlights the comparative health and safety key performance indicator dashboard. It shows current year and previous events, safety incident classification, safety cases by place, map and safety consequence. Showcasing this set of slides titled Comparative Health And Risk Key Performance Indicator Dashboard Ppt Portfolio Slide PDF. The topics addressed in these templates are Safety Consequence, Safety Incidents Classification, Map. All the content presented in this PPT design is completely editable. Download it and make adjustments in color, background, font etc. as per your unique business setting.

Employee Risk Key Performance Indicator Dashboard With Case Incident Rate Ppt Professional Information PDF
The following slide highlights the employee safety key performance indicator dashboard with case incident rate illustrating total case occurrence rate, last reported case, days without reported, causing items, corrective actions, incident pyramid, incident by month and major causes. Pitch your topic with ease and precision using this Employee Risk Key Performance Indicator Dashboard With Case Incident Rate Ppt Professional Information PDF. This layout presents information on Total Case, Incident Rate, Last Incident Reported, Incident Causing Items. It is also available for immediate download and adjustment. So, changes can be made in the color, design, graphics or any other component to create a unique layout.
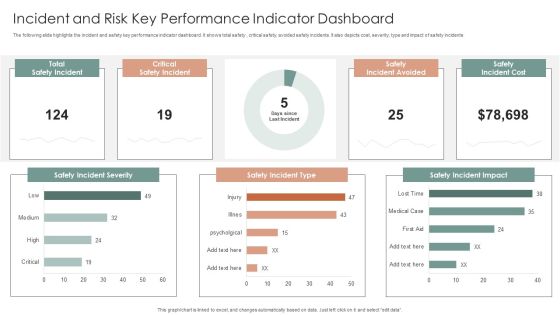
Incident And Risk Key Performance Indicator Dashboard Ppt Gallery Mockup PDF
The following slide highlights the incident and safety key performance indicator dashboard. It shows total safety, critical safety, avoided safety incidents. It also depicts cost, severity, type and impact of safety incidents. Showcasing this set of slides titled Incident And Risk Key Performance Indicator Dashboard Ppt Gallery Mockup PDF. The topics addressed in these templates are Safety Incident Severity, Safety Incident Type, Safety Incident Impact. All the content presented in this PPT design is completely editable. Download it and make adjustments in color, background, font etc. as per your unique business setting.
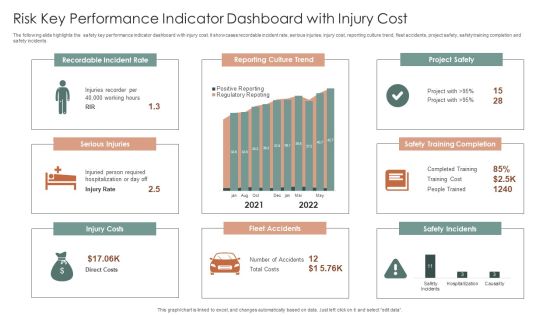
Risk Key Performance Indicator Dashboard With Injury Cost Ppt Summary Brochure PDF
The following slide highlights the safety key performance indicator dashboard with injury cost. It showcases recordable incident rate, serious injuries, injury cost, reporting culture trend, fleet accidents, project safety, safety training completion and safety incidents. Pitch your topic with ease and precision using this Risk Key Performance Indicator Dashboard With Injury Cost Ppt Summary Brochure PDF. This layout presents information on Recordable Incident Rate, Reporting Culture Trend, Project Safety. It is also available for immediate download and adjustment. So, changes can be made in the color, design, graphics or any other component to create a unique layout.

Dashboard To Track Progress Post Implementing Drug Launch Strategy Slides PDF
Following dashboard provides a brief overview of progress post implementing drug launch strategy which can be used by medical representatives to monitor the effectiveness. The key performance indicators are units sold, target, revenue, units unsold etc. Showcasing this set of slides titled Dashboard To Track Progress Post Implementing Drug Launch Strategy Slides PDF. The topics addressed in these templates are Planning, Design, Development, Testing, Launch. All the content presented in this PPT design is completely editable. Download it and make adjustments in color, background, font etc. as per your unique business setting.

Brand Promotion Advertising Dashboard With Purchase Kpis Ppt PowerPoint Presentation File Format PDF
This slide illustrates the KPI dashboard for brand management. It also includes tracking metrics such as brand awareness, brand commitment, brand attribute, advertising awareness, sources of ad awareness, market share, repeat purchase, etc. Showcasing this set of slides titled Brand Promotion Advertising Dashboard With Purchase Kpis Ppt PowerPoint Presentation File Format PDF. The topics addressed in these templates are Brand Awareness, Advertising Awareness, Purchase Frequency. All the content presented in this PPT design is completely editable. Download it and make adjustments in color, background, font etc. as per your unique business setting.

Dashboard Of Property Operations And Maintenance Ppt Infographic Template Objects PDF
This slide focuses on maintenance dashboard for certified reliability engineer which covers team efficiency, cumulative savings, planned maintenance, chiller performance analysis, portfolio comparison, alarm and fault diagnostics, etc. Pitch your topic with ease and precision using this Dashboard Of Property Operations And Maintenance Ppt Infographic Template Objects PDF. This layout presents information on Planned Maintenance Efficiency, Chiller Performance Analysis, Portfolio Comparison Team, Alarm And Fault. It is also available for immediate download and adjustment. So, changes can be made in the color, design, graphics or any other component to create a unique layout.
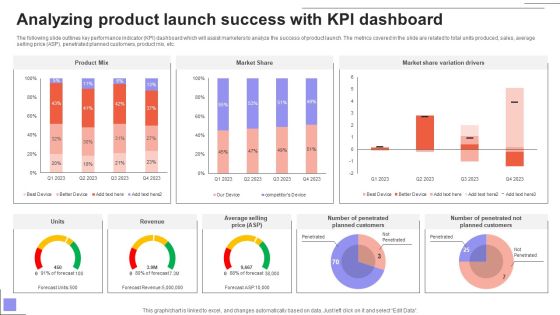
Overview Of The Food Analyzing Product Launch Success With KPI Dashboard Mockup PDF
The following slide outlines key performance indicator KPI dashboard which will assist marketers to analyze the success of product launch. The metrics covered in the slide are related to total units produced, sales, average selling price ASP, penetrated planned customers, product mix, etc. Find a pre-designed and impeccable Overview Of The Food Analyzing Product Launch Success With KPI Dashboard Mockup PDF. The templates can ace your presentation without additional effort. You can download these easy-to-edit presentation templates to make your presentation stand out from others. So, what are you waiting for Download the template from Slidegeeks today and give a unique touch to your presentation.
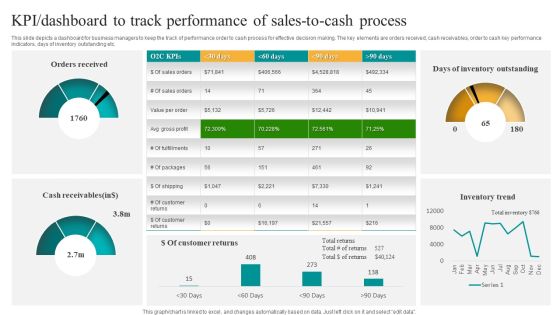
KPI Dashboard To Track Performance Of Sales To Cash Process Download PDF
This slide depicts a dashboard for business managers to keep the track of performance order to cash process for effective decision making. The key elements are orders received, cash receivables, order to cash key performance indicators, days of inventory outstanding etc. Showcasing this set of slides titled KPI Dashboard To Track Performance Of Sales To Cash Process Download PDF. The topics addressed in these templates are Orders Received, Cash Receivables, Days Inventory Outstanding. All the content presented in this PPT design is completely editable. Download it and make adjustments in color, background, font etc. as per your unique business setting.

ERP Change Administration Dashboard With Open Change Requests Wd Topics PDF
This slide showcases ERP change management dashboard to track process implementation efficiency and timely reporting of issues to upper management. It further includes package selection, ERP integration, design and deployment, IT infrastructure, training etc. Pitch your topic with ease and precision using this ERP Change Administration Dashboard With Open Change Requests Wd Topics PDF. This layout presents information on Approval, Status, Requests. It is also available for immediate download and adjustment. So, changes can be made in the color, design, graphics or any other component to create a unique layout.
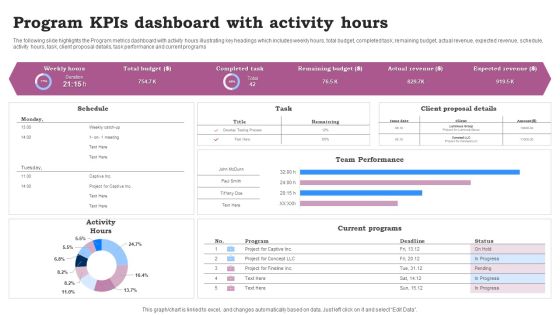
Program Kpis Dashboard With Activity Hours Ppt Infographics Clipart Images PDF
The following slide highlights the Program metrics dashboard with activity hours illustrating key headings which includes weekly hours, total budget, completed task, remaining budget, actual revenue, expected revenue, schedule, activity hours, task, client proposal details, task performance and current programs. Pitch your topic with ease and precision using this Program Kpis Dashboard With Activity Hours Ppt Infographics Clipart Images PDF. This layout presents information on Team Performance, Current Programs, Activity Hours. It is also available for immediate download and adjustment. So, changes can be made in the color, design, graphics or any other component to create a unique layout.

Dashboard Approach For Various Project Tracking Ppt PowerPoint Presentation Gallery Information PDF
Showcasing this set of slides titled dashboard approach for various project tracking ppt powerpoint presentation gallery information pdf. The topics addressed in these templates are design, define, develop. All the content presented in this PPT design is completely editable. Download it and make adjustments in color, background, font etc. as per your unique business setting.

Dashboard For Monitoring Process Performance Of Wastewater Treatment Plant Ppt Infographic Template Demonstration PDF
This slide showcase dashboard for monitoring process performance of wastewater management plant which contains cooling degrees, control, efficiency, protection, etc. Showcasing this set of slides titled Dashboard For Monitoring Process Performance Of Wastewater Treatment Plant Ppt Infographic Template Demonstration PDF. The topics addressed in these templates are Percent Control, Water Use Efficiency, Scale Protection, Protection From Erosion. All the content presented in this PPT design is completely editable. Download it and make adjustments in color, background, font etc. as per your unique business setting.

Lean Operational Excellence Strategy Dashboard To Track And Monitor Project Performance Slides PDF
This slide showcases dashboard which tracks project stages and monitors budget spends and other KPIs. Key project stages included here are overdue tasks, upcoming deadlines, project completion stage, workload factors, etc. Pitch your topic with ease and precision using this Lean Operational Excellence Strategy Dashboard To Track And Monitor Project Performance Slides PDF. This layout presents information on Planning, Design, Development. It is also available for immediate download and adjustment. So, changes can be made in the color, design, graphics or any other component to create a unique layout.
Predictive Analytics Model Performance Tracking Dashboard Forward Looking Analysis IT Introduction PDF
This slide represents the predictive analytics model performance tracking dashboard, and it covers the details of total visitors, total buyers, total products added to the cart, filters by date and category, visitors to clients conversion rate, and so on.The Predictive Analytics Model Performance Tracking Dashboard Forward Looking Analysis IT Introduction PDF is a compilation of the most recent design trends as a series of slides. It is suitable for any subject or industry presentation, containing attractive visuals and photo spots for businesses to clearly express their messages. This template contains a variety of slides for the user to input data, such as structures to contrast two elements, bullet points, and slides for written information. Slidegeeks is prepared to create an impression.
You Tube Advertising Campaign Performance Analytics Dashboard Ppt Icon Diagrams PDF
This slide represents dashboard showing analytics of performance of you tube marketing campaign. It includes data related to no. of visitors, qualified leads, customers and annual recurring revenue, lifetime value, gross volume etc generated through the campaign. Showcasing this set of slides titled You Tube Advertising Campaign Performance Analytics Dashboard Ppt Icon Diagrams PDF. The topics addressed in these templates are Monthly Recurring Revenue, Bounce Rate, Customer Churn Rate. All the content presented in this PPT design is completely editable. Download it and make adjustments in color, background, font etc. as per your unique business setting.

Lean Operational Excellence Strategy Manufacturing Dashboard To Check Production System Efficiency Pictures PDF
This slide showcases manufacturing dashboard to track KPIs defined under lean and kaizen process improvement plans. Key performance metrics included here are TEEP, OEE, loading time, production quality, losses by hours, losses by categories etc. Pitch your topic with ease and precision using this Lean Operational Excellence Strategy Manufacturing Dashboard To Check Production System Efficiency Pictures PDF. This layout presents information on Loading, Availability, Performance. It is also available for immediate download and adjustment. So, changes can be made in the color, design, graphics or any other component to create a unique layout.
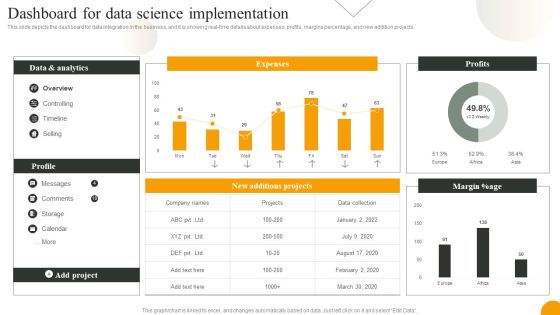
Using Data Science Technologies For Business Transformation Dashboard For Data Science Implementation Portrait PDF
This slide depicts the dashboard for data integration in the business, and it is showing real-time details about expenses, profits, margins percentage, and new addition projects. Take your projects to the next level with our ultimate collection of Using Data Science Technologies For Business Transformation Dashboard For Data Science Implementation Portrait PDF. Slidegeeks has designed a range of layouts that are perfect for representing task or activity duration, keeping track of all your deadlines at a glance. Tailor these designs to your exact needs and give them a truly corporate look with your own brand colors they will make your projects stand out from the rest.
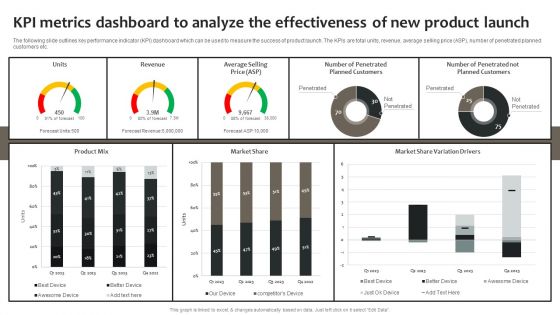
Effective Online And Offline Promotional Kpi Metrics Dashboard To Analyze The Effectiveness Of New Portrait PDF
The following slide outlines key performance indicator KPI dashboard which can be used to measure the success of product launch. The KPIs are total units, revenue, average selling price ASP, number of penetrated planned customers etc. From laying roadmaps to briefing everything in detail, our templates are perfect for you. You can set the stage with your presentation slides. All you have to do is download these easy-to-edit and customizable templates. Effective Online And Offline Promotional Kpi Metrics Dashboard To Analyze The Effectiveness Of New Portrait PDF will help you deliver an outstanding performance that everyone would remember and praise you for. Do download this presentation today.
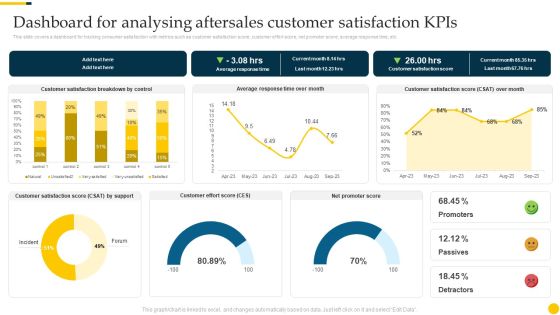
Increasing Customer Dashboard For Analysing Aftersales Customer Satisfaction Kpis Elements PDF
This slide covers a dashboard for tracking consumer satisfaction with metrics such as customer satisfaction score, customer effort score, net promoter score, average response time, etc. The Increasing Customer Dashboard For Analysing Aftersales Customer Satisfaction Kpis Elements PDF is a compilation of the most recent design trends as a series of slides. It is suitable for any subject or industry presentation, containing attractive visuals and photo spots for businesses to clearly express their messages. This template contains a variety of slides for the user to input data, such as structures to contrast two elements, bullet points, and slides for written information. Slidegeeks is prepared to create an impression.
Google Keyword Assessment KPI Dashboard For Tracking Improvement In Website Traffic Infographics PDF
Following slide demonstrates keyword analysis dashboard which can be used by business to track website traffic performance. It includes metrics such as average keyword position, keyword ranking distribution, keyword ranking, keyword in top 3, top 10, top 20 and top 100. Showcasing this set of slides titled Google Keyword Assessment KPI Dashboard For Tracking Improvement In Website Traffic Infographics PDF. The topics addressed in these templates are Keyword Ranking, Keyword Ranking Distribution, Average Keyword Position. All the content presented in this PPT design is completely editable. Download it and make adjustments in color, background, font etc. as per your unique business setting.

KPI Metrics Dashboard To Analyze The Effectiveness Of New Introducing New Food Pictures PDF
The following slide outlines key performance indicator KPI dashboard which can be used to measure the success of product launch. The KPIs are total units, revenue, average selling price ASP, number of penetrated planned customers etc. Make sure to capture your audiences attention in your business displays with our gratis customizable KPI Metrics Dashboard To Analyze The Effectiveness Of New Introducing New Food Pictures PDF. These are great for business strategies, office conferences, capital raising or task suggestions. If you desire to acquire more customers for your tech business and ensure they stay satisfied, create your own sales presentation with these plain slides.

Strategies For Effective Product Metric Dashboard To Measure Product Performance Download PDF
This slide represents KPI dashboard for measuring product performance. It covers total activities, new customers, events, net promoter score etc. Welcome to our selection of the Strategies For Effective Product Metric Dashboard To Measure Product Performance Download PDF. These are designed to help you showcase your creativity and bring your sphere to life. Planning and Innovation are essential for any business that is just starting out. This collection contains the designs that you need for your everyday presentations. All of our PowerPoints are 100 percent editable, so you can customize them to suit your needs. This multi-purpose template can be used in various situations. Grab these presentation templates today.

Private Equity Fund Pitch Deck To Raise Series C Funding Social Media Performance Dashboard Topics PDF
This slide shows a dashboard depicting the performance of Social Media Channel used by the company along with number of conversions, Visits through Social referrals, social Networks etc. This is a private equity fund pitch deck to raise series c funding social media performance dashboard topics pdf template with various stages. Focus and dispense information on three stages using this creative set, that comes with editable features. It contains large content boxes to add your information on topics like social sources, social plugins, social source, shared url. You can also showcase facts, figures, and other relevant content using this PPT layout. Grab it now.

Dashboard To Track Inventory Status In Sales To Cash Process Themes PDF
This slide depicts a dashboard for business managers to keep the track of inventory in order to cash process for easy understanding and decision making. The major key performing indicators are inventory status, surplus stock, dead inventory, sales by product grades etc. Showcasing this set of slides titled Dashboard To Track Inventory Status In Sales To Cash Process Themes PDF. The topics addressed in these templates are Inventory Status, Surplus Stock, Dead Inventory. All the content presented in this PPT design is completely editable. Download it and make adjustments in color, background, font etc. as per your unique business setting.

Dashboard To Monitor International Footprint Of Supply Chain Operations Brochure PDF
This slide depicts a dashboard that will be used by managers to monitor the global footprint of supply chain operations. Major key performance indicators include total global emissions, time frame, allocation, electricity, etc. Showcasing this set of slides titled Dashboard To Monitor International Footprint Of Supply Chain Operations Brochure PDF. The topics addressed in these templates are Electricity, Footprint Emissions, Allocation. All the content presented in this PPT design is completely editable. Download it and make adjustments in color, background, font etc. as per your unique business setting.

Key Business Metrics Dashboard Company Process Administration And Optimization Playbook Infographics PDF
The following dashboard displays the key business metrics such as new customers, profit, revenue per customer, and weekly revenue. Slidegeeks is here to make your presentations a breeze with Key Business Metrics Dashboard Company Process Administration And Optimization Playbook Infographics PDF With our easy-to-use and customizable templates, you can focus on delivering your ideas rather than worrying about formatting. With a variety of designs to choose from, you are sure to find one that suits your needs. And with animations and unique photos, illustrations, and fonts, you can make your presentation pop. So whether you are giving a sales pitch or presenting to the board, make sure to check out Slidegeeks first.
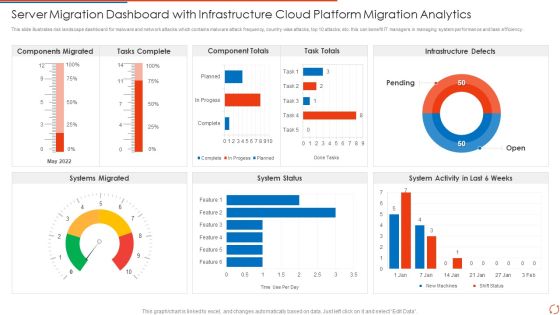
Server Migration Dashboard With Infrastructure Cloud Platform Migration Analytics Elements PDF Portrait PDF
This slide illustrates risk landscape dashboard for malware and network attacks which contains malware attack frequency, country wise attacks, top 10 attacks, etc. this can benefit IT managers in managing system performance and task efficiency Pitch your topic with ease and precision using this Server Migration Dashboard With Infrastructure Cloud Platform Migration Analytics Elements PDF Portrait PDF. This layout presents information on Tasks Complete, Component Totals, Task Totals. It is also available for immediate download and adjustment. So, changes can be made in the color, design, graphics or any other component to create a unique layout.

Customer Success KPIS Overview Dashboard For Technical Support Team Ppt PowerPoint Presentation Gallery Layouts PDF
This slide covers dashboard with parameters to monitor performance for customer success programs. It includes percentage of customers helped, team report metrics, new customers, MRR, revenue churn, cancellation and refunds. Showcasing this set of slides titled Customer Success KPIS Overview Dashboard For Technical Support Team Ppt PowerPoint Presentation Gallery Layouts PDF. The topics addressed in these templates are Customer, Cancelations, New Customer, Revenue Churn. All the content presented in this PPT design is completely editable. Download it and make adjustments in color, background, font etc. as per your unique business setting.

Successful Staff Retention Techniques KPI Metrics Dashboard Highlighting Employee Retention Rate Pictures PDF
The purpose of this slide is to exhibit a key performance indicator KPI dashboard through which managers can analyze the monthly employee retention rate. The metrics covered in the slide are active employees, new candidates hired, internal, exit, employee turnover rate, etc. Make sure to capture your audiences attention in your business displays with our gratis customizable Successful Staff Retention Techniques KPI Metrics Dashboard Highlighting Employee Retention Rate Pictures PDF. These are great for business strategies, office conferences, capital raising or task suggestions. If you desire to acquire more customers for your tech business and ensure they stay satisfied, create your own sales presentation with these plain slides.

Digital Risk Assessment Key Metrics Monitoring Dashboard Ppt Ideas Diagrams PDF
The following slide highlights the cyber security key metrics monitoring dashboard illustrating critical applications, mission critical, other regulations, SOX, key metrics, controls, audits and cyber security training compliance. Showcasing this set of slides titled Digital Risk Assessment Key Metrics Monitoring Dashboard Ppt Ideas Diagrams PDF. The topics addressed in these templates are Critical Applications, Mission Critical, Other Regulation. All the content presented in this PPT design is completely editable. Download it and make adjustments in color, background, font etc. as per your unique business setting.
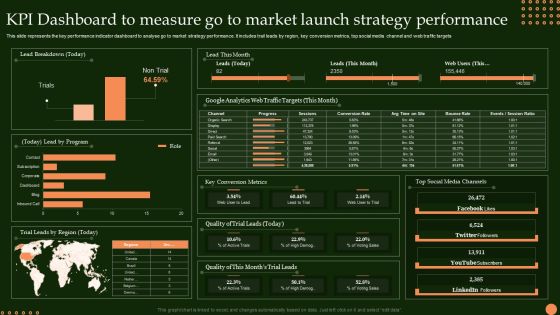
KPI Dashboard To Measure Go To Market Launch Strategy Performance Sample PDF
This slide represents the key performance indicator dashboard to analyse go to market strategy performance. It includes trail leads by region, key conversion metrics, top social media channel and web traffic targets Pitch your topic with ease and precision using this KPI Dashboard To Measure Go To Market Launch Strategy Performance Sample PDF. This layout presents information on Lead Breakdown, Lead By Program, Trial Leads Region. It is also available for immediate download and adjustment. So, changes can be made in the color, design, graphics or any other component to create a unique layout.

KPI Dashboard To Monitor Beauty Care Products Sales Performance Ppt Outline Example Topics PDF
This slide shows the key performance indicators dashboard which can be used to analyze current financial position of cosmetic business. It includes metrics such as sales, expenses, profit, cash in hand, etc. Showcasing this set of slides titled KPI Dashboard To Monitor Beauty Care Products Sales Performance Ppt Outline Example Topics PDF. The topics addressed in these templates are Accounts Receivable, Profit Margin, Expense. All the content presented in this PPT design is completely editable. Download it and make adjustments in color, background, font etc. as per your unique business setting.

KPI Dashboard To Track Beauty Care Products Sales Performance Ppt Outline Pictures PDF
This slide shows the key performance indicators dashboard which can be used to analyze current financial position of cosmetic business. It includes metrics such as sales, expenses, profit, cash in hand, etc. Showcasing this set of slides titled KPI Dashboard To Track Beauty Care Products Sales Performance Ppt Outline Pictures PDF. The topics addressed in these templates are Sales Number, Total Sales, Total Profit, Cost. All the content presented in this PPT design is completely editable. Download it and make adjustments in color, background, font etc. as per your unique business setting.

KPI Dashboard To Monitor E Commerce Revenue Analysis Performance Mockup PDF
This slide shows the key performance indicators dashboard which can be used to analyze current financial position of e-commerce business. It includes metrics such as revenue, expenses, profit, cash in hand, etc. Showcasing this set of slides titled KPI Dashboard To Monitor E Commerce Revenue Analysis Performance Mockup PDF. The topics addressed in these templates are Accounts Receivable, Accounts Payable, Revenue, Expenses. All the content presented in this PPT design is completely editable. Download it and make adjustments in color, background, font etc. as per your unique business setting.

Kpi Dashboard To Track Progress Of Tactics To Launch New Product Infographics PDF
Mentioned slide showcases KPI dashboard to monitor impact of product launch strategy on increasing business market share. It includes elements such as revenue, new customers, lead generation rate, customer satisfaction rate, revenue by customers, revenue and lead generation by marketing platform. Showcasing this set of slides titled Kpi Dashboard To Track Progress Of Tactics To Launch New Product Infographics PDF. The topics addressed in these templates are Quarterly Sales Comparison, Revenue Marketing, Revenue Customers. All the content presented in this PPT design is completely editable. Download it and make adjustments in color, background, font etc. as per your unique business setting.

KPI Dashboard To Track Marketing Return On Investment Performance Background PDF
This slide shows key performance indicators dashboard to measure the performs of marketing campaign. It includes metrics such as campaign score, standard customers, growth rate, campaign income, etc. Showcasing this set of slides titled KPI Dashboard To Track Marketing Return On Investment Performance Background PDF. The topics addressed in these templates are Customer Distribution, Standard Customers, Growth Rate. All the content presented in this PPT design is completely editable. Download it and make adjustments in color, background, font etc. as per your unique business setting.

Marketing Performance Dashboard With Analytics Campaign Ppt Infographics Background Images PDF
This slide represents dashboard for campaign performance analytics report. It covers total clicks, CTR, impressions , view-through conversions , total conversion, lead generation, activity per click etc to track campaign progress. Showcasing this set of slides titled Marketing Performance Dashboard With Analytics Campaign Ppt Infographics Background Images PDF. The topics addressed in these templates are Total Clicks, Total Impressions, Total Conversions, Activity Per Click. All the content presented in this PPT design is completely editable. Download it and make adjustments in color, background, font etc. as per your unique business setting.
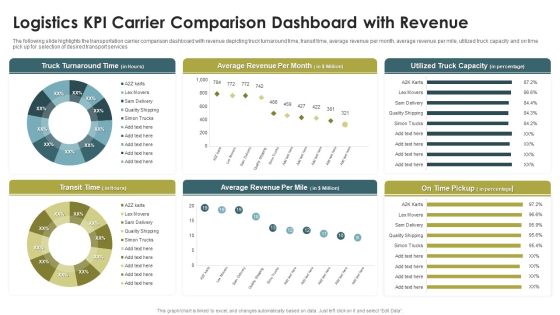
Logistics KPI Carrier Comparison Dashboard With Revenue Ppt Infographics Portfolio PDF
The following slide highlights the transportation carrier comparison dashboard with revenue depicting truck turnaround time, transit time, average revenue per month, average revenue per mile, utilized truck capacity and on time pick up for selection of desired transport services. Pitch your topic with ease and precision using this Logistics KPI Carrier Comparison Dashboard With Revenue Ppt Infographics Portfolio PDF. This layout presents information on Truck Turnaround Time, Average Revenue, Per Month, Transit Time. It is also available for immediate download and adjustment. So, changes can be made in the color, design, graphics or any other component to create a unique layout.
Tracking Dashboard Showing Project Tasks Progress Ppt PowerPoint Presentation File Example Introduction PDF
Showcasing this set of slides titled tracking dashboard showing project tasks progress ppt powerpoint presentation file example introduction pdf. The topics addressed in these templates are monitoring, resources, sales. All the content presented in this PPT design is completely editable. Download it and make ajustments in color, background, font etc. as per your unique business setting.
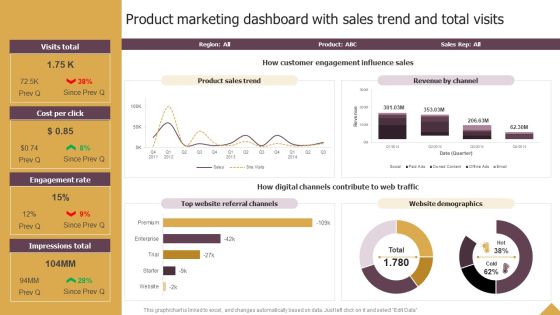
Product Marketing Dashboard With Sales Trend And Total Visits Ppt Inspiration Show PDF
Explore a selection of the finest Product Marketing Dashboard With Sales Trend And Total Visits Ppt Inspiration Show PDF here. With a plethora of professionally designed and pre made slide templates, you can quickly and easily find the right one for your upcoming presentation. You can use our Product Marketing Dashboard With Sales Trend And Total Visits Ppt Inspiration Show PDF to effectively convey your message to a wider audience. Slidegeeks has done a lot of research before preparing these presentation templates. The content can be personalized and the slides are highly editable. Grab templates today from Slidegeeks.

Strategic Components Of Product Advertising Product Marketing Dashboard With Sales Trend And Total Visits Information PDF
Explore a selection of the finest Strategic Components Of Product Advertising Product Marketing Dashboard With Sales Trend And Total Visits Information PDF here. With a plethora of professionally designed and pre made slide templates, you can quickly and easily find the right one for your upcoming presentation. You can use our Strategic Components Of Product Advertising Product Marketing Dashboard With Sales Trend And Total Visits Information PDF to effectively convey your message to a wider audience. Slidegeeks has done a lot of research before preparing these presentation templates. The content can be personalized and the slides are highly editable. Grab templates today from Slidegeeks.

Guide To Healthcare Services Administration Dashboard To Evaluate The Hospital Operations Performance Infographics PDF
The following slide showcases dashboard which can be used by the healthcare professionals to measure the performance of operational department. The KPIs covered in the slide are total patients, operational cost, available staff per division etc. If your project calls for a presentation, then Slidegeeks is your go to partner because we have professionally designed, easy to edit templates that are perfect for any presentation. After downloading, you can easily edit Guide To Healthcare Services Administration Dashboard To Evaluate The Hospital Operations Performance Infographics PDF and make the changes accordingly. You can rearrange slides or fill them with different images. Check out all the handy templates

Risk Assessment Software Dashboard For Cybersecurity Ppt PowerPoint Presentation Gallery Pictures PDF
This slide represents risk assessment software dashboard for cybersecurity. It includes risk percentage, number of risks, risk analysis progress, risk response progress, risk rating etc. Showcasing this set of slides titled Risk Assessment Software Dashboard For Cybersecurity Ppt PowerPoint Presentation Gallery Pictures PDF. The topics addressed in these templates are Risk Rating Breakdown, Action Plan Breakdown, Top 5 Entities Prone To Risk. All the content presented in this PPT design is completely editable. Download it and make adjustments in color, background, font etc. as per your unique business setting.

Monthly Project Progress Report Dashboard With Assigned Tasks Ppt Styles Clipart PDF
This slide showcases monthly project status dashboard with assigned tasks. It provides information about kick off meeting, resource plan, technical requests, development, hardware configuration, budget, pending items, etc. Pitch your topic with ease and precision using this Monthly Project Progress Report Dashboard With Assigned Tasks Ppt Styles Clipart PDF. This layout presents information on Pending Items, Budget, Kick Off Meeting. It is also available for immediate download and adjustment. So, changes can be made in the color, design, graphics or any other component to create a unique layout.

Project Controlling Dashboard Indicating Stages And Deliverables Ppt Styles Guide PDF
This slide shows dashboard for controlling multiple phases and deliverables of project. It provides information such as total revenue, cost, margin, task by status, risk, planned end date, owner, etc. Pitch your topic with ease and precision using this Project Controlling Dashboard Indicating Stages And Deliverables Ppt Styles Guide PDF. This layout presents information on Total Revenue, Total Margin, Total Cost. It is also available for immediate download and adjustment. So, changes can be made in the color, design, graphics or any other component to create a unique layout.

KPI Dashboard To Assess Deals In Mergers And Acquisitions Strategy Rules PDF
Following slide showcases dashboard for mergers and acquisitions to measure effects of milestones to confirm integration plan accordingly. It presents information related to deals by types, country, etc. Pitch your topic with ease and precision using this KPI Dashboard To Assess Deals In Mergers And Acquisitions Strategy Rules PDF. This layout presents information on Status, Strategy, Minority Equity Stake. It is also available for immediate download and adjustment. So, changes can be made in the color, design, graphics or any other component to create a unique layout.

Retail Store Data Map Dashboard Ppt PowerPoint Presentation Gallery Display PDF
This slide shows retail store data inventory dashboard. It provides information such as units sold, on hand, stock availability, top selling items, average inventory value by product category, etc. Pitch your topic with ease and precision using this Retail Store Data Map Dashboard Ppt PowerPoint Presentation Gallery Display PDF. This layout presents information on Inventory Turn, Over Ratio, Gross Margin ROI. It is also available for immediate download and adjustment. So, changes can be made in the color, design, graphics or any other component to create a unique layout.

Personnel Salary Summary Dashboard With EPF And ESI Data Brochure PDF
The following highlights the slide employee payroll summary dashboard with EPF and ESI data illustrating key headings which includes payroll period, tasks to do, payroll deductions, employee summary and payroll cost. Pitch your topic with ease and precision using this Personnel Salary Summary Dashboard With EPF And ESI Data Brochure PDF. This layout presents information on Employee Provident Fund, Employee State Insurance, Tax Deducted At Source. It is also available for immediate download and adjustment. So, changes can be made in the color, design, graphics or any other component to create a unique layout.
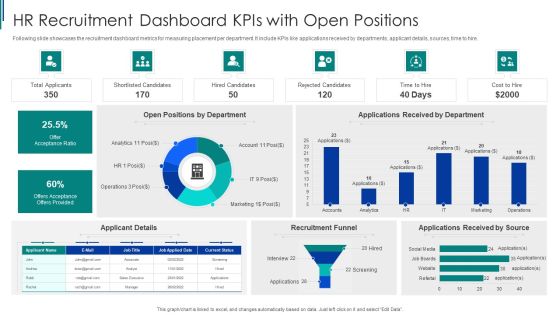
HR Recruitment Dashboard Kpis With Open Positions Ppt Model Good PDF
Following slide showcases the recruitment dashboard metrics for measuring placement per department. It include KPIs like applications received by departments, applicant details, sources, time to hire. Pitch your topic with ease and precision using this HR Recruitment Dashboard Kpis With Open Positions Ppt Model Good PDF. This layout presents information on Offer Acceptance Ratio, Recruitment Funnel, Applicant Details. It is also available for immediate download and adjustment. So, changes can be made in the color, design, graphics or any other component to create a unique layout.

Application Of Artificial Intelligence AI Driven Dashboard With Website Kpis Formats PDF
This slide shows AI driven dashboard with website KPIs. It provides information such as total visits, traffic sources, geography, bounce rate, monthly visits, average visit time, etc. Showcasing this set of slides titled Application Of Artificial Intelligence AI Driven Dashboard With Website Kpis Formats PDF. The topics addressed in these templates are Bounce Rate, Monthly Visits, Traffic Sources. All the content presented in this PPT design is completely editable. Download it and make adjustments in color, background, font etc. as per your unique business setting.

Customer Centric Success KPIS Dashboard Ppt PowerPoint Presentation Styles Example File PDF
This slide covers dashboard for customer oriented success metrics. It includes KPIs such as net promoter score, customer loyalty rate, premium users, customer lifetime value, customer and revenue churn rates, MRR growth and net retention rates, etc. Showcasing this set of slides titled Customer Centric Success KPIS Dashboard Ppt PowerPoint Presentation Styles Example File PDF. The topics addressed in these templates are New Retention, Customer Churn, Revenue Churn. All the content presented in this PPT design is completely editable. Download it and make adjustments in color, background, font etc. as per your unique business setting.

Customer Lifetime Value Based Success KPIS Dashboard Ppt PowerPoint Presentation Layouts Gridlines PDF
This slide covers dashboard for estimation of customer lifetime value as success metrics. It includes KPIs such as customer lifetime value, customer lifetime period, customer risk, customer contact rate, customer retention costs, average lifetime value, customer churn rate, average revenue per account, etc. Pitch your topic with ease and precision using this Customer Lifetime Value Based Success KPIS Dashboard Ppt PowerPoint Presentation Layouts Gridlines PDF. This layout presents information on Average Revenue, Customer Lifetime, Customer Risk. It is also available for immediate download and adjustment. So, changes can be made in the color, design, graphics or any other component to create a unique layout.

Customer Retention Based Success KPIS Dashboard Ppt PowerPoint Presentation Slides Graphics Pictures PDF
This slide covers dashboard for estimation of customer retention based success metrics. It includes KPIs such as net retention rates including expansion, contractions, net MRR, cancelled accounts, etc. Showcasing this set of slides titled Customer Retention Based Success KPIS Dashboard Ppt PowerPoint Presentation Slides Graphics Pictures PDF. The topics addressed in these templates are Account Retention, Cancelled Accounts, Retention Components. All the content presented in this PPT design is completely editable. Download it and make adjustments in color, background, font etc. as per your unique business setting.

Technical HR Recruitment Dashboard Kpis With Hiring Sources Ppt Outline PDF
This slide showcases recruitment dashboard for technical and non-technical positions in company. It include metrics like average days to hire, to fill, hiring pipeline, sources and cost. Showcasing this set of slides titled Technical HR Recruitment Dashboard Kpis With Hiring Sources Ppt Outline PDF. The topics addressed in these templates are Recruitment Costs, Technical Hiring, Top Hiring Sources. All the content presented in this PPT design is completely editable. Download it and make adjustments in color, background, font etc. as per your unique business setting.

Monthly Profit And Loss Dashboard Reports With Expenses And Revenue Kpis Portrait PDF
This slide shows a dashboard of monthly profit and loss transactions of a company. It depicts last six months expenses, revenues, payment status and customer growth.Showcasing this set of slides titled Monthly Profit And Loss Dashboard Reports With Expenses And Revenue Kpis Portrait PDF. The topics addressed in these templates are Overall Profit Margin, Overall Outstanding Revenue, Customer Growth. All the content presented in this PPT design is completely editable. Download it and make adjustments in color, background, font etc. as per your unique business setting.
SFA Dashboard To Track Performance Ppt PowerPoint Presentation Icon Example File PDF
This Slide visually represents sales force automation dashboard to track performance which can be utilized by marketing managers to streamline the process of automated selling. It includes information about sales pipeline, competitors, opportunities, key competitors, etc. Pitch your topic with ease and precision using this sfa dashboard to track performance ppt powerpoint presentation icon example file pdf. This layout presents information on sales pipeline, sales pipeline by sales rep, key competitors, forecast by month, key opportunities. It is also available for immediate download and adjustment. So, changes can be made in the color, design, graphics or any other component to create a unique layout.
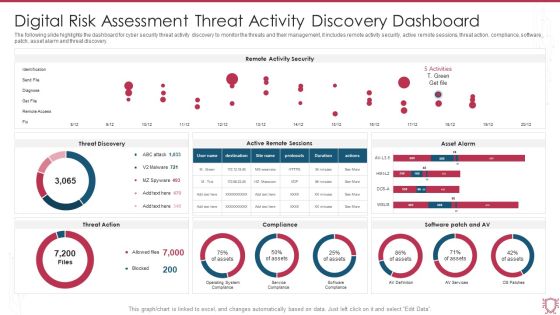
Digital Risk Assessment Threat Activity Discovery Dashboard Ppt Ideas Skills PDF
The following slide highlights the dashboard for cyber security threat activity discovery to monitor the threats and their management, it includes remote activity security, active remote sessions, threat action, compliance, software patch, asset alarm and threat discovery. Pitch your topic with ease and precision using this Digital Risk Assessment Threat Activity Discovery Dashboard Ppt Ideas Skills PDF. This layout presents information on Remote Activity Security, Threat Discovery, Asset Alarm. It is also available for immediate download and adjustment. So, changes can be made in the color, design, graphics or any other component to create a unique layout.

Procedure Dashboard Indicating Integration Of Home Activities With Automation Ppt PowerPoint Presentation File Files PDF
This slide shows process dashboard indicating integration of home activities with automation which contains temperature, average humidity, intensity of light, bedroom, kitchen and dining. It can be beneficial for households who have transformed their homes into smart integrated systems and manage various priorities in one touch.Showcasing this set of slides titled Procedure Dashboard Indicating Integration Of Home Activities With Automation Ppt PowerPoint Presentation File Files PDF. The topics addressed in these templates are Average Humidity, Temperature, Intensity Light. All the content presented in this PPT design is completely editable. Download it and make adjustments in color, background, font etc. as per your unique business setting.

Business To Business Model Marketing Dashboard With Total Deals Ppt Professional Inspiration PDF
This slide b2b business marketing and deal management dashboard. It provides information about spend per office, monthly recurring revenue MRR, revenue on ad spend ROAS, demos, deals, closed, won, etc. Showcasing this set of slides titled Business To Business Model Marketing Dashboard With Total Deals Ppt Professional Inspiration PDF. The topics addressed in these templates are Demos Requested, Demos Delivered, Deals Created. All the content presented in this PPT design is completely editable. Download it and make adjustments in color, background, font etc. as per your unique business setting.
