Errc Graph
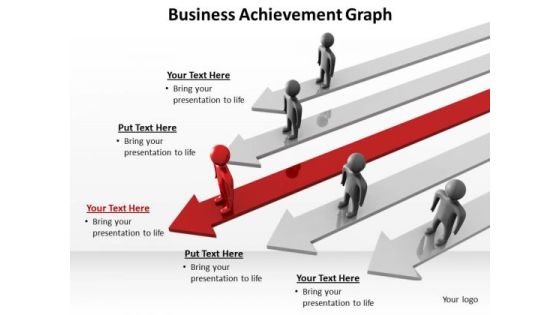
Mba Models And Frameworks Business Achievement Graph Consulting Diagram
Our MBA Models And Frameworks Business Achievement Graph Consulting Diagram Powerpoint Templates And Your Ideas Make A Great Doubles Pair. Play The Net With Assured Hands.
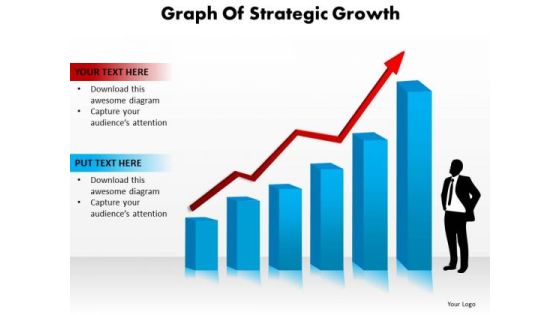
Strategy Diagram Graph Of Strategic Growth Business Cycle Diagram
Our Strategy Diagram Graph Of Strategic Growth Business Cycle Diagram Powerpoint Templates Heighten Concentration. Your Audience Will Be On The Edge.
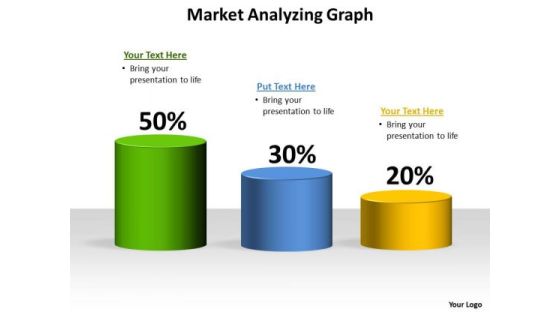
Business Finance Strategy Development Market Analyzing Graph Strategic Management
Establish The Dominance Of Your Ideas. Our Business Finance Strategy Development Market Analyzing Graph Strategic Management Powerpoint Templates Will Put Them On Top.
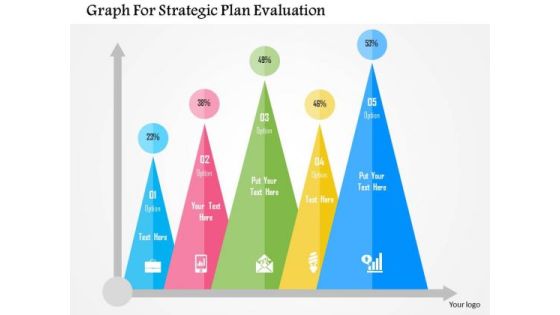
Business Diagram Graph For Strategic Plan Evaluation Presentation Template
Strategic plan evaluation can be explained with this diagram. It contains business statistics graph with icons. Download this diagram slide to make impressive presentations.

Graph On Tablet For Segmentation Strategy Powerpoint Template
Concept of segmentation strategy can be explained with this diagram. This PowerPoint template contains graph on computer tablet. Download this diagram slide to make interactive presentations.

Bar Graph Infographics For Business Analysis Powerpoint Template
This PowerPoint template contains bar graph with icons. This PPT slide helps to exhibit concepts like strategy, direction and success. Use this business slide to make impressive presentations.

Product Launch Budget Plan Bar Graph Ppt Slides
This is a product launch budget plan bar graph ppt slides. This is a eight stage process. The stages in this process are business, finance, marketing.
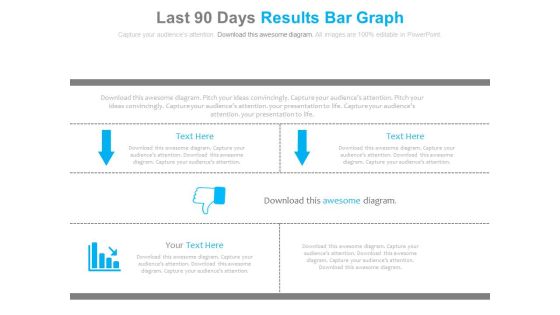
Last 90 Days Results Bar Graph Ppt Slides
This is a last 90 days results bar graph ppt slides. This is a three stage process. The stages in this process are arrows, business, marketing.
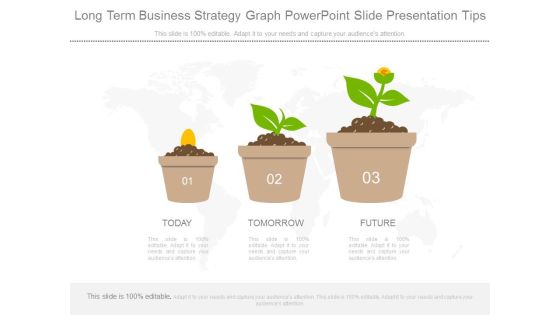
Long Term Business Strategy Graph Powerpoint Slide Presentation Tips
This is a long term business strategy graph powerpoint slide presentation tips. This is a three stage process. The stages in this process are today, tomorrow, future.

Curve Bar Graph For Process Capability Measurement Powerpoint Guide
This is a curve bar graph for process capability measurement powerpoint guide. This is a nine stage process. The stages in this process are target, lsl, usl, category.

Competitive Environment Analysis Bar Graph Ppt Slide Templates
This is a competitive environment analysis bar graph ppt slide templates. This is a one stage process. The stages in this process are engagement, brand, monthly, weekly.

Gross Margin Improvement Bar Graph Dashboard Powerpoint Slide Download
This is a gross margin improvement bar graph dashboard powerpoint slide download. This is a two stage process. The stages in this process are chart title.

Ebitda Highlights Growth Indication Bar Graph Powerpoint Slide Backgrounds
This is a ebitda highlights growth indication bar graph powerpoint slide backgrounds. This is a five stage process. The stages in this process are ebitda, ebitda margins, category.

Financials Bar Graph For Expectation Analysis Powerpoint Slide Deck Samples
This is a financials bar graph for expectation analysis powerpoint slide deck samples. This is a four stage process. The stages in this process are product version.

Bar Graph For Career Advancement Sample Of Ppt
This is a bar graph for career advancement sample of ppt. This is a six stage process. The stages in this process are business, strategy, management, growth, process.

bar graph template 2 ppt powerpoint presentation gallery
This is a bar graph template 2 ppt powerpoint presentation gallery. This is a four stage process. The stages in this process are business, marketing, product, analysis, growth.

Bar Graph Ppt PowerPoint Presentation Infographic Template Visuals
This is a bar graph ppt powerpoint presentation infographic template visuals. This is a twelve stage process. The stages in this process are business, marketing, management, growth, planning.

Bar Graph Ppt PowerPoint Presentation Outline Slide Download
This is a bar graph ppt powerpoint presentation outline slide download. This is a four stage process. The stages in this process are business, marketing, finance, timeline, growth.

Elevator Pitch Template 1 Ppt PowerPoint Presentation Diagram Graph Charts
This is a elevator pitch template 1 ppt powerpoint presentation diagram graph charts. This is a three stage process. The stages in this process are what, why, how.

Bar Graph Ppt Powerpoint Presentation Inspiration Background Image
This is a bar graph ppt powerpoint presentation inspiration background image. This is a four stage process. The stages in this process are australia, china, brazil, united states.

Bar Graph Ppt PowerPoint Presentation Visual Aids Styles
This is a bar graph ppt powerpoint presentation visual aids styles. This is a five stage process. The stages in this process are finance, analysis, planning, business, process.

Bar Graph Ppt PowerPoint Presentation Pictures Graphic Images
This is a bar graph ppt powerpoint presentation pictures graphic images. This is a two stage process. The stages in this process are actual, target, growth, success.

Bar Graph Ppt PowerPoint Presentation Styles File Formats
This is a bar graph ppt powerpoint presentation styles file formats. This is a four stage process. The stages in this process are percentage, business, marketing, finance, strategy.

Bar Graph Ppt PowerPoint Presentation Portfolio Example Topics
This is a bar graph ppt powerpoint presentation portfolio example topics. This is a four stage process. The stages in this process are business, marketing, management, success, planning.

Market Segmentation Ppt PowerPoint Presentation Diagram Graph Charts
This is a market segmentation ppt powerpoint presentation diagram graph charts. This is a four stage process. The stages in this process are geographic, demographic, psychographic, behavioral.

Bar Graph Finance Ppt PowerPoint Presentation Icon Good
This is a bar graph finance ppt powerpoint presentation icon good. This is a two stage process. The stages in this process are analysis, finance, marketing, management, investment.

Bar Graph Finance Ppt PowerPoint Presentation Pictures Elements
This is a bar graph finance ppt powerpoint presentation pictures elements. This is a three stage process. The stages in this process are finance, marketing, management, investment, analysis.

bar graph finance ppt powerpoint presentation portfolio summary
This is a bar graph finance ppt powerpoint presentation portfolio summary. This is a three stage process. The stages in this process are finance, marketing, management, investment, analysis.

Bar Graph Chart Ppt PowerPoint Presentation Portfolio Templates
This is a bar graph chart ppt powerpoint presentation portfolio templates. This is a two stage process. The stages in this process are financial, minimum, medium, maximum.
Direct Sales Lead Ppt Powerpoint Presentation Diagram Graph Charts Cpb
This is a direct sales lead ppt powerpoint presentation diagram graph charts cpb. This is a two stage process. The stages in this process are direct sales lead.
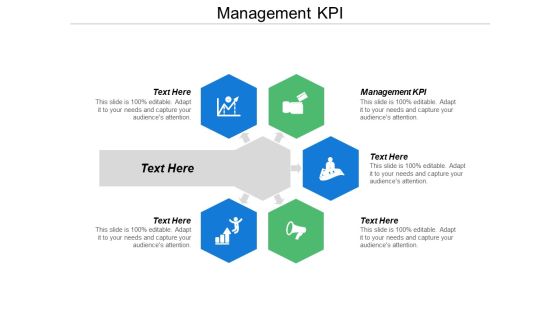
Management Kpi Ppt Powerpoint Presentation Diagram Graph Charts Cpb
This is a management kpi ppt powerpoint presentation diagram graph charts cpb. This is a five stage process. The stages in this process are management kpi.

Bar Graph Finance Ppt Powerpoint Presentation Layouts Mockup
This is a bar graph finance ppt powerpoint presentation layouts mockup. This is a three stage process. The stages in this process are finance, marketing, management, investment, analysis.

Bar Graph Finance Ppt Powerpoint Presentation File Ideas
This is a bar graph finance ppt powerpoint presentation file ideas. This is a four stage process. The stages in this process are finance, marketing, management, investment, analysis.

Column Chart Graph Ppt PowerPoint Presentation Outline Information
This is a column chart graph ppt powerpoint presentation outline information. This is a three stage process. The stages in this process are compare, marketing, business, management, planning.

Stock Chart Graph Ppt PowerPoint Presentation Ideas Demonstration
This is a stock chart graph ppt powerpoint presentation ideas demonstration. This is a three stage process. The stages in this process are finance, marketing, management, investment, analysis.

Clustered Column Graph Ppt PowerPoint Presentation Pictures Grid
This is a clustered column graph ppt powerpoint presentation pictures grid. This is a two stage process. The stages in this process are finance, marketing, management, investment, analysis.
Project Management Gantt Chart Graph Ppt PowerPoint Presentation Styles Icon
This is a project management gantt chart graph ppt powerpoint presentation styles icon. This is a four stage process. The stages in this process are four.

Bar Graph Finance Ppt PowerPoint Presentation Styles Slide
This is a bar graph finance ppt powerpoint presentation styles slide. This is a three stage process. The stages in this process are finance, marketing, management, investment, analysis.

Combo Chart Graph Ppt PowerPoint Presentation Inspiration Template
This is a combo chart graph ppt powerpoint presentation inspiration template. This is a three stage process. The stages in this process are finance, marketing, management, investment, analysis.

Pie Financial Graph Ppt PowerPoint Presentation Model Gridlines
This is a pie financial graph ppt powerpoint presentation model gridlines. This is a three stage process. The stages in this process are finance, marketing, management, investment, analysis.

Pie Financial Graph Ppt PowerPoint Presentation Gallery Gridlines
This is a pie financial graph ppt powerpoint presentation gallery gridlines. This is a three stage process. The stages in this process are finance, marketing, management, investment, analysis.

Combo Chart Graph Ppt PowerPoint Presentation Infographics Guide
This is a combo chart graph ppt powerpoint presentation infographics guide. This is a two stage process. The stages in this process are marketing, business, management, planning, strategy.

Clustered Bar Graph Ppt PowerPoint Presentation Outline Layouts
This is a clustered bar graph ppt powerpoint presentation outline layouts. This is a three stage process. The stages in this process are finance, marketing, analysis, investment, million.
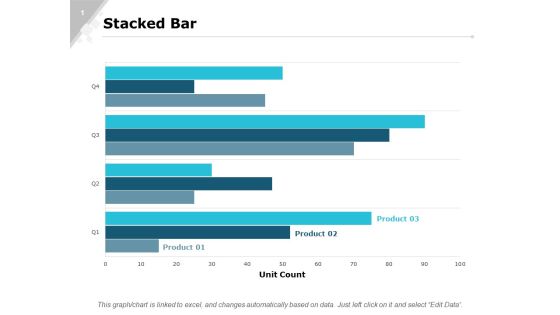
Stacked Bar Graph Ppt PowerPoint Presentation Inspiration Images
This is a stacked bar graph ppt powerpoint presentation inspiration images. This is a three stage process. The stages in this process are finance, marketing, analysis, investment, million.

Clustered Chart Graph Ppt PowerPoint Presentation Gallery Backgrounds
This is a clustered chart graph ppt powerpoint presentation gallery backgrounds. This is a three stage process. The stages in this process are finance, marketing, analysis, investment, million.

Combo Chart Graph Ppt PowerPoint Presentation Professional Guidelines
This is a combo chart graph ppt powerpoint presentation professional guidelines. This is a three stage process. The stages in this process are finance, marketing, analysis, investment, million.

Yearly Comparison Graph For Human Resource Employees Salary Template PDF
This slide showcases yearly comparison of salary of different employees in organization and identify the increment growth rate. It showcases comparative assessment for a period of 4 years. Pitch your topic with ease and precision using this Yearly Comparison Graph For Human Resource Employees Salary Template PDF. This layout presents information on Human Resource, Employees Salary. It is also available for immediate download and adjustment. So, changes can be made in the color, design, graphics or any other component to create a unique layout.

Yearly Sales Assessment Of Products With Bar Graph Structure PDF
This slide represent graphical presentation of annual sales review of various products sold by an organization within 5 years showing difference in revenue generated .It shows report of following years 2018,2019,2020,and 2021. Showcasing this set of slides titled Yearly Sales Assessment Of Products With Bar Graph Structure PDF. The topics addressed in these templates are Product, Sales Of Product, Product Demand. All the content presented in this PPT design is completely editable. Download it and make adjustments in color, background, font etc. as per your unique business setting.

Car Types Used In Usa Stacked Percentage Graph Sample PDF
This slide shows car use percentage chart in USA to compare vehicle buying decisions. It includes types of cars and car use percentage. Pitch your topic with ease and precision using this Car Types Used In Usa Stacked Percentage Graph Sample PDF. This layout presents information on Limited Space In City, Less Parking Space, Easy To Commute. It is also available for immediate download and adjustment. So, changes can be made in the color, design, graphics or any other component to create a unique layout.

Insurance Policy Usage Stacked Percentage Graph Template PDF
This slide illustrates use of insurance policy types percentage chart in USA to determine total number of insurances taken. It includes cities and insurance policy percentage. Pitch your topic with ease and precision using this Insurance Policy Usage Stacked Percentage Graph Template PDF. This layout presents information on Motor Vehicle Policies, More Population, Migration Of People. It is also available for immediate download and adjustment. So, changes can be made in the color, design, graphics or any other component to create a unique layout.

Business Marketing Organizational Expense Assessment Graph Information PDF
The following slide depicts the comparative analysis of marketing budget allocation for current and previous year to assess variance. It includes promotional activities such as advertising, paid media, agency fee, publicity etc. Showcasing this set of slides titled Business Marketing Organizational Expense Assessment Graph Information PDF. The topics addressed in these templates are Paid Media, Advertising, Budget Allocated. All the content presented in this PPT design is completely editable. Download it and make adjustments in color, background, font etc. as per your unique business setting.
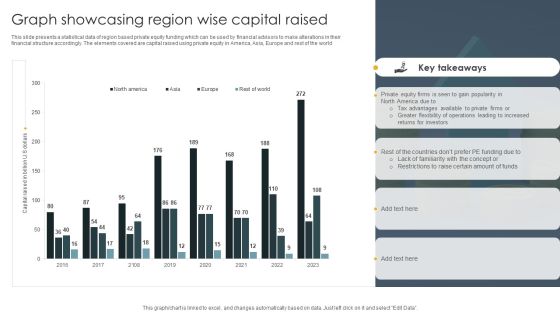
Graph Showcasing Region Wise Capital Raised Demonstration PDF
This slide presents a statistical data of region based private equity funding which can be used by financial advisors to make alterations in their financial structure accordingly. The elements covered are capital raised using private equity in America, Asia, Europe and rest of the world. Showcasing this set of slides titled Graph Showcasing Region Wise Capital Raised Demonstration PDF. The topics addressed in these templates are Investors, Tax Advantages, Private Equity. All the content presented in this PPT design is completely editable. Download it and make adjustments in color, background, font etc. as per your unique business setting.
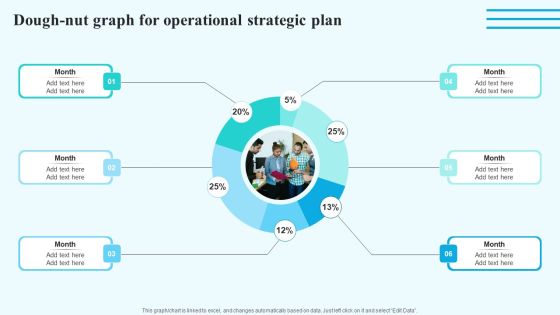
Dough Nut Graph For Operational Strategic Plan Information PDF
Are you in need of a template that can accommodate all of your creative concepts This one is crafted professionally and can be altered to fit any style. Use it with Google Slides or PowerPoint. Include striking photographs, symbols, depictions, and other visuals. Fill, move around, or remove text boxes as desired. Test out color palettes and font mixtures. Edit and save your work, or work with colleagues. Download Dough Nut Graph For Operational Strategic Plan Information PDF and observe how to make your presentation outstanding. Give an impeccable presentation to your group and make your presentation unforgettable.
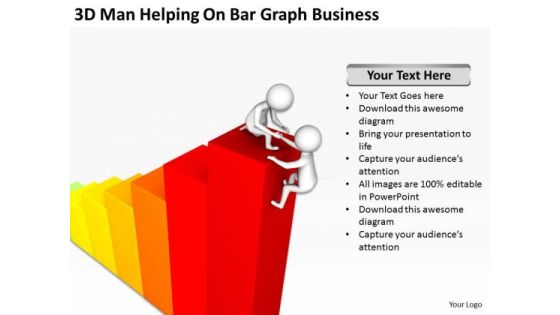
Famous Business People On Bar Graph New PowerPoint Presentation Templates
We present our famous business people on bar graph new powerpoint presentation templates.Present our Business PowerPoint Templates because you should once Tap the ingenuity of our PowerPoint Templates and Slides. They are programmed to succeed. Present our Teamwork PowerPoint Templates because Our PowerPoint Templates and Slides will fulfill your every need. Use them and effectively satisfy the desires of your audience. Use our Success PowerPoint Templates because It will Give impetus to the hopes of your colleagues. Our PowerPoint Templates and Slides will aid you in winning their trust. Use our Flow Charts PowerPoint Templates because Our PowerPoint Templates and Slides are Clear and concise. Use them and dispel any doubts your team may have. Download our Shapes PowerPoint Templates because Our PowerPoint Templates and Slides will fulfill your every need. Use them and effectively satisfy the desires of your audience.Use these PowerPoint slides for presentations relating to 3d, abstract, achievement, bar, business, cartoon, character, chart, climb,communication, concept, goal, graph, hand, help, hold, human,humanoid, icon, idea, idiom, illustration,isolated, measure, mentor, metaphor,over, partner, partnership, person,presentation, profit, prospectus, puppet,render, report, stair, success, team,teamwork, together. The prominent colors used in the PowerPoint template are Red, White, Yellow. Professionals tell us our famous business people on bar graph new powerpoint presentation templates will save the presenter time. People tell us our achievement PowerPoint templates and PPT Slides are designed by professionals We assure you our famous business people on bar graph new powerpoint presentation templates will get their audience's attention. Presenters tell us our climb PowerPoint templates and PPT Slides will help them to explain complicated concepts. We assure you our famous business people on bar graph new powerpoint presentation templates will make the presenter successul in his career/life. PowerPoint presentation experts tell us our bar PowerPoint templates and PPT Slides are incredible easy to use.
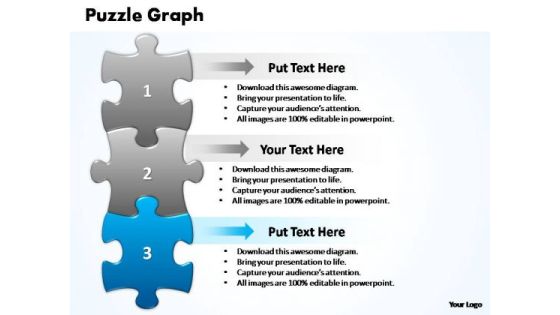
PowerPoint Designs Download Business Puzzle Graph Ppt Presentation
PowerPoint Designs Download Business Puzzle Graph PPT Presentation-This PowerPoint slide shows 3 puzzles diagram. There is a lot of space available for writing your text. You can easily edit the size, position, text, color. \n\n-PowerPoint Designs Download Business Puzzle Graph PPT Presentation

PowerPoint Presentation Leadership Business Puzzle Graph Ppt Designs
PowerPoint Presentation Leadership Business Puzzle Graph PPT Designs-This PowerPoint slide shows 3 puzzles diagram. There is a lot of space available for writing your text. You can easily edit the size, position, text, color. \n\n-PowerPoint Presentation Leadership Business Puzzle Graph PPT Designs
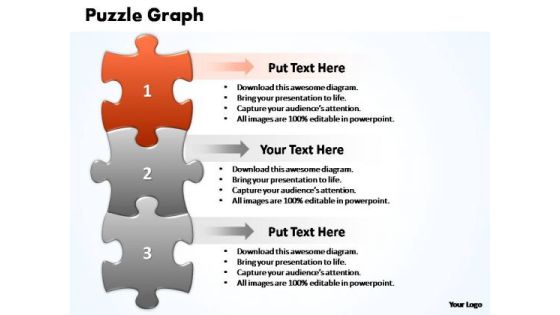
PowerPoint Slide Editable Business Puzzle Graph Ppt Themes
PowerPoint Slide Editable Business Puzzle Graph PPT Themes-This PowerPoint slide shows 3 puzzles diagram. There is a lot of space available for writing your text. You can easily edit the size, position, text, color. \n\n-PowerPoint Slide Editable Business Puzzle Graph PPT Themes

Marketing Diagram Cycle Chain Graph Business Cycle Diagram
Get the doers into action. Activate them with our Marketing Diagram Cycle Chain Graph Business Cycle Diagram Powerpoint Templates. Put your money on our Marketing Diagram Cycle Chain Graph Business Cycle Diagram Powerpoint Templates. Your ideas will rake in the dollars.
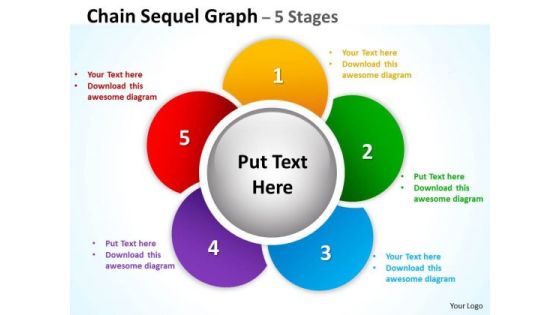
Business Framework Model Chain Sequel Graph Diagrams Consulting Diagram
Our Business Framework Model Chain Sequel Graph diagrams Consulting diagram Powerpoint Templates team are a dogged lot. They keep at it till they get it right. Dole it out with our Business Framework Model Chain Sequel Graph diagrams Consulting diagram Powerpoint Templates. Your thoughts will get the right proportions.
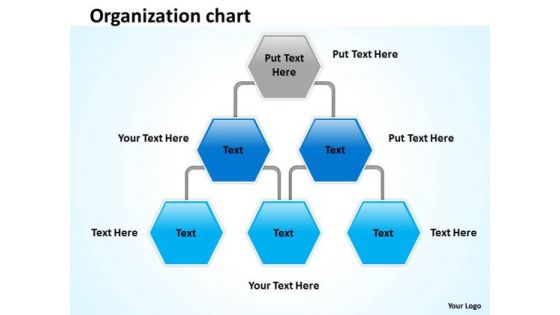
Marketing Diagram Organization Graph Mba Models And Frameworks
Our marketing diagram Organization graph MBA models and frameworks Powerpoint Templates Enjoy Drama. They Provide Entertaining Backdrops. Our marketing diagram Organization graph MBA models and frameworks Powerpoint Templates Help To Make A Draft. They Give You A Good Place To Start.

Consulting Diagram Annual Financial Growth Graph Strategic Management
Analyze Ailments On Our Consulting Diagram Annual Financial Growth Graph Strategic Management Powerpoint Templates. Bring Out The Thinking Doctor In You. Dock Your Thoughts With Our Consulting Diagram Annual Financial Growth Graph Strategic Management Powerpoint Templates. They Will Launch Them Into Orbit.

Stock Photo Bar Graph With Grid PowerPoint Slide
This image slide displays bar graph with grid. This image has been designed with graphic of 3d multicolor bar graph. Use this image slide, in your presentations to express views on finance, growth and success. This image slide may also be used to exhibit any information which requires visual presentation in your presentations. This image slide will enhance the quality of your presentations.

Stock Photo Marketing Graph And Folder PowerPoint Slide
Define your ideas in a unique and inspiring manner using this image which contains a graphic of colorful bar graph. This pre-designed and appealing bar graph offers an optimized possibility to illustrate your marketing strategy. Use this Image in presentations relating to business and sales.
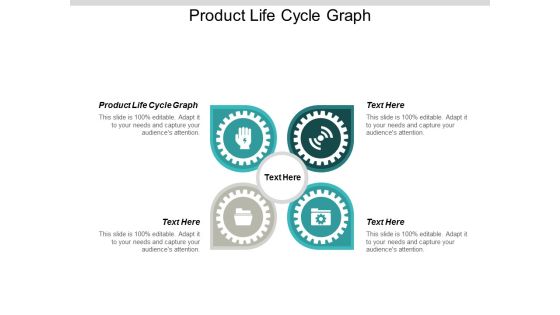
Product Life Cycle Graph Ppt PowerPoint Presentation Pictures Elements Cpb
Presenting this set of slides with name product life cycle graph ppt powerpoint presentation pictures elements cpb. This is a four stage process. The stages in this process are product life cycle graph. This is a completely editable PowerPoint presentation and is available for immediate download. Download now and impress your audience.

Decrease Graph Vector Icon Ppt PowerPoint Presentation Infographic Template Shapes
Presenting this set of slides with name decrease graph vector icon ppt powerpoint presentation infographic template shapes. This is a four stage process. The stages in this process are loss, decrease graph, stock market. This is a completely editable PowerPoint presentation and is available for immediate download. Download now and impress your audience.
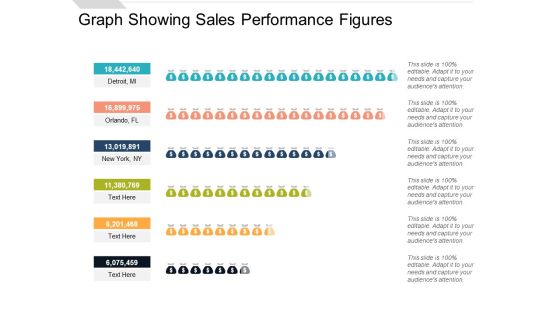
Graph Showing Sales Performance Figures Ppt PowerPoint Presentation Infographics Topics
Presenting this set of slides with name graph showing sales performance figures ppt powerpoint presentation infographics topics. This is a six stage process. The stages in this process are people graph, sales performance, population data demographics. This is a completely editable PowerPoint presentation and is available for immediate download. Download now and impress your audience.

Graph Showing Worldwide Internet Usage Ppt PowerPoint Presentation Inspiration Backgrounds
Presenting this set of slides with name graph showing worldwide internet usage ppt powerpoint presentation inspiration backgrounds. The topics discussed in these slide is graph showing worldwide internet usage. This is a completely editable PowerPoint presentation and is available for immediate download. Download now and impress your audience.

Analytics Graph Business Growth Vector Icon Ppt PowerPoint Presentation Introduction
Presenting this set of slides with name analytics graph business growth vector icon ppt powerpoint presentation introduction. This is a three stage process. The stages in this process are analytics graph business growth vector icon. This is a completely editable PowerPoint presentation and is available for immediate download. Download now and impress your audience.
Financial Growth Graph Vector Icon Ppt PowerPoint Presentation Summary Shapes
Presenting this set of slides with name financial growth graph vector icon ppt powerpoint presentation summary shapes. This is a three stage process. The stages in this process are financial growth graph vector icon. This is a completely editable PowerPoint presentation and is available for immediate download. Download now and impress your audience.
Supply Demand Graph Examples Ppt PowerPoint Presentation Portfolio Slides Cpb
Presenting this set of slides with name supply demand graph examples ppt powerpoint presentation portfolio slides cpb. This is a five stage process. The stages in this process are supply demand graph examples. This is a completely editable PowerPoint presentation and is available for immediate download. Download now and impress your audience.
Pie Graph On Screen Vector Icon Ppt PowerPoint Presentation Pictures
Presenting this set of slides with name pie graph on screen vector icon ppt powerpoint presentation pictures. The topics discussed in these slides are pie graph on screen vector icon. This is a completely editable PowerPoint presentation and is available for immediate download. Download now and impress your audience.

Business Graph With Up Arrow Ppt PowerPoint Presentation Gallery Information
Presenting this set of slides with name business graph with up arrow ppt powerpoint presentation gallery information. This is a three stage process. The stages in this process are business graph with up arrow. This is a completely editable PowerPoint presentation and is available for immediate download. Download now and impress your audience.
Growing Business Graph Vector Icon Ppt PowerPoint Presentation Styles Gallery
Presenting this set of slides with name growing business graph vector icon ppt powerpoint presentation styles gallery. This is a three stage process. The stages in this process are growing business graph vector icon. This is a completely editable PowerPoint presentation and is available for immediate download. Download now and impress your audience.
Growth Trend Graph Vector Icon Ppt PowerPoint Presentation Gallery Sample
Presenting this set of slides with name growth trend graph vector icon ppt powerpoint presentation gallery sample. This is a three stage process. The stages in this process are growth trend graph vector icon. This is a completely editable PowerPoint presentation and is available for immediate download. Download now and impress your audience.
Profit Growth Graph Vector Icon Ppt PowerPoint Presentation Gallery Icon
Presenting this set of slides with name profit growth graph vector icon ppt powerpoint presentation gallery icon. This is a three stage process. The stages in this process are profit growth graph vector icon. This is a completely editable PowerPoint presentation and is available for immediate download. Download now and impress your audience.
Graph Icon Showing Economic Results Ppt PowerPoint Presentation Ideas Diagrams
Presenting this set of slides with name graph icon showing economic results ppt powerpoint presentation ideas diagrams. This is a three stage process. The stages in this process are graph icon showing economic results. This is a completely editable PowerPoint presentation and is available for immediate download. Download now and impress your audience.
Population Growth Graph Vector Icon Ppt PowerPoint Presentation Professional Themes
Presenting this set of slides with name population growth graph vector icon ppt powerpoint presentation professional themes. This is a three stage process. The stages in this process are population growth, graph vector icon. This is a completely editable PowerPoint presentation and is available for immediate download. Download now and impress your audience.
Monetary Growth Graph Vector Icon Ppt PowerPoint Presentation Inspiration Outline
Presenting this set of slides with name monetary growth graph vector icon ppt powerpoint presentation inspiration outline. This is a three stage process. The stages in this process are monetary growth graph vector icon. This is a completely editable PowerPoint presentation and is available for immediate download. Download now and impress your audience.

Curved Graph Vector Icon Ppt PowerPoint Presentation Slides Themes PDF
Presenting this set of slides with name curved graph vector icon ppt powerpoint presentation slides themes pdf. This is a one stage process. The stage in this process is curved graph vector icon. This is a completely editable PowerPoint presentation and is available for immediate download. Download now and impress your audience.

Stakeholder Assessment Analysis Graph With Power And Interest Formats PDF
Deliver an awe-inspiring pitch with this creative stakeholder assessment analysis graph with power and interest formats pdf bundle. Topics like stakeholder assessment analysis graph with power and interest can be discussed with this completely editable template. It is available for immediate download depending on the needs and requirements of the user.

4 Weather Graph Diagram Ppt PowerPoint Presentation Gallery Inspiration PDF
Persuade your audience using this 4 weather graph diagram ppt powerpoint presentation gallery inspiration pdf. This PPT design covers four stages, thus making it a great tool to use. It also caters to a variety of topics including 4 weather graph diagram. Download this PPT design now to present a convincing pitch that not only emphasizes the topic but also showcases your presentation skills.
Employees Evaluation Result Icon With Bar Graph Professional PDF
Showcasing this set of slides titled employees evaluation result icon with bar graph professional pdf. The topics addressed in these templates are employees evaluation result icon with bar graph. All the content presented in this PPT design is completely editable. Download it and make adjustments in color, background, font etc. as per your unique business setting.
Staff Performance Evaluation Icon With Rising Graph Summary PDF
Presenting staff performance evaluation icon with rising graph summary pdf to dispense important information. This template comprises three stages. It also presents valuable insights into the topics including staff performance evaluation icon with rising graph. This is a completely customizable PowerPoint theme that can be put to use immediately. So, download it and address the topic impactfully.
Statistical Data Graph Icon Showing Financial Forecast Rules PDF
Presenting statistical data graph icon showing financial forecast rules pdf to dispense important information. This template comprises four stages. It also presents valuable insights into the topics including statistical data graph icon showing financial forecast. This is a completely customizable PowerPoint theme that can be put to use immediately. So, download it and address the topic impactfully.
Digital Transformation Icon With Bar Graph Mockup PDF
Presenting digital transformation icon with bar graph mockup pdf to provide visual cues and insights. Share and navigate important information on three stages that need your due attention. This template can be used to pitch topics like digital transformation icon with bar graph. In addtion, this PPT design contains high resolution images, graphics, etc, that are easily editable and available for immediate download.
Project Team Efficiency Status Graph Icon Diagrams PDF
Persuade your audience using this Project Team Efficiency Status Graph Icon Diagrams PDF. This PPT design covers three stages, thus making it a great tool to use. It also caters to a variety of topics including Project Team Efficiency Status Graph Icon. Download this PPT design now to present a convincing pitch that not only emphasizes the topic but also showcases your presentation skills.
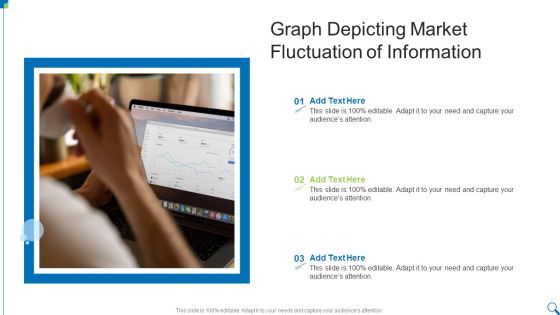
Graph Depicting Market Fluctuation Of Information Guidelines PDF
Presenting Graph Depicting Market Fluctuation Of Information Guidelines PDF to dispense important information. This template comprises three stages. It also presents valuable insights into the topics including Graph Depicting, Market Fluctuation, Information This is a completely customizable PowerPoint theme that can be put to use immediately. So, download it and address the topic impactfully.
Icon Of BCWP Graph For Project Management Topics PDF
Persuade your audience using this Icon Of BCWP Graph For Project Management Topics PDF This PPT design covers one stage, thus making it a great tool to use. It also caters to a variety of topics including Icon BCWP, Graph Project, Management Download this PPT design now to present a convincing pitch that not only emphasizes the topic but also showcases your presentation skills.

Business Plan Sprint Review Icon With Graph Themes PDF
Presenting Business Plan Sprint Review Icon With Graph Themes PDF to dispense important information. This template comprises four stages. It also presents valuable insights into the topics including Review Icon With Graph, Business Plan Sprint. This is a completely customizable PowerPoint theme that can be put to use immediately. So, download it and address the topic impactfully.

Diminishing Graph And Chart Icon With Arrow Sign Clipart PDF
Presenting Diminishing Graph And Chart Icon With Arrow Sign Clipart PDF to dispense important information. This template comprises four stages. It also presents valuable insights into the topics including Diminishing Graph, Chart Icon With Arrow Sign. This is a completely customizable PowerPoint theme that can be put to use immediately. So, download it and address the topic impactfully.

Icon Depicting Energy Consumption Statistics Bar Graph Sample PDF
Presenting Icon Depicting Energy Consumption Statistics Bar Graph Sample PDF to dispense important information. This template comprises three stages. It also presents valuable insights into the topics including Icon Depicting, Energy Consumption Statistics, Bar Graph. This is a completely customizable PowerPoint theme that can be put to use immediately. So, download it and address the topic impactfully.

Doughnut Graph Icon Highlighting IT Team Structure Structure PDF
Presenting Doughnut Graph Icon Highlighting IT Team Structure Structure PDF to dispense important information. This template comprises four stages. It also presents valuable insights into the topics including Doughnut Graph, Icon Highlighting, IT Team Structure. This is a completely customizable PowerPoint theme that can be put to use immediately. So, download it and address the topic impactfully.

Doughnut Graph Icon With Dollar Symbol Topics PDF
Persuade your audience using this Doughnut Graph Icon With Dollar Symbol Topics PDF. This PPT design covers four stages, thus making it a great tool to use. It also caters to a variety of topics including Doughnut Graph, Icon, Dollar Symbol. Download this PPT design now to present a convincing pitch that not only emphasizes the topic but also showcases your presentation skills.

Promotion Guildines Graph Representing Growth Icon Template PDF
Persuade your audience using this Promotion Guildines Graph Representing Growth Icon Template PDF. This PPT design covers three stages, thus making it a great tool to use. It also caters to a variety of topics including Promotion Guildines, Graph Representing, Growth Icon. Download this PPT design now to present a convincing pitch that not only emphasizes the topic but also showcases your presentation skills.

Five Year Sales Projection Graph Icon Graphics PDF
Persuade your audience using this Five Year Sales Projection Graph Icon Graphics PDF. This PPT design covers three stages, thus making it a great tool to use. It also caters to a variety of topics including Five Year Sales, Projection Graph Icon. Download this PPT design now to present a convincing pitch that not only emphasizes the topic but also showcases your presentation skills.
Graph Comparison Icon For Liquidity Financial Ratios Analysis Summary PDF
Presenting Graph Comparison Icon For Liquidity Financial Ratios Analysis Summary PDF to dispense important information. This template comprises Three stages. It also presents valuable insights into the topics including Graph Comparison, Icon For Liquidity, Financial Ratios Analysis. This is a completely customizable PowerPoint theme that can be put to use immediately. So, download it and address the topic impactfully.
Financial Yearly Forecast Icon With Graph And Checklist Summary PDF
Presenting Financial Yearly Forecast Icon With Graph And Checklist Summary PDF to dispense important information. This template comprises Three stages. It also presents valuable insights into the topics including Financial Yearly Forecast, Graph And Checklist . This is a completely customizable PowerPoint theme that can be put to use immediately. So, download it and address the topic impactfully.
ITIL Demand Management Growth Graph Icon Rules PDF
Presenting ITIL Demand Management Growth Graph Icon Rules PDF to dispense important information. This template comprises three stages. It also presents valuable insights into the topics including Itil Demand Management, Growth Graph Icon. This is a completely customizable PowerPoint theme that can be put to use immediately. So, download it and address the topic impactfully.
Gross Revenue Margin Comparison Graph Icon Clipart PDF
Persuade your audience using this Gross Revenue Margin Comparison Graph Icon Clipart PDF. This PPT design covers three stages, thus making it a great tool to use. It also caters to a variety of topics including Gross Revenue Margin, Comparison Graph Icon. Download this PPT design now to present a convincing pitch that not only emphasizes the topic but also showcases your presentation skills.

Breakdown By Area In Pie Chart And Graph Introduction PDF
Showcasing this set of slides titled Breakdown By Area In Pie Chart And Graph Introduction PDF. The topics addressed in these templates are Break Down, Area Pie, Chart Graph. All the content presented in this PPT design is completely editable. Download it and make adjustments in color, background, font etc. as per your unique business setting.

Cloud System Checking Monitoring With Graph Icon Mockup PDF
Presenting Cloud System Checking Monitoring With Graph Icon Mockup PDF to dispense important information. This template comprises three stages. It also presents valuable insights into the topics including Cloud System Checking, Monitoring With Graph Icon. This is a completely customizable PowerPoint theme that can be put to use immediately. So, download it and address the topic impactfully.
Industry Decline And Recession Graph Icon Ideas PDF
Presenting Industry Decline And Recession Graph Icon Ideas PDF to dispense important information. This template comprises three stages. It also presents valuable insights into the topics including Industry Decline, Recession Graph Icon. This is a completely customizable PowerPoint theme that can be put to use immediately. So, download it and address the topic impactfully.
Managers Self Advancement Plan Icon With Graph Guidelines PDF
Presenting Managers Self Advancement Plan Icon With Graph Guidelines PDF to dispense important information. This template comprises four stages. It also presents valuable insights into the topics including Managers Self Advancement, Plan Icon With Graph. This is a completely customizable PowerPoint theme that can be put to use immediately. So, download it and address the topic impactfully.

Harvey Ball Graph Ppt PowerPoint Presentation Complete Deck With Slides
If designing a presentation takes a lot of your time and resources and you are looking for a better alternative, then this Harvey Ball Graph Ppt PowerPoint Presentation Complete Deck With Slides is the right fit for you. This is a prefabricated set that can help you deliver a great presentation on the topic. All the Twelve slides included in this sample template can be used to present a birds eye view of the topic. These slides are also fully editable, giving you enough freedom to add specific details to make this layout more suited to your business setting. Apart from the content, all other elements like color, design, theme are also replaceable and editable. This helps in designing a variety of presentations with a single layout. Not only this, you can use this PPT design in formats like PDF, PNG, and JPG once downloaded. Therefore, without any further ado, download and utilize this sample presentation as per your liking.
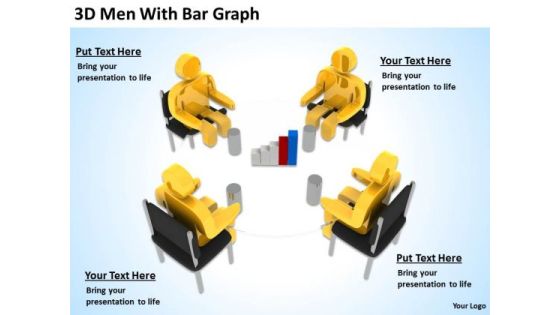
Business People Vector 3d Men With Bar Graph PowerPoint Slides
We present our business people vector 3d men with bar graph PowerPoint Slides.Use our People PowerPoint Templates because Our PowerPoint Templates and Slides are a sure bet. Gauranteed to win against all odds. Download and present our Business PowerPoint Templates because Our PowerPoint Templates and Slides will bullet point your ideas. See them fall into place one by one. Download and present our Flow Charts PowerPoint Templates because Our PowerPoint Templates and Slides are created by a hardworking bunch of busybees. Always flitting around with solutions gauranteed to please. Download our Marketing PowerPoint Templates because It can Bubble and burst with your ideas. Use our Shapes PowerPoint Templates because Our PowerPoint Templates and Slides will let you Leave a lasting impression to your audiences. They possess an inherent longstanding recall factor.Use these PowerPoint slides for presentations relating to 3d, accounting, analysis, bar, business, cartoon,cash, character, chart, clipart, committee, company, concept, corporate,council, directors, display, document, economics, executive, figure, finance,financial, goal, graph, group, growth, guy, human, humanoid, man, management,market, meeting, money, office, percentage, performance, pie, presentation, report,room, statistics, table, team. The prominent colors used in the PowerPoint template are Yellow, Black, Gray. Professionals tell us our business people vector 3d men with bar graph PowerPoint Slides have awesome images to get your point across. Professionals tell us our analysis PowerPoint templates and PPT Slides will help you be quick off the draw. Just enter your specific text and see your points hit home. People tell us our business people vector 3d men with bar graph PowerPoint Slides effectively help you save your valuable time. Customers tell us our bar PowerPoint templates and PPT Slides are effectively colour coded to prioritise your plans They automatically highlight the sequence of events you desire. The feedback we get is that our business people vector 3d men with bar graph PowerPoint Slides will generate and maintain the level of interest you desire. They will create the impression you want to imprint on your audience. Use our business PowerPoint templates and PPT Slides have awesome images to get your point across.

Money Graph Business PowerPoint Templates And PowerPoint Themes 1012
Money Graph Business PowerPoint Templates And PowerPoint Themes 1012-Visually support your Microsoft office PPT Presentation with our above template illustrating rising money chart. This image has been professionally designed to emphasize the business success concept. Our unique image makes your presentations professional showing that you care about even the smallest details. The structure of our templates allows you to effectively highlight the key issues concerning the growth of your business.-Money Graph Business PowerPoint Templates And PowerPoint Themes 1012-This PowerPoint template can be used for presentations relating to-Money graph, business, success, finance, money, marketing
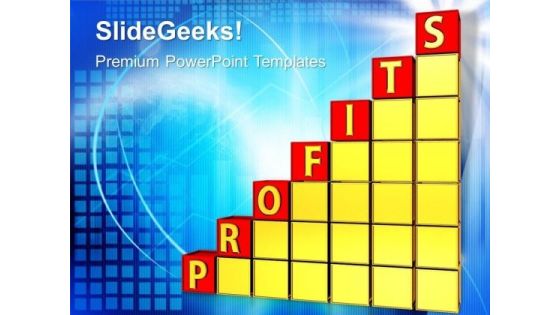
Business Profit Graph PowerPoint Templates And PowerPoint Themes 1012
Business Profit Graph PowerPoint Templates And PowerPoint Themes 1012-Create stunning Microsoft office PPT Presentations with our professional templates containing a graphic of success chart. This PowerPoint template shows the increasing graph with each letter of Success on each step. This template portrays the concepts of winning, leadership, finance, success, competition, sports, business, shapes, people and abstract. Present your views using our innovative slides and be assured of leaving a lasting impression.-Business Profit Graph PowerPoint Templates And PowerPoint Themes 1012-This PowerPoint template can be used for presentations relating to-Success profit chart graphic, business, finance, success, money, marketing
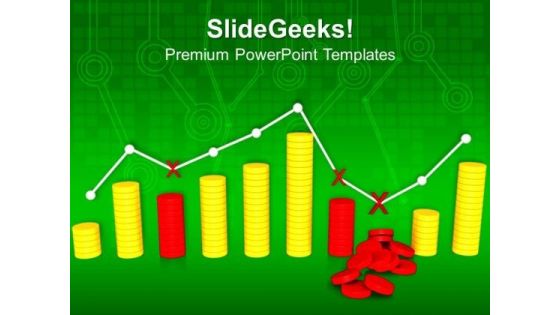
Graph With Business Fluctuations PowerPoint Templates And PowerPoint Themes 1012
Graph With Business Fluctuations PowerPoint Templates And PowerPoint Themes 1012-Emphatically define your message with our above template which contains a graphic of stack of coins with business graph showing fluctuations. This image represents the concept of business failure and success. Use this template for Business and Marketing purposes. The structure of our templates allows you to effectively highlight the key issues concerning the growth of your business.-Graph With Business Fluctuations PowerPoint Templates And PowerPoint Themes 1012-This PowerPoint template can be used for presentations relating to-Graph with fluctuations, business, finance, success, marketing, leadership

Percentage Graph Progress Business PowerPoint Templates And PowerPoint Themes 1012
Percentage Graph Progress Business PowerPoint Templates And PowerPoint Themes 1012-Using This Beautiful PowerPoint Template you will be able to illustrate the Growth, Progress, development, advancement, improvement, evolution, headway, steps forward, movement, evolvement etc. Our template will help pinpoint their viability. Refine them all as you take them through the numerous filtering stages of the funnel of your quality control process.-Percentage Graph Progress Business PowerPoint Templates And PowerPoint Themes 1012-This PowerPoint template can be used for presentations relating to-Graph Percent Going Up, Success, Business, Finance, Marketing, Money

Success Graph Finance PowerPoint Templates And PowerPoint Themes 1012
Success Graph Finance PowerPoint Templates And PowerPoint Themes 1012-The Above PowerPoint Template shows the Bar graph of Several Components showing the Percentage of each component. It signifies the Concept of Growth, Finance, Investment etc. Prove how they mesh to motivate the company team and provide the steam to activate the composite machine. You have noted down some very fruitful ideas that have occurred to you at random moments. Organize them all and prioritize them effectively.-Success Graph Finance PowerPoint Templates And PowerPoint Themes 1012-This PowerPoint template can be used for presentations relating to-Business growth, Business, Finance, Marketing, Success, Symbol

Bar Graph Finance PowerPoint Templates And PowerPoint Themes 0512
Microsoft Powerpoint Templates and Background with bar chart growth-Bar Graph Finance PowerPoint Templates And PowerPoint Themes 0512-These PowerPoint designs and slide layouts can be used for themes relating to -Bar chart growth, abstract, business, finance, success, marketing
Bar Graph Global PowerPoint Templates And PowerPoint Themes 0512
Microsoft Powerpoint Templates and Background with success-Bar Graph Global PowerPoint Templates And PowerPoint Themes 0512-These PowerPoint designs and slide layouts can be used for themes relating to -Success, business, shapes, marketing, sales, finance, globe

Bar Graph Winner Success PowerPoint Templates And PowerPoint Themes 0512
Microsoft Powerpoint Templates and Background with winner-Bar Graph Winner Success PowerPoint Templates And PowerPoint Themes 0512-These PowerPoint designs and slide layouts can be used for themes relating to -Winner, background, success, business, finance, shapes

Colored Bar Graph Success PowerPoint Templates And PowerPoint Themes 0512
Microsoft Powerpoint Templates and Background with success-Colored Bar Graph Success PowerPoint Templates And PowerPoint Themes 0512-These PowerPoint designs and slide layouts can be used for themes relating to -Success, business, shapes, marketing, sales, finance
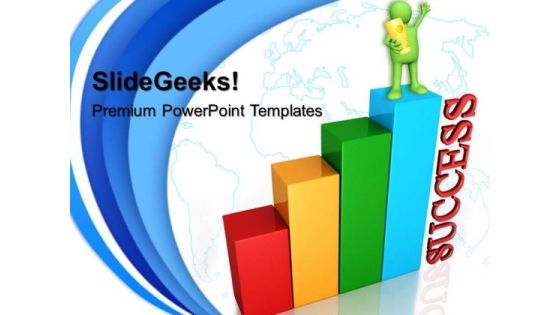
Global Graph Success PowerPoint Templates And PowerPoint Themes 0512
Microsoft Powerpoint Templates and Background with success-Global Graph Success PowerPoint Templates And PowerPoint Themes 0512-These PowerPoint designs and slide layouts can be used for themes relating to -Success, business, shapes, marketing, sales, finance, shapes
Marketing Graph Success PowerPoint Templates And PowerPoint Themes 0512
Microsoft Powerpoint Templates and Background with bar chart growth-Marketing Graph Success PowerPoint Templates And PowerPoint Themes 0512-These PowerPoint designs and slide layouts can be used for themes relating to -Bar chart growth, abstract, business, finance, success, marketing

Success Bar Graph Finance PowerPoint Templates And PowerPoint Themes 0512
Microsoft Powerpoint Templates and Background with success-Success Bar Graph Finance PowerPoint Templates And PowerPoint Themes 0512-These PowerPoint designs and slide layouts can be used for themes relating to -Success, business, shapes, marketing, sales, finance

Success Graph Business PowerPoint Templates And PowerPoint Themes 0512
Microsoft Powerpoint Templates and Background with success-Success Graph Business PowerPoint Templates And PowerPoint Themes 0512-These PowerPoint designs and slide layouts can be used for themes relating to -Success, business, shapes, marketing, handshake, finance

Percentage Graph Finance PowerPoint Templates And PowerPoint Themes 0512
Microsoft Powerpoint Templates and Background with growing percents-These templates can be used for presentations relating to-Growing percent sales, business, finance, marketing, money, success-Percentage Graph Finance PowerPoint Templates And PowerPoint Themes 0512
Profit Graph Business PowerPoint Templates And PowerPoint Themes 0912
Profit Graph Business PowerPoint Templates And PowerPoint Themes 0912-Microsoft Powerpoint Templates and Background with arrows pointing up business and financial growth concept-Arrows pointing up business and financial growth concept, business, arrows, success, finance, targets
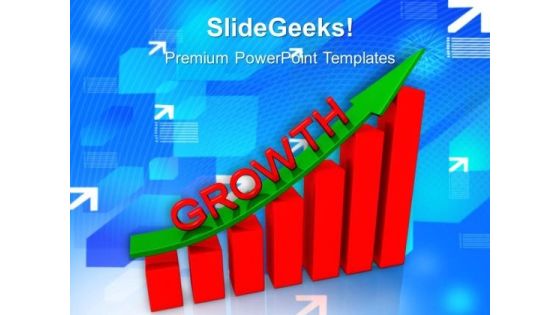
Finance Growth Graph PowerPoint Templates And PowerPoint Themes 1012
Finance Growth Graph PowerPoint Templates And PowerPoint Themes 1012-Aesthetically designed to make a great first impression this template highlights the Financial Growth. This PowerPoint Template shows a red bar graph with green growth arrow. The Template signifies the concept of Team Work, Team Leader etc. This image has been conceived to enable you to emphatically communicate your ideas in your Business and Marketing PPT presentations. Use this template for business development, financial analysis and market reviews. Our PPT images are so ideally designed that it reveals the very basis of our PPT template are an effective tool to make your clients understand.-Finance Growth Graph PowerPoint Templates And PowerPoint Themes 1012-This PowerPoint template can be used for presentations relating to-Business growth and success graph, finance, business, success, competition, arrows
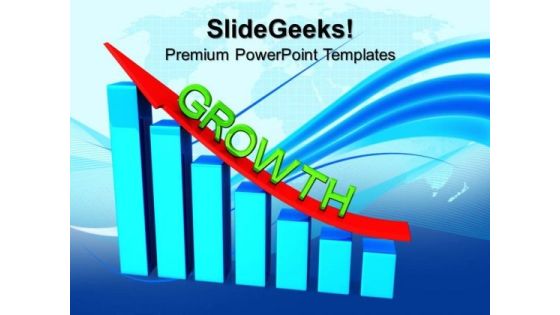
Growth Bar Graph Business PowerPoint Templates And PowerPoint Themes 1012
Growth Bar Graph Business PowerPoint Templates And PowerPoint Themes 1012-Aesthetically designed to make a great first impression this template highlights the Financial Growth. This PowerPoint Template shows a blue bar graph with red growth arrow. This Template signifies the concept of Team Work. This image has been conceived to enable you to emphatically communicate your ideas in your Business and Marketing PPT presentations. Use this template for business development, financial analysis and market reviews. Our PPT images are so ideally designed that it reveals the very basis of our PPT template are an effective tool to make your clients understand.-Growth Bar Graph Business PowerPoint Templates And PowerPoint Themes 1012-This PowerPoint template can be used for presentations relating to-Business growth and success graph, finance, business, success, competition, arrows
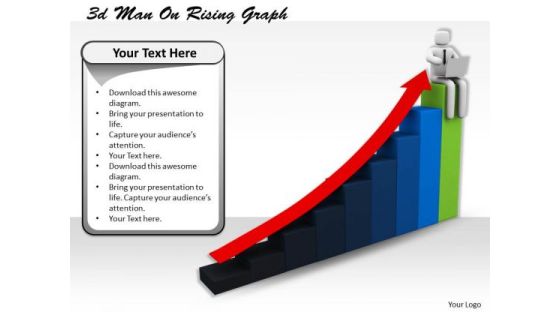
Business Development Strategy Template 3d Man On Rising Graph Characters
Establish The Dominance Of Your Ideas. Our Business Development Strategy Template 3d Man On Rising Graph Characters Powerpoint Templates Will Put Them On Top. Put Yourself In A Dominant Position. Our Arrows Powerpoint Templates Will Confirm Your Superiority.

Stock Photo Image Of Business Bar Graph PowerPoint Template
Plan Your Storyboard With Our stock photo Image Of Business Bar Graph powerpoint template Powerpoint Templates. Give An Outline To The Solutions You Have. Give Power To Your Elbow With Our finance Powerpoint Templates. Get That Extra Information You Need.
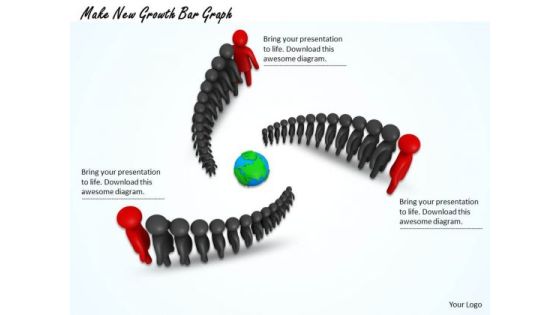
Stock Photo Make New Growth Bar Graph PowerPoint Template
Your Listeners Will Never Doodle. Our Stock Photo Make New Growth Bar Graph Powerpoint Template Powerpoint Templates Will Hold Their Concentration. Do The One Thing With Your Thoughts. Uphold Custom With Our Business Powerpoint Templates.

Stock Photo Bar Graph Of International Currency PowerPoint Template
Plan For All Contingencies With Our stock photo bar graph of international currency powerpoint template Powerpoint Templates. Douse The Fire Before It Catches. Generate Camaraderie With Our Globe Powerpoint Templates. Good Wishes Will Come Raining Down.

Business Strategy Concepts 3d Man Sitting Graph Statement
Touch Base With Our business strategy concepts 3d man sitting graph statement Powerpoint Templates. Review Your Growth With Your Audience. Take A Deep Dive With Our Finance Powerpoint Templates. Get Into The Nitti Gritty Of It All.
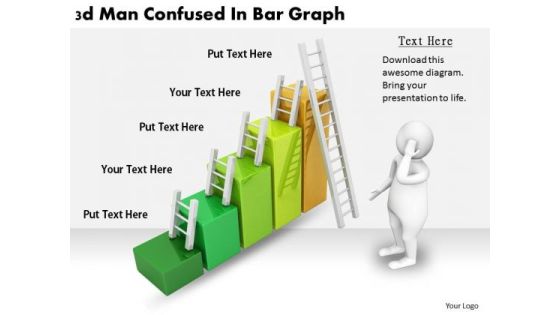
Business Strategy Formulation 3d Man Confused Bar Graph Character Modeling
Draw On The Experience Of Our business strategy formulation 3d man confused bar graph character modeling Powerpoint Templates. They Imbibe From Past Masters. Drink The Nectar Of Our Ladders Powerpoint Templates. Give Your Thoughts A Long Life.
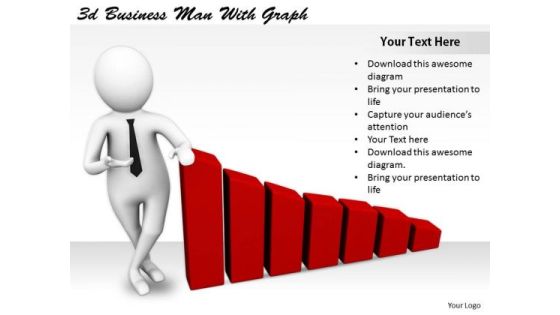
Company Business Strategy 3d Man With Graph Characters
Ace A Drive Into Unknown Territory. Our company business strategy 3d man with graph characters Powerpoint Templates Will Provide The Co Ordinates. Drive Out Of Difficulty With Our Finance Powerpoint Templates. They Will Steer You To Safety.

Creative Marketing Concepts 3d Man With Construction Bar Graph Characters
Our creative marketing concepts 3d man with construction bar graph characters Powerpoint Templates Are Dual Purpose. They Help Instruct And Inform At The Same Time. Collect Accolades With Our Finance Powerpoint Templates. Your Audience Will Dub You The Master.
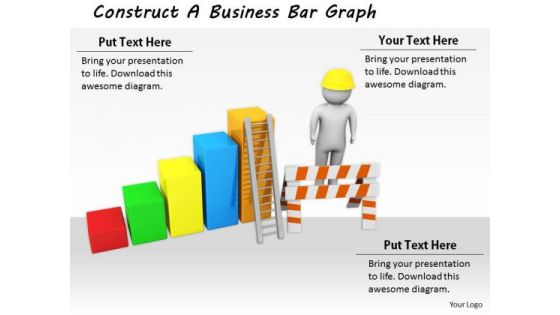
Business Integration Strategy Construct Bar Graph Basic Concepts
Doll Up Your Thoughts With Our Business Integration Strategy Construct Bar Graph Basic Concepts Powerpoint Templates. They Will Make A Pretty Picture. They Say A Dog Is Man's Best Friend. Our Construction Powerpoint Templates Come A Close Second.

Total Marketing Concepts Build Financial Bar Graph Business Statement
Drink To The Success Of Your Campaign. Our Total Marketing Concepts Build Financial Bar Graph Business Statement Powerpoint Templates Will Raise A Toast. Pass It Around On Our People Powerpoint Templates. Your Audience Will Lap It Up.

Business And Strategy 3d Man On Growth Graph Character
Analyze Ailments On Our Business And Strategy 3d Man On Growth Graph Character Powerpoint Templates. Bring Out The Thinking Doctor In You. Dock Your Thoughts With Our People Powerpoint Templates. They Will Launch Them Into Orbit.
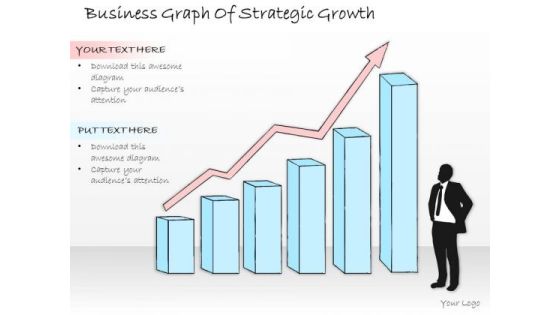
Ppt Slide Business Graph Of Strategic Growth Diagrams
Our PPT Slide Business Graph Of Strategic Growth Diagrams Powerpoint Templates Abhor Doodling. They Never Let The Interest Flag. Our Business Diagrams Powerpoint Templates Make Good Beasts Of Burden. Place All Your Demands On Them.

Ppt Slide Graph Of Product Lifecycle Marketing Plan
Delight Them With Our PPT Slide Graph Of Product Lifecycle Marketing Plan Powerpoint Templates. Your Audience Will Be Ecstatic. Our Sales Plan Powerpoint Templates Are Created Cost Effective. They Understand The Need For Economy.
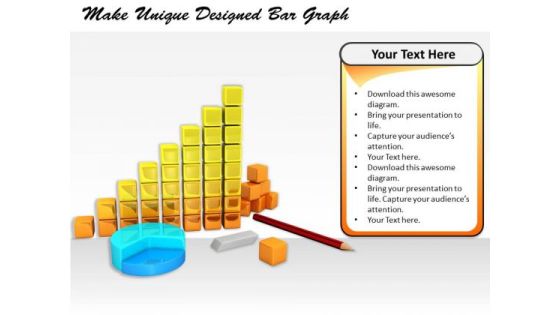
Stock Photo New Business Strategy Make Unique Designed Bar Graph
Add Some Dramatization To Your Thoughts. Our Stock Photo New Business Strategy Make Unique Designed Bar Graph Powerpoint Templates Make Useful Props. Draw Ahead Of Others With Our business Powerpoint Templates. Cross The Line And Win The Race.

Stock Photo Business Graph With Colorful Bars PowerPoint Slide
This image is designed with business graph with colorful bars. Use this image slide in presentations related to business success, strategy planning etc. This template is innovatively designed to highlight your worthy views.
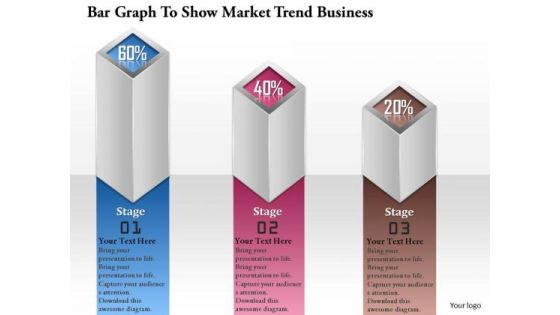
Consulting Slides Bar Graph To Show Market Trend Business Presentation
This bar graph can be very useful in presentations where you need to market trend. This can be used as a visualization tool because the audience can get a better view about what you want to show.
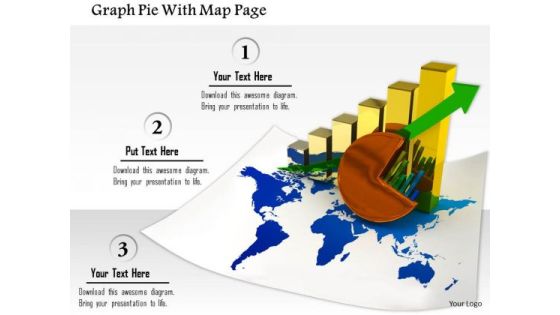
Stock Photo Graph Pie With Map Page PowerPoint Slide
This image slide contains business charts on world map. This image is designed with bar graph and pie chart on world map depicting global economy. Use this image slide to represent financial growth in any business presentation.
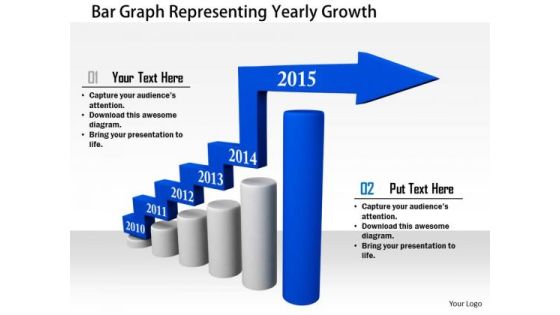
Stock Photo Bar Graph Representing Yearly Growth PowerPoint Slide
This Power Point image template slide has been crafted with graphic of bar graph and arrow. This image slide template contains the concept of yearly growth. Use this image slide and build exclusive presentation for your viewers.

Stock Photo Business Graph Of Two Thousand Fifteen PowerPoint Slide
This Business Power Point image template has been designed with graphic of bar graph of 2015 year text. This image template contains the concept of new year planning. This image slide can be used for business and finance related presentations.
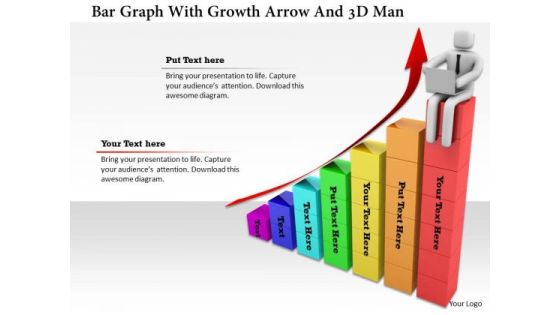
Bar Graph With Growth Arrow And 3d Man
This image slide has been crafted with graphic of bar graph and arrow. In this slide arrow is representing the concept of growth. Use this editable slide to display business growth.
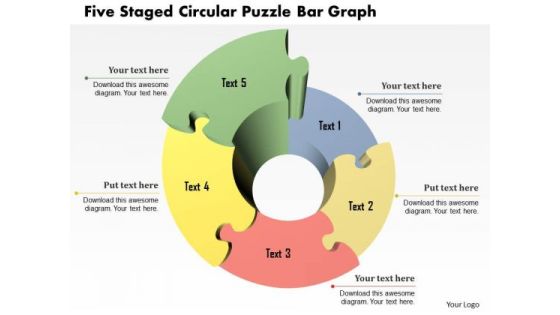
Business Diagram Five Staged Circular Puzzle Bar Graph Presentation Template
Five staged circular puzzle bar graph been used to design this power point template. This PPT contains the concept of business timeline. Show timelines for your business achievements and use this PPT for your business and finance related presentations.

Business Diagram Graph Of Financial Growth Presentation Template
Tree design bar graph has been used to craft this power point template diagram. This PPT contains the concept of financial growth. Use this PPT diagram for finance and business related presentations.

Stock Photo Bar Graph With Growth Arrow PowerPoint Slide
This creative image displays design of Bar Graph with Growth Arrow. This image has been designed to depict business on an Upward Trend. Create an impact with this quality image and make professional presentations.

Business Diagram Creative Graph For Business Reports Presentation Template
Download this diagram to display planning and analysis concepts. This business diagram contains the graphic of creative graph for business reports. Use this template to highlight the key issues of your presentation.

Bank Bar Graph Business Deal Result Analysis Ppt Slides Graphics
This power point icon slide has been designed with four different icons. Icons of bank, bar graph and business deal have been displayed in this slide. Use these icons in your presentations to add professional impact.

Laptop Globe Bar Graph Dollar Coins Ppt Slides Graphics
Icons of laptop, globe and bar graph with dollar coins have been used to design this icon PPT slide. Download these icons to display concepts of technology and financial growth. Use this slide to build an exclusive presentation.
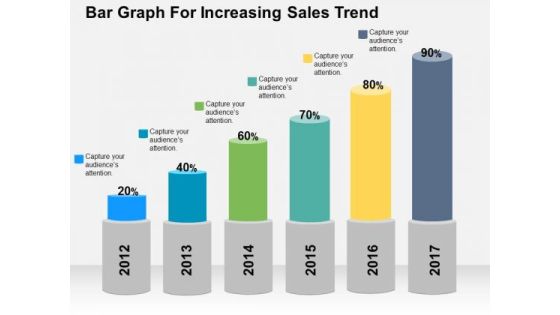
Bar Graph For Increasing Sales Trend PowerPoint Template
Deliver amazing presentations with our above template showing bar graph with percentage values. You may download this slide to depict increase in sales trends. Capture the attention of your audience using this diagram.

Man On Bar Graph With Ladders For Success Powerpoint Template
This business slide has been designed with graphics of man on bar graph with ladder. You may download this diagram to display concepts like strategy, management and success. Download this diagram slide to make impressive presentations.

Dollar Coins Money Growth Bar Graph Powerpoint Template
Use this PowerPoint template, in your corporate presentations. It contains bar graph of dollar coins. This business slide may be used to exhibit money growth. Make wonderful presentations using this diagram.

Bar Graph For Business Growth Steps Powerpoint Slides
This PowerPoint template contains design of bar graph with icons. You may download this slide to display strategy steps for business growth. You can easily customize this template to make it more unique as per your need.

Bar Graph With Plant For Growth Powerpoint Template
This PowerPoint template has been designed with diagram of bar graph with plant. This infographic template may be used to display growth and progress. Accelerate the impact of your ideas using this template.

Bar Graph With Line Chart For Analysis Powerpoint Slides
This PowerPoint template contains design of bar graph with line chart. You may download this slide to display strategy steps for business growth. You can easily customize this template to make it more unique as per your need.

Bar Graph With Yearly Statistical Analysis Powerpoint Slides
This PowerPoint template contains diagram of bar graph with yearly percentage ratios. You may download this slide to display statistical analysis. You can easily customize this template to make it more unique as per your need.
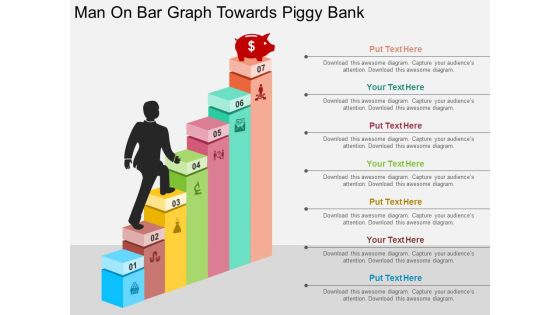
Man On Bar Graph Towards Piggy Bank Powerpoint Templates
Our above business slide contains graphics of man on bar graph towards piggy bank. This slide may be used to exhibit finance planning and saving. Capture the attention of your audience with this slide.

Growth Graph With Arrow On Target Board Powerpoint Slides
This PowerPoint template is useful for making presentations on business goals and strategy formation. This PPT background has a design of growth graph with arrow on target. This PPT slide is suitable for topics like corporate strategic planning.

Bar Graph Infographics With Success Arrow Powerpoint Slides
This PowerPoint template has been designed with bar graph with success arrow. You may use this PPT slide to display goal achievement and planning. Impress your audiences by using this PPT slide.

Bar Graph For Profit Growth Analysis Powerpoint Slides
This PowerPoint template has been designed with bar graph with percentage values. This diagram is useful to exhibit profit growth analysis. This diagram slide can be used to make impressive presentations.

Five Steps Bar Graph For Financial Management Powerpoint Slides
This PowerPoint template has been designed with five steps bar graph and icons. This diagram is useful to exhibit financial management. This diagram slide can be used to make impressive presentations.
Map Diagram With Bar Graph And Icons Powerpoint Slides
This PowerPoint template displays graphics of map diagram with bar graph and icons. This Map template can be used in business presentations to depict economic analysis. This slide can also be used by school students for educational projects.
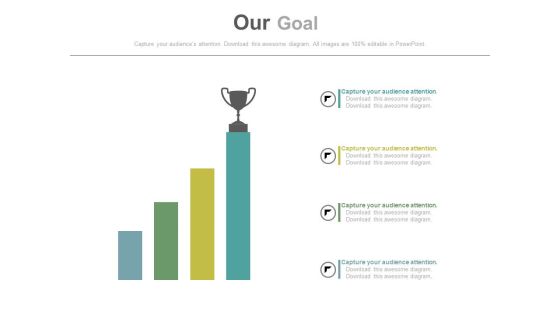
Growth Bar Graph With Trophy On Top Powerpoint Slides
This PowerPoint template has been designed with growth bar graph and trophy onto of it. Download this PPT slide to define and achieve goals with more success. This diagram may be used for goal planning related topics.

Bar Graph With Increasing Percentage Flow Powerpoint Slides
This PowerPoint slide has been designed with bar graph and increasing percentage values. This diagram slide may be used to display profit growth. Prove the viability of your ideas with this professional slide.

Bar Graph On Blackboard For Growth Analysis Powerpoint Template
Visually support your presentation with our above template containing bar graph on blackboard. This PowerPoint template helps to display growth analysis. Etch your views in the brains of your audience with this diagram slide.

Bar Graph Of Lego Blocks For Data Analysis Powerpoint Slides
This PowerPoint template contains bar graph made of Lego blocks. You may use this slide to display growth process. This diagram provides an effective way of displaying information you can edit text, color, shade and style as per you need.

Bar Graph With Financial Ratio And Icons Powerpoint Template
Visually support your presentation with our above template containing bar graph with icons. This diagram slide helps to exhibit financial ratio analysis. Etch your views in the brains of your audience with this diagram slide.
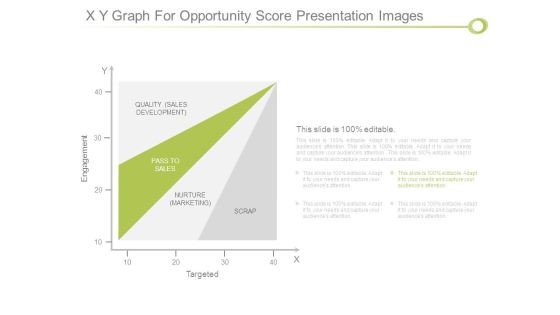
X Y Graph For Opportunity Score Presentation Images
This is a x y graph for opportunity score presentation images. This is a one stage process. The stages in this process are engagement, quality sales development, pass to sales, nurture marketing, scrap, targeted.
Market Share And Competitor Positioning Graph Ppt Icon
This is a market share and competitor positioning graph ppt icon. This is a four stage process. The stages in this process are average market growth, company growth, gaining market share, losing market share.
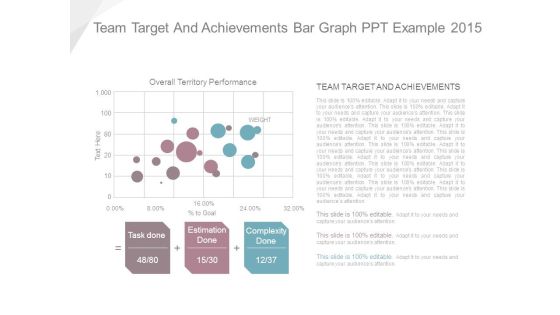
Team Target And Achievements Bar Graph Ppt Example 2015
This is a team target and achievements bar graph ppt example 2015. This is a three stage process. The stages in this process are task done, estimation done, complexity done, overall territory performance, team target and achievements.

Bar Graph For Changes In Competitive Environment Example Of Ppt
This is a bar graph for changes in competitive environment example of ppt. This is a four stage process. The stages in this process are engagement, brand, monthly, weekly.

Hiring Plan Bar Graph With Categories Powerpoint Slide Graphics
This is a hiring plan bar graph with categories powerpoint slide graphics. This is a five stage process. The stages in this process are finance, support, product, marketing, sales, engineering.
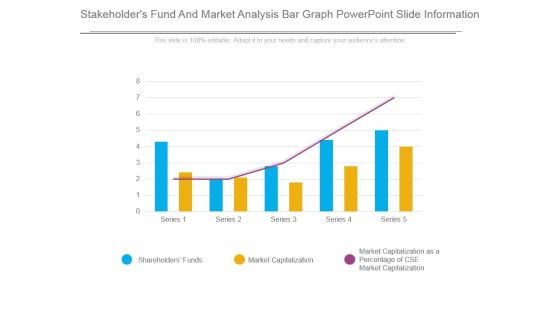
Stakeholders Fund And Market Analysis Bar Graph Powerpoint Slide Information
This is a stakeholders fund and market analysis bar graph powerpoint slide information. This is a five stage process. The stages in this process are shareholders funds, market capitalization, market capitalization as a percentage of cse market capitalization.

Inflation Rate Analysis Bar Graph Powerpoint Slide Backgrounds
This is a inflation rate analysis bar graph powerpoint slide backgrounds. This is a twelve stage process. The stages in this process are jan, feb, mar, apr, may, jun, jul, aug, sep, oct, nov, dec.
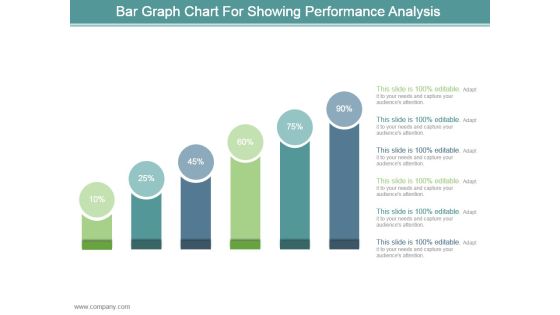
Bar Graph Chart For Showing Performance Analysis Ppt Design
This is a bar graph chart for showing performance analysis ppt design. This is a six stage process. The stages in this process are business, marketing, process, success, presentation.

Sales Growth Bar Graph Ppt PowerPoint Presentation Background Image
This is a sales growth bar graph ppt powerpoint presentation background image. This is a five stage process. The stages in this process are arrows, success, business, marketing, process.
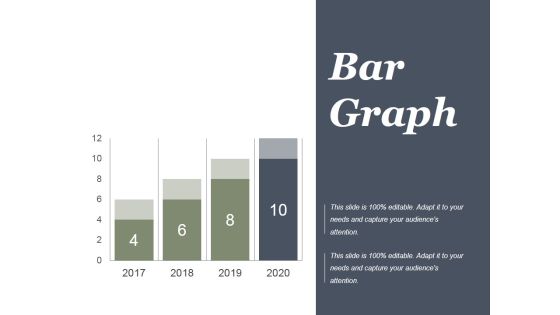
Project Performance Bar Graph Ppt PowerPoint Presentation Outline
This is a project performance bar graph ppt powerpoint presentation outline. This is a four stage process. The stages in this process are finance, year, business, marketing, future, marketing.

Bar Graph To Showcase Financial Analysis Ppt PowerPoint Presentation Professional
This is a bar graph to showcase financial analysis ppt powerpoint presentation professional. This is a four stage process. The stages in this process are business, marketing, growth, success, arrows.
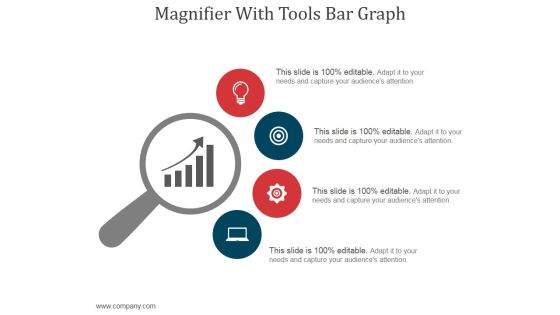
Magnifier With Tools Bar Graph Ppt PowerPoint Presentation Professional
This is a magnifier with tools bar graph ppt powerpoint presentation professional. This is a four stage process. The stages in this process are magnifier, business, marketing, strategy, icons.

Magnifier With Tools And Bar Graph Ppt PowerPoint Presentation Diagrams
This is a magnifier with tools and bar graph ppt powerpoint presentation diagrams. This is a four stage process. The stages in this process are magnifier, strategy, search, business, management.

Financial Projection Graph Slide2 Ppt PowerPoint Presentation Themes
This is a financial projection graph slide2 ppt powerpoint presentation themes. This is a five stage process. The stages in this process are year, total sales, gross, margin, net income

 Home
Home