Errc Graph
Statistics Graph Business PowerPoint Templates And PowerPoint Themes 0612
Statistics Graph Business PowerPoint Templates And PowerPoint Themes Business PPT-Microsoft Powerpoint Templates and Background with colorful stats icon
Arrow Bar Graph Business PowerPoint Templates And PowerPoint Themes 0612
Arrow Bar Graph Business PowerPoint Templates And PowerPoint Themes Business PPT Templates-Business success, finance, sales, success, business, arrows

Arrow Graph Business Globe PowerPoint Templates And PowerPoint Themes 0612
Arrow Graph Business Globe PowerPoint Templates And PowerPoint Themes Business PPT Templates-Bars and blue arrow, business, sale, shape, sign, success
Growth Bar Graph Finance PowerPoint Templates And PowerPoint Themes 0612
Growth Bar Graph Finance PowerPoint Templates And PowerPoint Themes Business PPT Templates-Growth ladder success, abstract, ladder, business, marketing, finance

Growth Bar Graph Success PowerPoint Templates And PowerPoint Themes 0612
Growth Bar Graph Success PowerPoint Templates And PowerPoint Themes Business PPT Templates-Growth ladder success, abstract, ladder, business, marketing, finance

Bar Graph Business PowerPoint Templates And PowerPoint Themes 0712
Bar Graph Business PowerPoint Templates And PowerPoint Themes 0712-Microsoft Powerpoint Templates and Background with business success with arrow
Bar Graph Growth Success PowerPoint Templates And PowerPoint Themes 0712
Bar Graph Gowth Success PowerPoint Templates And PowerPoint Themes 0712-Microsoft Powerpoint Templates and Background with bar chart growth
Profits Bar Graph Finance PowerPoint Templates And PowerPoint Themes 0712
Profits Bar Graph Finance PowerPoint Templates And PowerPoint Themes 0712-Microsoft Powerpoint Templates and Background with profits bar chart
Arrow Graph Business Success PowerPoint Templates And PowerPoint Themes 0712
Arrow Graph Business Success PowerPoint Templates And PowerPoint Themes 0712-Microsoft Powerpoint Templates and Background with bars and arrow

Dollar Growth Graph Success PowerPoint Templates And PowerPoint Themes 0712
Dollar Growth Graph Success PowerPoint Templates And PowerPoint Themes 0712-Microsoft Powerpoint Templates and Background with dollar growth
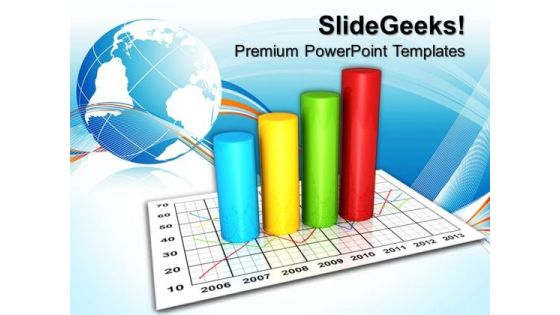
Products Sale Graph Business PowerPoint Templates And PowerPoint Themes 0812
Products Sale Graph Business PowerPoint Templates And PowerPoint Themes 0812-Microsoft Powerpoint Templates and Background with sales growth business chart

Increasing Oil Prices Graph PowerPoint Templates And PowerPoint Themes 0912
Increasing Oil Prices Graph PowerPoint Templates And PowerPoint Themes 0912-Microsoft Powerpoint Templates and Background with oil barrels with increasing arrow

Career Graph Success PowerPoint Templates And PowerPoint Themes 0912
Career Graph Success PowerPoint Templates And PowerPoint Themes 0912-Microsoft Powerpoint Templates and Background with ladder of career
Business Graph Up PowerPoint Templates And PowerPoint Themes 1012
Business Graph Up PowerPoint Templates And PowerPoint Themes 1012-This PowerPoint Template shows the Bar Graph with increasing percentage which signifies the Financial Growth. The Template signifies the concept of Team Work, Team Leader etc. The structure of our templates allows you to effectively highlight the key issues concerning the growth of your business.-Business Graph Up PowerPoint Templates And PowerPoint Themes 1012-This PowerPoint template can be used for presentations relating to-Business graph, success, arrows, business, signs, shapes

Business Success Graph PowerPoint Templates And PowerPoint Themes 1012
Business Success Graph PowerPoint Templates And PowerPoint Themes 1012-The PowerPoint Template shows the Growing Percentage Graph with each letter of Success on each step. This template portrays the concepts of winning, leadership, Finance, Success, competition, sports, business, shapes, people and abstract.-Business Success Graph PowerPoint Templates And PowerPoint Themes 1012-This PowerPoint template can be used for presentations relating to-Business graph showing growth, success, business, finance, marketing, stairs
Growth Graph Moving Up PowerPoint Templates And PowerPoint Themes 1012
Growth Graph Moving Up PowerPoint Templates And PowerPoint Themes 1012-This PowerPoint Template shows the Bar Graph with increasing percentage which signifies the Financial Growth. The Template signifies the concept of Team Work, Team Leader etc. The structure of our templates allows you to effectively highlight the key issues concerning the growth of your business.-Growth Graph Moving Up PowerPoint Templates And PowerPoint Themes 1012-This PowerPoint template can be used for presentations relating to-Business graph with rising arrow, success, business, arrows, marketing, finance
Golden Bar Graph Success PowerPoint Templates And PowerPoint Themes 1012
Golden Bar Graph Success PowerPoint Templates And PowerPoint Themes 1012-Use this Above PowerPoint Template Displaying the Bar Graph in Horizontal Manner. It indicates beefing up, boost, buildup, crop, cultivation, enlargement, evolution, gain, heightening, hike, improvement, increase. Original thinking is the need of the hour. We provide the means to project your views.-Golden Bar Graph Success PowerPoint Templates And PowerPoint Themes 1012-This PowerPoint template can be used for presentations relating to-Business Graph, Business, Competition, Finance, Future, Technology
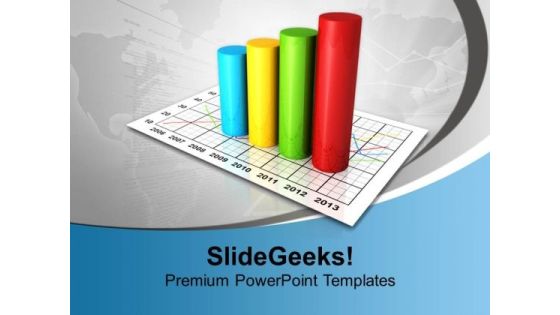
Graph Growth Business PowerPoint Templates And PowerPoint Themes 1012
Graph Growth Business PowerPoint Templates And PowerPoint Themes 1012-The PowerPoint Template shows the annual growth of business through bar graph. This template portrays the Business Concept. You can use this template to illustrate Global Issues. An excellent graphic to attract the attention of your audience to improve earnings. -Graph Growth Business PowerPoint Templates And PowerPoint Themes 1012-This PowerPoint template can be used for presentations relating to-Growth graph background, Marketing, Symbol, Business, Process and flows, Abstract

Business Management Strategy 3d With Bar Graph Adaptable Concepts
Your ideas will do the trick. Wave the wand with our business management strategy 3d with bar graph adaptable concepts.

Business Framework Model Circular Procedure Graph Diagrams Marketing Diagram
Get The Doers Into Action. Activate Them With Our Business Framework Model Circular Procedure Graph Diagrams Marketing Diagram Powerpoint Templates.
Stock Photo Bar Graph With Percentage For Finance PowerPoint Slide
This Power Point template has been designed with graphic of bar graph and percentage value. This image slide contains the concept of finance and accounting. Use this editable diagram for your business and finance related presentations.
Business Diagram Human Icon Bar Graph For Business Presentation Template
Graphic of human icons and bar graph has been used to decorate this power point template. This PPT contains the concept of business communication and result analysis. Use this PPT for business and marketing related presentations.

Bar Graph For Descriptive Analysis Ppt PowerPoint Presentation Shapes
This is a bar graph for descriptive analysis ppt powerpoint presentation shapes. This is a five stage process. The stages in this process are icons, business, marketing, management, process.
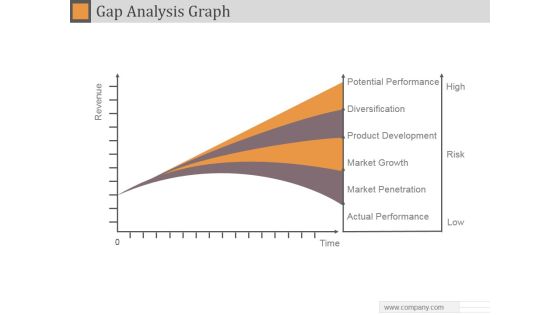
Gap Analysis Graph Ppt PowerPoint Presentation Example 2015
This is a gap analysis graph ppt powerpoint presentation example 2015. This is a four stage process. The stages in this process are potential performance, diversification, product development, market growth, market penetration, actual performance.
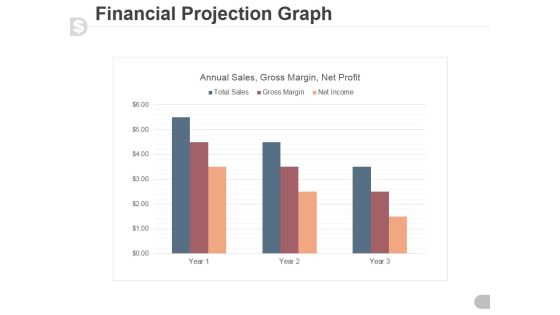
Financial Projection Graph Template 1 Ppt PowerPoint Presentation Guide
This is a financial projection graph template 1 ppt powerpoint presentation guide. This is a three stage process. The stages in this process are annual sales, gross margin, net profit.

Bar Graph Ppt PowerPoint Presentation Infographic Template Deck
This is a bar graph ppt powerpoint presentation infographic template deck. This is a five stage process. The stages in this process are bar chart, business, marketing, strategy, planning.

Bar Graph Finance Ppt PowerPoint Presentation Infographics Background Designs
This is a bar graph finance ppt powerpoint presentation infographics background designs. This is a two stage process. The stages in this process are finance, analysis, business, investment, marketing.

Distributed Network Graph Algorithm Ppt Powerpoint Presentation Outline Master Slide
This is a distributed network graph algorithm ppt powerpoint presentation outline master slide. This is a four stage process. The stages in this process are scatter plot, probability plots, plot diagram.

Plotting Line Graph Ppt Powerpoint Presentation Styles Maker
This is a plotting line graph ppt powerpoint presentation styles maker. This is a five stage process. The stages in this process are scatter plot, probability plots, plot diagram.

Bar Graph Percentage Product Ppt PowerPoint Presentation Layouts Microsoft
This is a bar graph percentage product ppt powerpoint presentation layouts microsoft. This is a three stage process. The stages in this process are business, management, marketing, percentage, product.

Bar Graph Product Ppt PowerPoint Presentation Model Graphic Tips
This is a bar graph product ppt powerpoint presentation model graphic tips. This is a three stage process. The stages in this process are product, percentage, business, management, marketing.

Waterfall Graph Showing Business Progress Ppt PowerPoint Presentation Styles Model
This is a waterfall graph showing business progress ppt powerpoint presentation styles model. This is a three stage process. The stages in this process are profit and loss, balance sheet, income statement, benefit and loss.
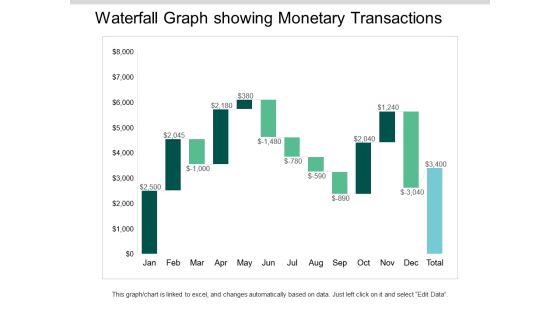
Waterfall Graph Showing Monetary Transactions Ppt PowerPoint Presentation Ideas Visuals
This is a waterfall graph showing monetary transactions ppt powerpoint presentation ideas visuals. This is a three stage process. The stages in this process are profit and loss, balance sheet, income statement, benefit and loss.

Bar Graph Percentage Product Ppt PowerPoint Presentation Styles Good
This is a bar graph percentage product ppt powerpoint presentation styles good. This is a three stage process. The stages in this process are area chart, finance, marketing, management, investment.

Energy Performance Assessment Dashboard Graph Ppt PowerPoint Presentation Slide
Presenting this set of slides with name energy performance assessment dashboard graph ppt powerpoint presentation slide. The topics discussed in these slides are marketing, business, management, planning, strategy. This is a completely editable PowerPoint presentation and is available for immediate download. Download now and impress your audience.

Competition Market Share Analysis Graph Ppt PowerPoint Presentation Infographics Inspiration
Presenting this set of slides with name competition market share analysis graph ppt powerpoint presentation infographics inspiration. The topics discussed in these slides are marketing, business, management, planning, strategy. This is a completely editable PowerPoint presentation and is available for immediate download. Download now and impress your audience.

Bar Graph Process Ppt PowerPoint Presentation Portfolio Designs Download
Presenting this set of slides with name bar graph process ppt powerpoint presentation portfolio designs download. The topics discussed in these slides are finance, marketing, management, investment, analysis. This is a completely editable PowerPoint presentation and is available for immediate download. Download now and impress your audience.

Area Graph Analysis Ppt PowerPoint Presentation Summary Graphics Example
Presenting this set of slides with name area graph analysis ppt powerpoint presentation summary graphics example. The topics discussed in these slides are finance, marketing, management, investment, analysis. This is a completely editable PowerPoint presentation and is available for immediate download. Download now and impress your audience.

Bar Graph Investment Ppt PowerPoint Presentation Infographics Graphics Template
Presenting this set of slides with name bar graph investment ppt powerpoint presentation infographics graphics template. The topics discussed in these slides are finance, marketing, management, investment, analysis. This is a completely editable PowerPoint presentation and is available for immediate download. Download now and impress your audience.

Bar Graph Chart Analysis Ppt PowerPoint Presentation Outline Good
Presenting this set of slides with name bar graph chart analysis ppt powerpoint presentation outline good. The topics discussed in these slides are finance, marketing, management, investment, analysis. This is a completely editable PowerPoint presentation and is available for immediate download. Download now and impress your audience.

Bar Graph Chart Analysis Ppt PowerPoint Presentation Gallery Objects
Presenting this set of slides with name bar graph chart analysis ppt powerpoint presentation gallery objects. The topics discussed in these slides are finance, marketing, management, investment, analysis. This is a completely editable PowerPoint presentation and is available for immediate download. Download now and impress your audience.

Bar Graph Product Ppt PowerPoint Presentation Icon Layout
Presenting this set of slides with name bar graph product ppt powerpoint presentation icon layout. The topics discussed in these slides are finance, marketing, management, investment, analysis. This is a completely editable PowerPoint presentation and is available for immediate download. Download now and impress your audience.
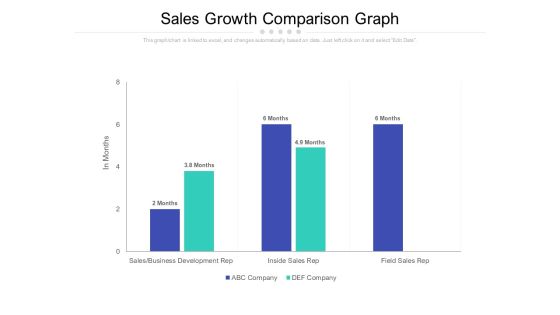
Sales Growth Comparison Graph Ppt PowerPoint Presentation Outline Demonstration
Presenting this set of slides with name sales growth comparison graph ppt powerpoint presentation outline demonstration. The topics discussed in these slides are sales, business development rep, inside sales rep, field sales rep. This is a completely editable PowerPoint presentation and is available for immediate download. Download now and impress your audience.
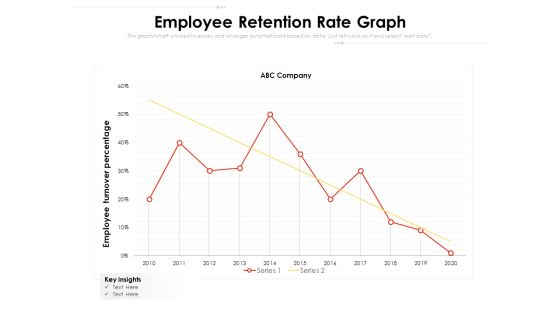
Employee Retention Rate Graph Ppt PowerPoint Presentation Pictures Portrait PDF
Presenting this set of slides with name employee retention rate graph ppt powerpoint presentation pictures portrait pdf. The topics discussed in these slides are key insights, 2010 to 2020, employee turnover percentage. This is a completely editable PowerPoint presentation and is available for immediate download. Download now and impress your audience.

Business Operations Assessment Company Sales Graph Ppt Portfolio Good PDF
Deliver an awe-inspiring pitch with this creative business operations assessment company sales graph ppt portfolio good pdf bundle. Topics like market value, sales volume can be discussed with this completely editable template. It is available for immediate download depending on the needs and requirements of the user.
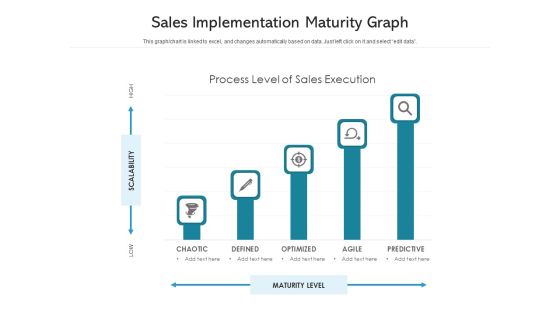
Sales Implementation Maturity Graph Ppt PowerPoint Presentation Inspiration Microsoft PDF
Showcasing this set of slides titled sales implementation maturity graph ppt powerpoint presentation inspiration microsoft pdf. The topics addressed in these templates are chaotic, defined, optimized, agile, predictive. All the content presented in this PPT design is completely editable. Download it and make adjustments in color, background, font etc. as per your unique business setting.

Administrative Regulation Company Sales Graph Ppt PowerPoint Presentation Outline PDF
Deliver an awe-inspiring pitch with this creative administrative regulation company sales graph ppt powerpoint presentation outline pdf bundle. Topics like market value, sales volume can be discussed with this completely editable template. It is available for immediate download depending on the needs and requirements of the user.

Corporate Regulation Company Sales Graph Ppt Infographics Backgrounds PDF
Deliver an awe inspiring pitch with this creative corporate regulation company sales graph ppt infographics backgrounds pdf bundle. Topics like sales, value, market can be discussed with this completely editable template. It is available for immediate download depending on the needs and requirements of the user.

Company Sales Graph Business Analysis Method Ppt Professional Visuals PDF
Deliver an awe inspiring pitch with this creative company sales graph business analysis method ppt professional visuals pdf bundle. Topics like market value, sales can be discussed with this completely editable template. It is available for immediate download depending on the needs and requirements of the user.
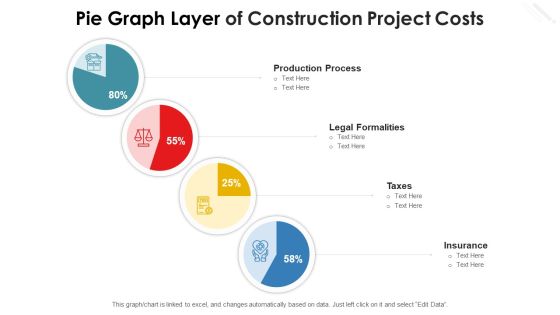
Pie Graph Layer Of Construction Project Costs Diagrams PDF
Showcasing this set of slides titled pie graph layer of construction project costs diagrams pdf. The topics addressed in these templates are production process, taxes, legal formalities, insurance. All the content presented in this PPT design is completely editable. Download it and make adjustments in color, background, font etc. as per your unique business setting.
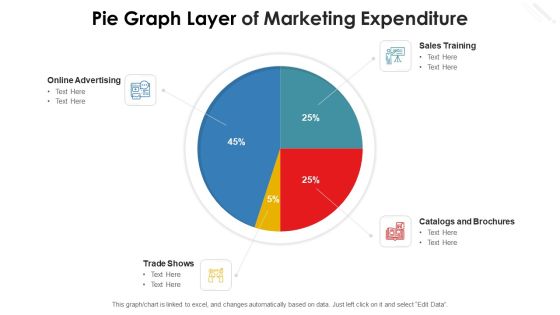
Pie Graph Layer Of Marketing Expenditure Themes PDF
Pitch your topic with ease and precision using this pie graph layer of marketing expenditure themes pdf. This layout presents information on online advertising, trade shows, sales training, catalogs and brochures. It is also available for immediate download and adjustment. So, changes can be made in the color, design, graphics or any other component to create a unique layout.

Pie Graph Layer Of Organizational Report Themes PDF
Pitch your topic with ease and precision using this pie graph layer of organizational report themes pdf. This layout presents information on revenues increased by, business growth and expansion, customer traffic increased by. It is also available for immediate download and adjustment. So, changes can be made in the color, design, graphics or any other component to create a unique layout.

Pie Graph Layer Presenting Business Expenses Topics PDF
Pitch your topic with ease and precision using this pie graph layer presenting business expenses topics pdf. This layout presents information on investment, material procurement, training, employees salary, factory rent. It is also available for immediate download and adjustment. So, changes can be made in the color, design, graphics or any other component to create a unique layout.

Pie Graph Layer Presenting Departments Of Organization Infographics PDF
Showcasing this set of slides titled pie graph layer presenting departments of organization infographics pdf. The topics addressed in these templates are sales and marketing, production, manufacturing, research and development. All the content presented in this PPT design is completely editable. Download it and make adjustments in color, background, font etc. as per your unique business setting.

Pie Graph Layer Representing Company Budget Sample PDF
Pitch your topic with ease and precision using this pie graph layer representing company budget sample pdf. This layout presents information on maintenance and repairs, operating expenses, research and development, salaries and wages. It is also available for immediate download and adjustment. So, changes can be made in the color, design, graphics or any other component to create a unique layout.

Pie Graph Layer Representing Employment Opportunities By Industry Ideas PDF
Showcasing this set of slides titled pie graph layer representing employment opportunities by industry ideas pdf. The topics addressed in these templates are hospitality, retail trade, manufacturing services, education and health services, professional and business services. All the content presented in this PPT design is completely editable. Download it and make adjustments in color, background, font etc. as per your unique business setting.
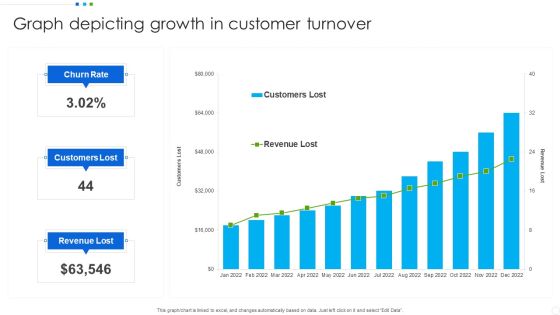
Graph Depicting Growth In Customer Turnover Infographics PDF
Showcasing this set of slides titled Graph Depicting Growth In Customer Turnover Infographics PDF. The topics addressed in these templates are Revenue Lost, Customers Lost, Churn Rate. All the content presented in this PPT design is completely editable. Download it and make adjustments in color, background, font etc. as per your unique business setting.
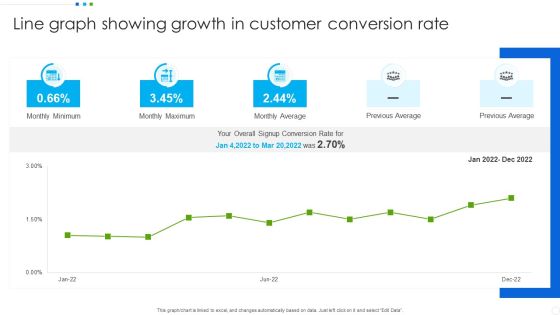
Line Graph Showing Growth In Customer Conversion Rate Inspiration PDF
Pitch your topic with ease and precision using this Line Graph Showing Growth In Customer Conversion Rate Inspiration PDF. This layout presents information on Monthly Average, Customer Conversion Rate, Previous Average. It is also available for immediate download and adjustment. So, changes can be made in the color, design, graphics or any other component to create a unique layout.

Product Performance Comparison Graph Showing Revenue Growth Portrait PDF
Showcasing this set of slides titled Product Performance Comparison Graph Showing Revenue Growth Portrait PDF. The topics addressed in these templates are Sales Revenue, Product. All the content presented in this PPT design is completely editable. Download it and make adjustments in color, background, font etc. as per your unique business setting.
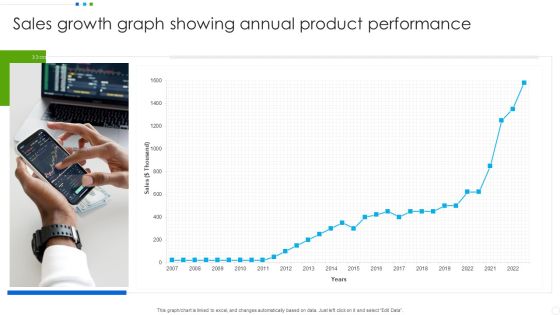
Sales Growth Graph Showing Annual Product Performance Slides PDF
Pitch your topic with ease and precision using this Sales Growth Graph Showing Annual Product Performance Slides PDF. This layout presents information on Sales Growth, Product Performance. It is also available for immediate download and adjustment. So, changes can be made in the color, design, graphics or any other component to create a unique layout.
 Home
Home