Errc Graph
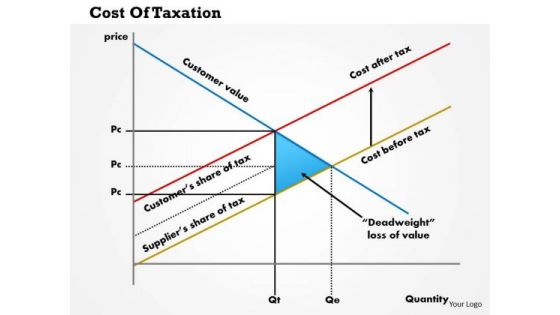
Business Framework Cost Of Taxation PowerPoint Presentation
This innovative image slide has been designed to display coat of taxation graph. This business framework template may be used to display financial ratios of taxation in your presentations. This image slide will impart professional appearance to your presentations.
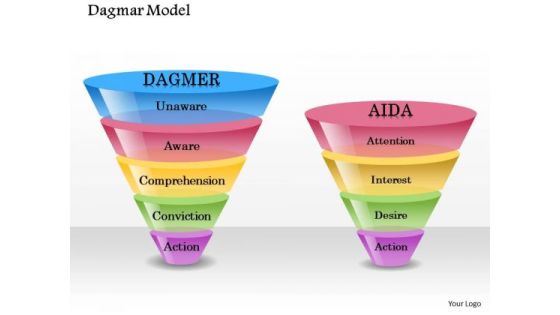
Business Framework Diagram Model PowerPoint Presentation
This Business framework Power Point template slide has been crafted with graphic of vertical graph. This PPT contains the concept of demand chain management. Use this PPT and build exclusive presentation.

Business Framework Merger And Acquisition Synergy PowerPoint Presentation
This Power Point template slide has been designed with graphic of semicircular design for result display on graph. This design can be used for merger and acquisition for synergy. Use this PPT slide for your business presentation.

Business Diagram Brand Equity And Brand Value Presentation Template
Explain the concept of brand equity and brand value with this unique business diagram. This diagram slide contains the graphic of multiple bar graphs. Download this awesome diagram to capture your audiences attention.

Business Diagram Thermometer Graphics Indicating Progress Presentation Template
This power point template diagram has been designed with graphic of thermometer and bar graph. This PPT contains the concept of growth analysis. Use this PPT for business and marketing related presentations.

Business Diagram Peoples On Bars Of Progress Presentation Template
This power point template has been crafted with graphic of peoples and bar graph. This PPT contains the concept of progress and growth. Use this PPT for your business and marketing related presentations.
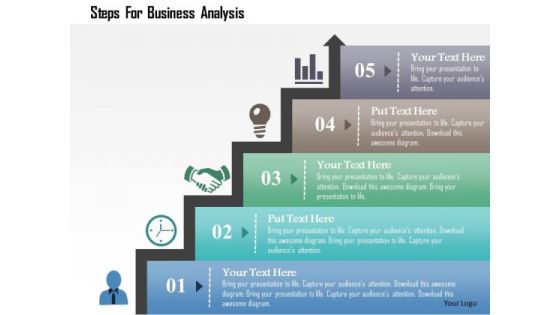
Business Diagram Steps For Business Analysis Presentation Template
Concept of time management has been defined in this power point template diagram. This diagram contains the graphic of bar graph. Amplify your thoughts via this appropriate business template.
Business Diagram Modern Icons On Pie Chart Presentation Template
Download this diagram to displays marketing strategy. This business diagram contains the graphic of icons on pie graph. Use this template to highlight the key issues of your presentation.

Money Bags With Euro Growth Arrow PowerPoint Templates
The above PPT slide contains graphics of money bag with Euro growth graph. This professionally designed slide may be used to depict financial growth analysis. This slide will help your viewers automatically empathize with your thoughts

Pencils With Bulbs In Increasing Flow PowerPoint Templates
This slide has been designed with pencil bulb graph. This diagram is suitable to display creative ideas and strategy. This professional slide helps in making an instant impact on viewers.

Dollar Over Umbrella Currency Growth Filteration Ppt Slides Graphics
This PPT slide displays graphics of dollar with umbrella, dollar target and growth graph. This PPT helps to depict concepts of financial saving and security. This icon slide is innovatively designed to highlight your worthy views

Business Reports On Laptop Powerpoint Template
This PPT slide has been designed with graphics of laptop on office table presenting statistical graph. This business diagram maybe used to exhibit management strategy. Use this diagram to build an exclusive presentation.
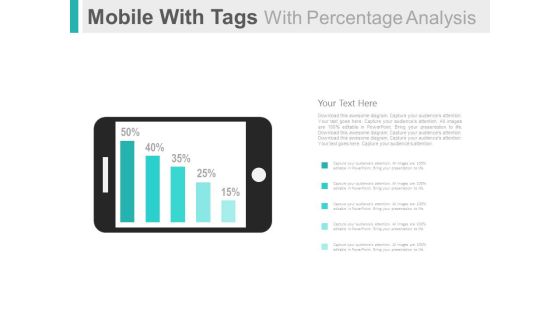
Mobile For Online Survey And Analysis Powerpoint Slides
This PowerPoint template has been designed with graphics of mobile and percentage bar graph. This PPT slide can be used to display online survey and analysis. You can download finance PowerPoint template to prepare awesome presentations.
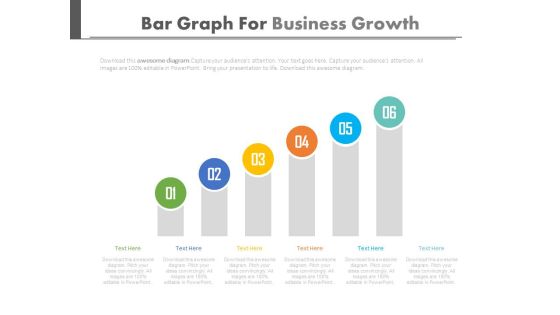
Setting Goals And Developing Strategies Powerpoint Slides
This PowerPoint template is useful for setting goals and developing strategies. This PPT background has a design of six steps bar graph. This PPT slide is suitable for topics like corporate strategic planning.
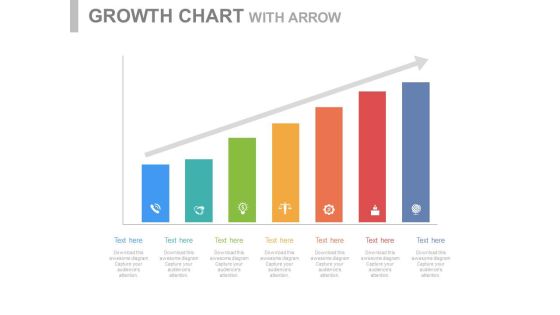
Steps For Developing Strategic Plan Powerpoint Slides
This PowerPoint template is useful for setting goals and developing strategies. This PPT background has a design of seven steps bar graph. This PPT slide is suitable for topics like corporate strategic planning.

Four Arrow Strips Infographic Powerpoint Templates
Our above slide contains graphics of bulb with success graph. It helps to exhibit planning for growth. Use this diagram to impart more clarity to data and to create more sound impact on viewers.
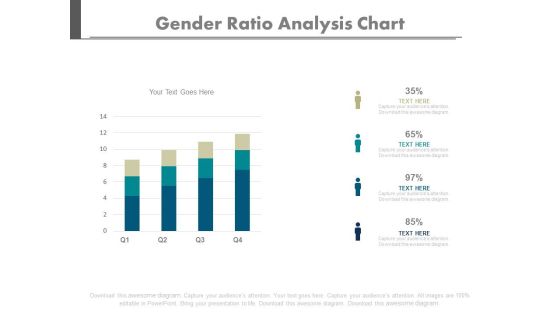
Four Bars Gender Population Ratio Chart Powerpoint Slides
Create dynamic presentations with our creative template of bar graph. This diagram may be used to present gender population. Download this template to leave permanent impression on your audience.
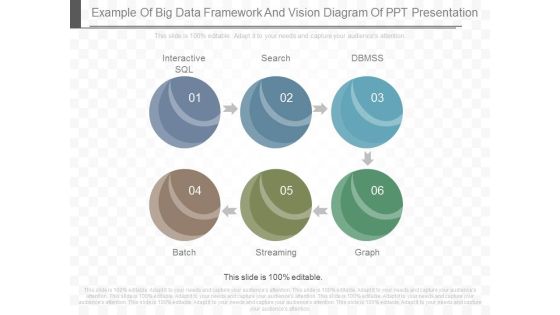
Example Of Big Data Framework And Vision Diagram Of Ppt Presentation
This is a example of big data framework and vision diagram of ppt presentation. This is a six stage process. The stages in this process are interactive sql, search, dbmss, batch, streaming, graph.
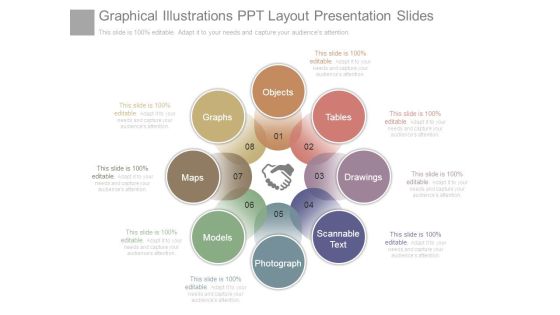
Graphical Illustrations Ppt Layout Presentation Slides
This is a graphical illustrations ppt layout presentation slides. This is a eight stage process. The stages in this process are graphs, maps, models, photograph, scannable text, drawings, tables, objects.
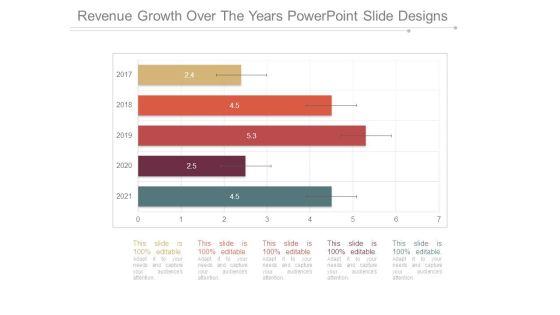
Revenue Growth Over The Years Powerpoint Slide Designs
This is a revenue growth over the years powerpoint slide designs. This is a five stage process. The stages in this process are bar graph, years, business, growth, marketing.

Annual Hiring Plan Bar Chart Example Of Ppt
This is a annual hiring plan bar chart example of ppt. This is a five stage process. The stages in this process are bar graph, business, marketing, growth, success.
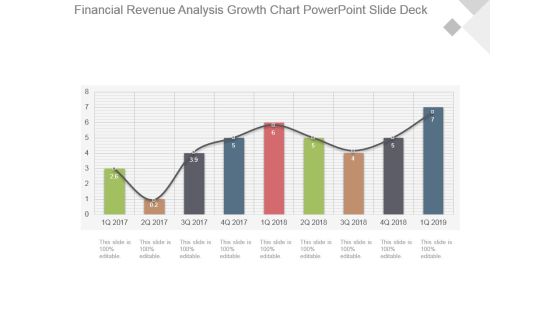
Financial Revenue Analysis Growth Chart Powerpoint Slide Deck
This is a financial revenue analysis growth chart powerpoint slide deck. This is a nine stage process. The stages in this process are growth, success, business, marketing, bar graph.

Gross Margin Analysis Bar Chart Powerpoint Slide Backgrounds
This is a gross margin analysis bar chart powerpoint slide backgrounds. This is a two stage process. The stages in this process are bar graph, business, marketing, growth, success.

Dividend Per Share Bar Chart Powerpoint Slide Background Designs
This is a dividend per share bar chart powerpoint slide background designs. This is a five stage process. The stages in this process are business, marketing, success, growth, bar graph.
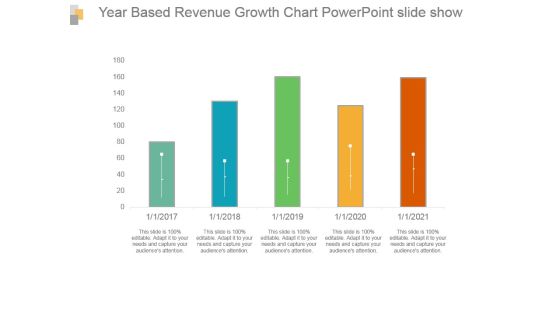
Year Based Revenue Growth Chart Powerpoint Slide Show
This is a year based revenue growth chart powerpoint slide show. This is a five stage process. The stages in this process are bar graph, growth, revenue, year, success.

Corporate Growth Over The Years Ppt PowerPoint Presentation Good
This is a corporate growth over the years ppt powerpoint presentation good. This is a five stage process. The stages in this process are business, strategy, marketing, growth, bar graph.
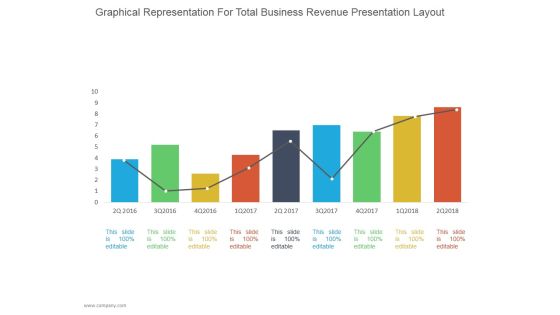
Graphical Representation For Total Business Revenue Ppt PowerPoint Presentation Diagrams
This is a graphical representation for total business revenue ppt powerpoint presentation diagrams. This is a nine stage process. The stages in this process are business, strategy, line chart, bar graph, marketing, management.

Crm Dashboard Deals By Expected Close Date Ppt PowerPoint Presentation Background Images
This is a crm dashboard deals by expected close date ppt powerpoint presentation background images. This is a five stage process. The stages in this process are bar graph, aug, sep, oct, growth.

Cycle Time By Month Ppt PowerPoint Presentation Guidelines
This is a cycle time by month ppt powerpoint presentation guidelines. This is a twelve stage process. The stages in this process are business, strategy, marketing, process, arrow, finance, bar graph.

Data Collection And Analysis Control Chart Ppt PowerPoint Presentation Example File
This is a data collection and analysis control chart ppt powerpoint presentation example file. This is a four stage process. The stages in this process are business, strategy, marketing, bar graph, growth strategy.
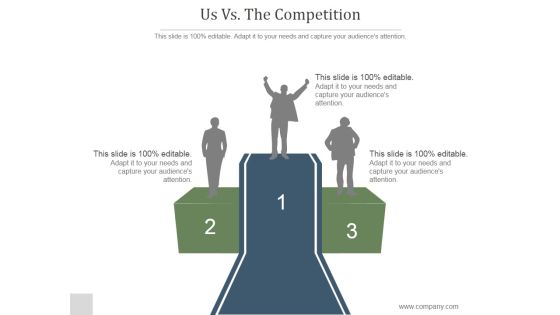
Us Vs The Competition Slide Ppt PowerPoint Presentation Examples
This is a us vs the competition slide ppt powerpoint presentation examples. This is a five stage process. The stages in this process are year, graph, marketing, year, management.

Projected Sales Volume Ppt PowerPoint Presentation Pictures
This is a projected sales volume ppt powerpoint presentation pictures. This is a five stage process. The stages in this process are business, strategy, marketing, analysis, liner process, bar graph.
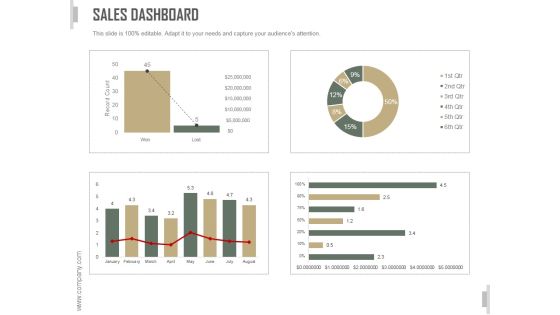
Sales Dashboard Slide Ppt PowerPoint Presentation Template
This is a sales dashboard slide ppt powerpoint presentation template. This is a three stage process. The stages in this process are business, strategy, marketing, analysis, bar graph, growth strategy.
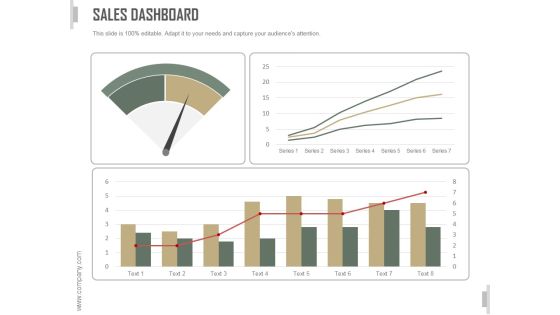
Sales Dashboard Ppt PowerPoint Presentation Design Templates
This is a sales dashboard ppt powerpoint presentation design templates. This is a four stage process. The stages in this process are business, strategy, marketing, analysis, bar graph, growth strategy.
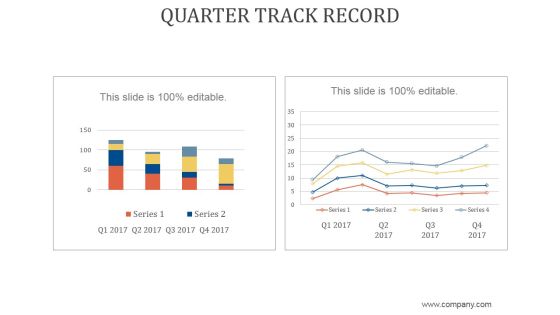
Quarter Track Record Ppt PowerPoint Presentation Samples
This is a quarter track record ppt powerpoint presentation samples. This is a two stage process. The stages in this process are business, strategy, marketing, analysis, growth strategy, bar graph.
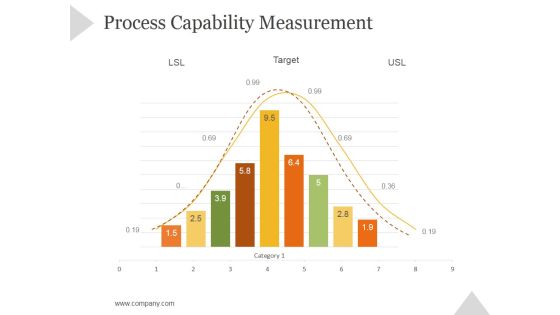
Process Capability Measurement Ppt PowerPoint Presentation Rules
This is a process capability measurement ppt powerpoint presentation rules. This is a nine stage process. The stages in this process are business, strategy, marketing, success, bar graph, growth strategy.

Current Quarter Portfolio Ppt PowerPoint Presentation Visual Aids
This is a current quarter portfolio ppt powerpoint presentation visual aids. This is a two stage process. The stages in this process are business, strategy, marketing, finance, growth strategy, bar graph.

Lead Scoring Template Ppt PowerPoint Presentation Model
This is a lead scoring template ppt powerpoint presentation model. This is a four stage process. The stages in this process are business, marketing, success, bar graph, lead scoring.

Business Plan Executive Summary Ppt PowerPoint Presentation Complete Deck With Slides
This is a business plan executive summary ppt powerpoint presentation complete deck with slides. This is a one stage process. The stages in this process are business, marketing, graph, management, communication.

Portfolio Evaluation Template 2 Ppt PowerPoint Presentation Picture
This is a portfolio evaluation template 2 ppt powerpoint presentation picture. This is a five stage process. The stages in this process are business, strategy, marketing, analysis, finance, chart and graph.
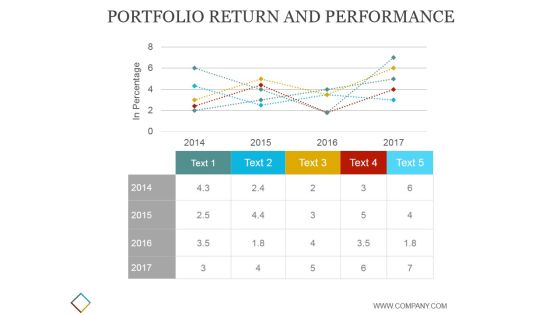
Portfolio Return And Performance Template Ppt PowerPoint Presentation Visuals
This is a portfolio return and performance template ppt powerpoint presentation visuals. This is a five stage process. The stages in this process are business, strategy, marketing, analysis, finance, chart and graph, growth.

Service Design Document Template 1 Ppt PowerPoint Presentation Portfolio
This is a service design document template 1 ppt powerpoint presentation portfolio. This is a five stage process. The stages in this process are business, marketing, success, graph, points.
Revenue Generation Company Performance Ppt PowerPoint Presentation Icon
This is a revenue generation company performance ppt powerpoint presentation icon. This is a four stage process. The stages in this process are finance, planning, chart graph, marketing, strategy.

Customer Trends Template 1 Ppt PowerPoint Presentation Diagrams
This is a customer trends template 1 ppt powerpoint presentation diagrams. This is a five stage process. The stages in this process are business, marketing, bar graph, finance, management.

Competitive Analysis Template 4 Scatter Chart Radar Chart Ppt PowerPoint Presentation Topics
This is a competitive analysis template 4 scatter chart radar chart ppt powerpoint presentation topics. This is a six stage process. The stages in this process are business, analysis, graph, marketing, scatter.

Companies Clients I Worked For Ppt PowerPoint Presentation Samples
This is a companies clients i worked for ppt powerpoint presentation samples. This is a four stage process. The stages in this process are management, icons, strategy, business, graph, location.

Pareto Analysis Tamplate 2 Ppt PowerPoint Presentation Graphics
This is a pareto analysis tamplate 2 ppt powerpoint presentation graphics. This is a twelve stage process. The stages in this process are bar graph, finance, marketing, strategy, analysis, business.
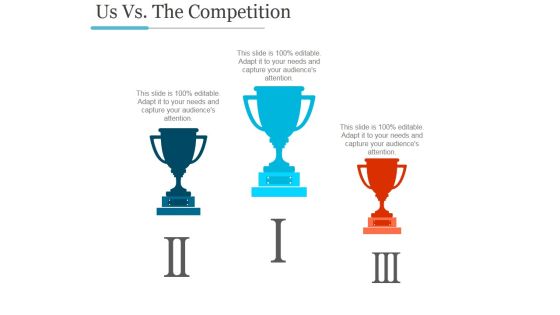
Us Vs The Competition Template Ppt PowerPoint Presentation Summary
This is a us vs the competition template ppt powerpoint presentation summary. This is a three stage process. The stages in this process are graph, success, growth, business, market.

Business Profile PPT PowerPoint Presentation Complete Deck With Slides
This is a business profile ppt powerpoint presentation complete deck with slides. This is a one stage process. The stages in this process are business, marketing, communication, people, graph.

Column Chart Ppt PowerPoint Presentation Designs
This is a column chart ppt powerpoint presentation designs. This is a two stage process. The stages in this process are business, strategy, analysis, marketing, chart and graph, growth.

Combo Chart Ppt PowerPoint Presentation Examples
This is a combo chart ppt powerpoint presentation examples. This is a three stage process. The stages in this process are business, strategy, analysis, marketing, chart and graph, growth.
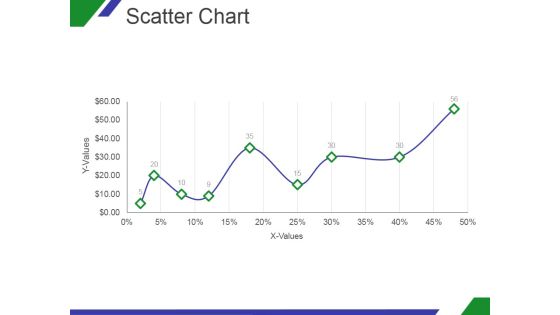
Scatter Chart Ppt PowerPoint Presentation Designs Download
This is a scatter chart ppt powerpoint presentation designs download. This is a nine stage process. The stages in this process are x values, y values, graph, growth, success.

Market Analysis Ppt PowerPoint Presentation Introduction
This is a market analysis ppt powerpoint presentation introduction. This is a six stage process. The stages in this process are business, marketing, analysis, strategy, chart and graph, growth.

Bar Chart Ppt PowerPoint Presentation Background Designs
This is a bar chart ppt powerpoint presentation background designs. This is a twelve stage process. The stages in this process are bar graph, finance, marketing, strategy, analysis, investment.

Column Chart Ppt PowerPoint Presentation Background Designs
This is a column chart ppt powerpoint presentation background designs. This is a two stage process. The stages in this process are bar graph, finance, marketing, strategy, analysis, business.
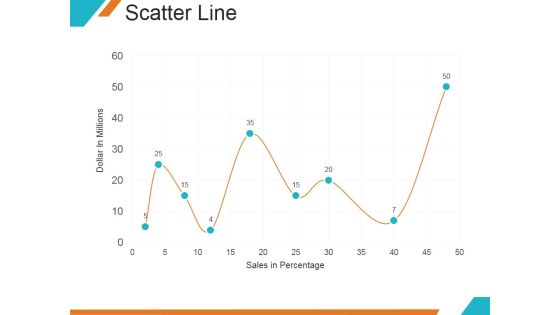
Scatter Line Ppt PowerPoint Presentation Backgrounds
This is a scatter line ppt powerpoint presentation backgrounds. This is a nine stage process. The stages in this process are dollar in millions, sales in percentage, graph, growth.

Combo Chart Ppt PowerPoint Presentation Infographics Infographics
This is a combo chart ppt powerpoint presentation infographics infographics. This is a three stage process. The stages in this process are bar graph, growth, finance, marketing, strategy, business.
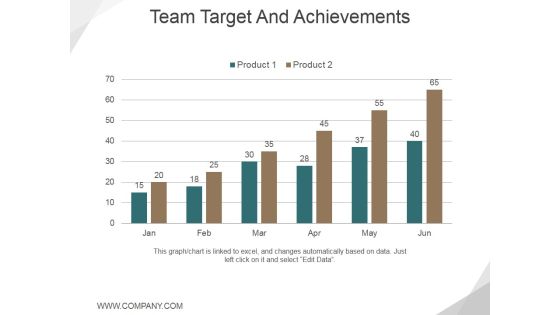
Team Target And Achievements Template 2 Ppt PowerPoint Presentation Infographic Template Graphic Tips
This is a team target and achievements template 2 ppt powerpoint presentation infographic template graphic tips. This is a six stage process. The stages in this process are graph, growth, success, business, marketing.

Crm Dashboard Current Lead Status Ppt PowerPoint Presentation Infographic Template Visual Aids
This is a crm dashboard current lead status ppt powerpoint presentation infographic template visual aids. This is a six stage process. The stages in this process are bar graph, finance, marketing, strategy, business, analysis.

Crm Dashboard Deals By Expected Close Date Ppt PowerPoint Presentation Portfolio Icons
This is a crm dashboard deals by expected close date ppt powerpoint presentation portfolio icons. This is a three stage process. The stages in this process are bar graph, finance, marketing, strategy, business, analysis, growth.
 Home
Home