Errc Graph
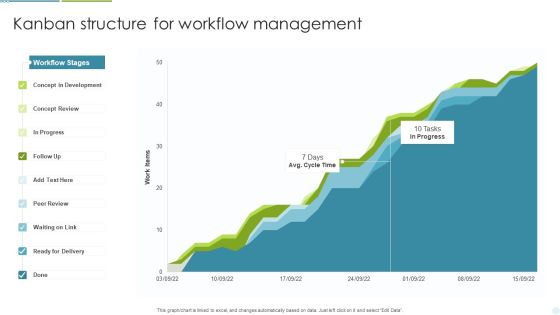
Kanban Structure For Workflow Management Ppt Inspiration Template PDF
This graph or chart is linked to excel, and changes automatically based on data. Just left click on it and select Edit Data. Pitch your topic with ease and precision using this Kanban Structure For Workflow Management Ppt Inspiration Template PDF. This layout presents information on Concept Development, Concept Review, Ready For Delivery. It is also available for immediate download and adjustment. So, changes can be made in the color, design, graphics or any other component to create a unique layout.
Kanban Structure For Yearly Project Progress Tracking Ppt File Example Introduction PDF
This graph or chart is linked to excel, and changes automatically based on data. Just left click on it and select Edit Data. Showcasing this set of slides titled Kanban Structure For Yearly Project Progress Tracking Ppt File Example Introduction PDF. The topics addressed in these templates are Number Projects, Backlog Approved, Final Review. All the content presented in this PPT design is completely editable. Download it and make adjustments in color, background, font etc. as per your unique business setting.

Kanban Structure To Manage Weekly Work Activities Ppt Professional Aids PDF
This graph or chart is linked to excel, and changes automatically based on data. Just left click on it and select Edit Data. Pitch your topic with ease and precision using this Kanban Structure To Manage Weekly Work Activities Ppt Professional Aids PDF. This layout presents information on Legend, Ready To Start, In Progress. It is also available for immediate download and adjustment. So, changes can be made in the color, design, graphics or any other component to create a unique layout.
Kanban Structure To Track Cycle Time For Project Execution Ppt Icon Images PDF
This graph or chart is linked to excel, and changes automatically based on data. Just left click on it and select Edit Data. Showcasing this set of slides titled Kanban Structure To Track Cycle Time For Project Execution Ppt Icon Images PDF. The topics addressed in these templates are Lead Time, Cycle Time, WIP Limit. All the content presented in this PPT design is completely editable. Download it and make adjustments in color, background, font etc. as per your unique business setting.

Kanban Structure With Process Lead Time Ppt Gallery Template PDF
This graph or chart is linked to excel, and changes automatically based on data. Just left click on it and select Edit Data. Showcasing this set of slides titled Kanban Structure With Process Lead Time Ppt Gallery Template PDF. The topics addressed in these templates are Lead Time, In Realization, Requirements. All the content presented in this PPT design is completely editable. Download it and make adjustments in color, background, font etc. as per your unique business setting.
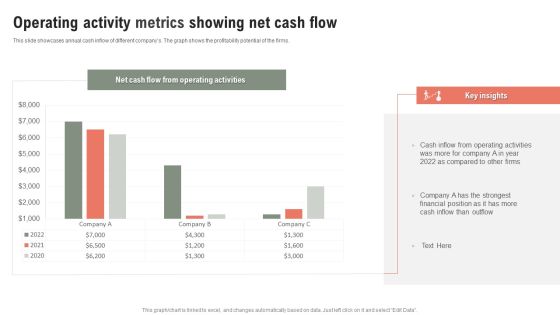
Operating Activity Metrics Showing Net Cash Flow Ppt Outline Slide Download PDF
This slide showcases annual cash inflow of different companys. The graph shows the profitability potential of the firm. Showcasing this set of slides titled Operating Activity Metrics Showing Net Cash Flow Ppt Outline Slide Download PDF. The topics addressed in these templates are Net Cash Flow, Operating Activities, Key Insights, 2020 To 2022. All the content presented in this PPT design is completely editable. Download it and make adjustments in color, background, font etc. as per your unique business setting.
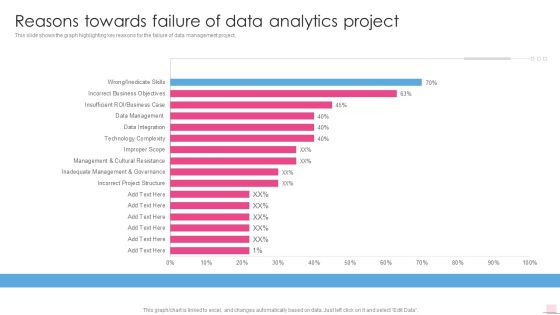
Reasons Towards Failure Of Data Analytics Project Business Analysis Modification Toolkit Topics PDF
This slide shows the graph highlighting key reasons for the failure of data management project.Deliver an awe inspiring pitch with this creative Reasons Towards Failure Of Data Analytics Project Business Analysis Modification Toolkit Topics PDF bundle. Topics like Incorrect Project, Inadequate Management, Cultural Resistance can be discussed with this completely editable template. It is available for immediate download depending on the needs and requirements of the user.

Career Succession Planning By Human Resource Department Statistics Graphics PDF
This slide represents the graph showing the statistics related to the key insights of the succession plan developed by the human resource department of the organization. Showcasing this set of slides titled Career Succession Planning By Human Resource Department Statistics Graphics PDF. The topics addressed in these templates are Employees, Customer, Marketing Manager. All the content presented in this PPT design is completely editable. Download it and make adjustments in color, background, font etc. as per your unique business setting.
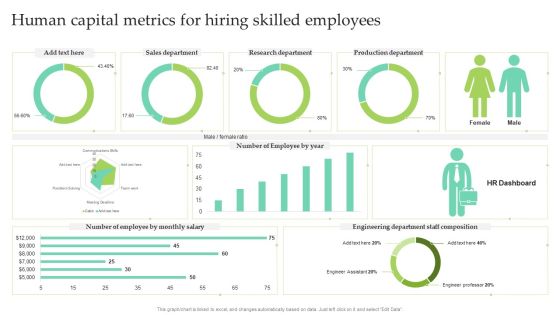
Human Capital Metrics For Hiring Skilled Employees Ppt Slides Themes PDF
This graph or chart is linked to excel, and changes automatically based on data. Just left click on it and select Edit Data. Showcasing this set of slides titled Human Capital Metrics For Hiring Skilled Employees Ppt Slides Themes PDF. The topics addressed in these templates are Sales Department, Research Department, Production Department. All the content presented in this PPT design is completely editable. Download it and make adjustments in color, background, font etc. as per your unique business setting.

Human Capital Metrics For New Hire Ppt Pictures Brochure PDF
This graph or chart is linked to excel, and changes automatically based on data. Just left click on it and select Edit Data. Pitch your topic with ease and precision using this Human Capital Metrics For New Hire Ppt Pictures Brochure PDF. This layout presents information on Active Employee Count, New Hire Count, New Hire. It is also available for immediate download and adjustment. So, changes can be made in the color, design, graphics or any other component to create a unique layout.

Human Capital Metrics For Proper Management Ppt Show Inspiration PDF
This graph or chart is linked to excel, and changes automatically based on data. Just left click on it and select Edit Data. Showcasing this set of slides titled Human Capital Metrics For Proper Management Ppt Show Inspiration PDF. The topics addressed in these templates are Candidates Per Position, Hired Per Source, Location. All the content presented in this PPT design is completely editable. Download it and make adjustments in color, background, font etc. as per your unique business setting.

Human Capital Metrics With Absenteeism Rate Ppt Infographic Template Ideas PDF
This graph or chart is linked to excel, and changes automatically based on data. Just left click on it and select Edit Data. Pitch your topic with ease and precision using this Human Capital Metrics With Absenteeism Rate Ppt Infographic Template Ideas PDF. This layout presents information on Overall Labor Effectiveness, OLE Department, Absenteeism. It is also available for immediate download and adjustment. So, changes can be made in the color, design, graphics or any other component to create a unique layout.
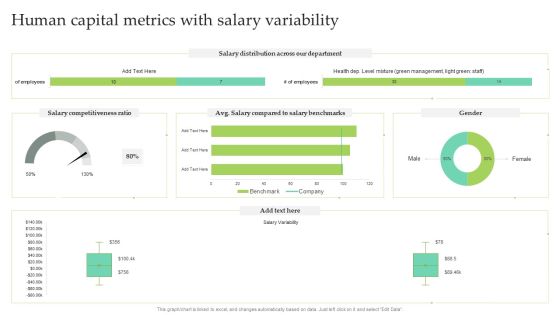
Human Capital Metrics With Salary Variability Ppt Infographic Template Designs PDF
This graph or chart is linked to excel, and changes automatically based on data. Just left click on it and select Edit Data. Pitch your topic with ease and precision using this Human Capital Metrics With Salary Variability Ppt Infographic Template Designs PDF. This layout presents information on Salary Distribution, Salary Competitiveness Ratio, Male. It is also available for immediate download and adjustment. So, changes can be made in the color, design, graphics or any other component to create a unique layout.
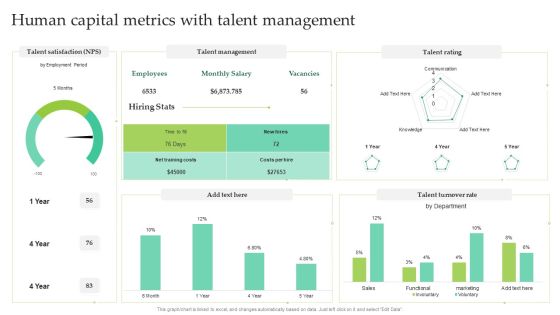
Human Capital Metrics With Talent Management Ppt Layouts Mockup PDF
This graph or chart is linked to excel, and changes automatically based on data. Just left click on it and select Edit Data. Showcasing this set of slides titled Human Capital Metrics With Talent Management Ppt Layouts Mockup PDF. The topics addressed in these templates are Talent Management, Talent Rating, Talent Turnover Rate. All the content presented in this PPT design is completely editable. Download it and make adjustments in color, background, font etc. as per your unique business setting.
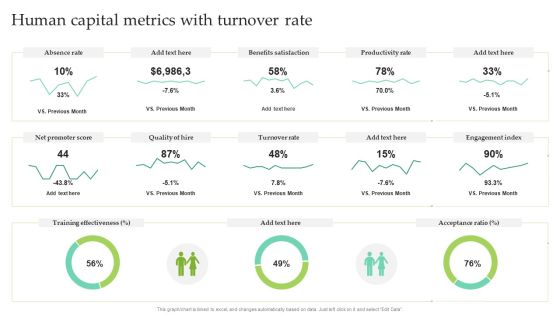
Human Capital Metrics With Turnover Rate Ppt Pictures Outline PDF
This graph or chart is linked to excel, and changes automatically based on data. Just left click on it and select Edit Data. Pitch your topic with ease and precision using this Human Capital Metrics With Turnover Rate Ppt Pictures Outline PDF. This layout presents information on Absence Rate, Benefits Satisfaction, Productivity Rate. It is also available for immediate download and adjustment. So, changes can be made in the color, design, graphics or any other component to create a unique layout.

Market Chart Showing Revenue Breakdown Of IT Products Ppt File Elements PDF
This slide shows the revenue comparison graph of IT products over last six months. IT products covered in the slide are hardware and software. Pitch your topic with ease and precision using this Market Chart Showing Revenue Breakdown Of IT Products Ppt File Elements PDF. This layout presents information on Hardware, Software, Key Insights. It is also available for immediate download and adjustment. So, changes can be made in the color, design, graphics or any other component to create a unique layout.

Product Market Share Chart Of Electronic Company Ppt Gallery Graphic Tips PDF
This slide shows the percentage of market share graph of electronic company products. It includes mobile phone, laptop, tablet, computer and others devices. Pitch your topic with ease and precision using this Product Market Share Chart Of Electronic Company Ppt Gallery Graphic Tips PDF. This layout presents information on Mobile Phone, Computer, Laptop, Tablet. It is also available for immediate download and adjustment. So, changes can be made in the color, design, graphics or any other component to create a unique layout.

Dashboard Depicting Security Problem Management Metrics Ppt Gallery Designs PDF
This graph or chart is linked to excel, and changes automatically based on data. Just left click on it and select Edit Data. Showcasing this set of slides titled Dashboard Depicting Security Problem Management Metrics Ppt Gallery Designs PDF. The topics addressed in these templates are Percentage, New Critical, Security Incidents. All the content presented in this PPT design is completely editable. Download it and make adjustments in color, background, font etc. as per your unique business setting.

Data Evaluation And Processing Toolkit Reasons Towards Failure Of Data Analytics Project Designs PDF
This slide shows the graph highlighting key reasons for the failure of data management project. If your project calls for a presentation, then Slidegeeks is your go-to partner because we have professionally designed, easy-to-edit templates that are perfect for any presentation. After downloading, you can easily edit Data Evaluation And Processing Toolkit Reasons Towards Failure Of Data Analytics Project Designs PDF and make the changes accordingly. You can rearrange slides or fill them with different images. Check out all the handy templates.

Yearly Selling Forecasts Revenue Chart Summary PDF
This slide covers projections for yearly revenue generation from product sales. It includes forecasted revenue for different years and a graph depicting the projected sales revenue growth. Showcasing this set of slides titled Yearly Selling Forecasts Revenue Chart Summary PDF. The topics addressed in these templates are Project Sales Revenue, Forecasts Revenue Chart. All the content presented in this PPT design is completely editable. Download it and make adjustments in color, background, font etc. as per your unique business setting.
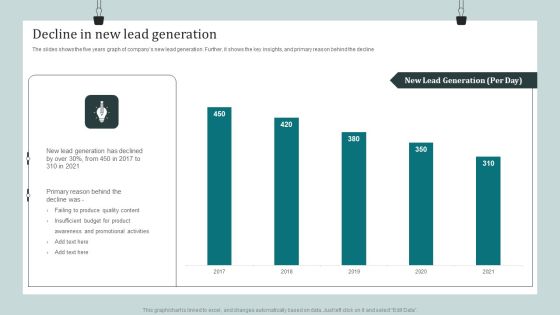
Product Awareness Strategies To Raise Demand Decline In New Lead Generation Background PDF
The slides shows the five years graph of companys new lead generation. Further, it shows the key insights, and primary reason behind the decline. There are so many reasons you need a Product Awareness Strategies To Raise Demand Decline In New Lead Generation Background PDF. The first reason is you can not spend time making everything from scratch, Thus, Slidegeeks has made presentation templates for you too. You can easily download these templates from our website easily.
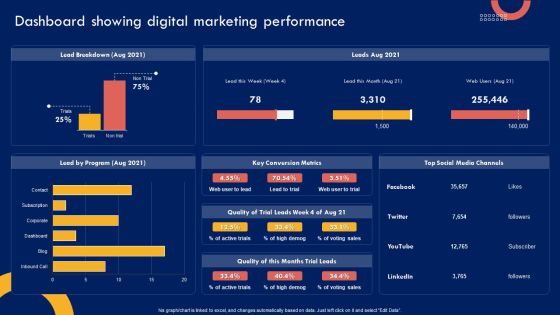
Product Marketing Leadership Dashboard Showing Digital Marketing Performance Download PDF
This graph OR chart is linked to excel, and changes automatically based on data. Just left click on it and select Edit Data. There are so many reasons you need a Product Marketing Leadership Dashboard Showing Digital Marketing Performance Download PDF. The first reason is you cant spend time making everything from scratch, Thus, Slidegeeks has made presentation templates for you too. You can easily download these templates from our website easily.

Product Marketing Leadership Product Marketing Dashboard For Pay Per Microsoft PDF
This graph or chart is linked to excel, and changes automatically based on data. Just left click on it and select Edit Data. Find a pre-designed and impeccable Product Marketing Leadership Product Marketing Dashboard For Pay Per Microsoft PDF. The templates can ace your presentation without additional effort. You can download these easy-to-edit presentation templates to make your presentation stand out from others. So, what are you waiting for Download the template from Slidegeeks today and give a unique touch to your presentation.
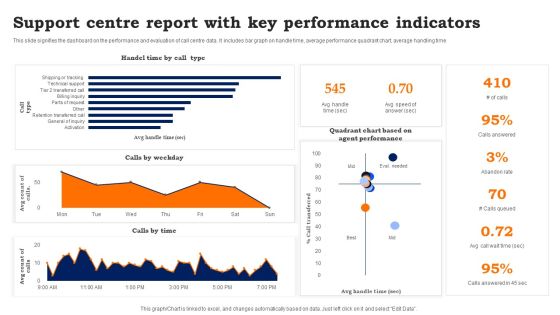
Support Centre Report With Key Performance Indicators Information PDF
This slide signifies the dashboard on the performance and evaluation of call centre data. It includes bar graph on handle time, average performance quadrant chart, average handling time. Showcasing this set of slides titled Support Centre Report With Key Performance Indicators Information PDF. The topics addressed in these templates are Support Centre Report, Key Performance Indicators. All the content presented in this PPT design is completely editable. Download it and make adjustments in color, background, font etc. as per your unique business setting.

Prevention Of Information Major Statistics Of Cyber Security Awareness Pictures PDF
This graph or chart is linked to excel, and changes automatically based on data. Just left click on it and select Edit Data. There are so many reasons you need a Prevention Of Information Major Statistics Of Cyber Security Awareness Pictures PDF. The first reason is you cant spend time making everything from scratch, Thus, Slidegeeks has made presentation templates for you too. You can easily download these templates from our website easily.
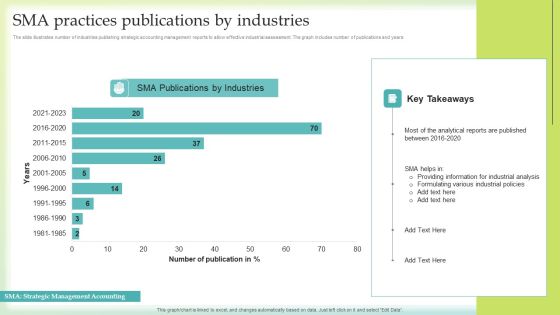
SMA Practices Publications By Industries Microsoft PDF
The slide illustrates number of industries publishing strategic accounting management reports to allow effective industrial assessment. The graph includes number of publications and years . Pitch your topic with ease and precision using this SMA Practices Publications By Industries Microsoft PDF. This layout presents information on Providing Information, Industrial Analysis, Publications Industries. It is also available for immediate download and adjustment. So, changes can be made in the color, design, graphics or any other component to create a unique layout.

Target Customer Analysis Evaluating Growth Rate Of Target Market Diagrams PDF
This slide showcases graph that can help organization to evaluate growth rate of target market. It can help company to identify potential and suitability of target market for expanding operations globally. There are so many reasons you need a Target Customer Analysis Evaluating Growth Rate Of Target Market Diagrams PDF. The first reason is you cant spend time making everything from scratch, Thus, Slidegeeks has made presentation templates for you too. You can easily download these templates from our website easily.
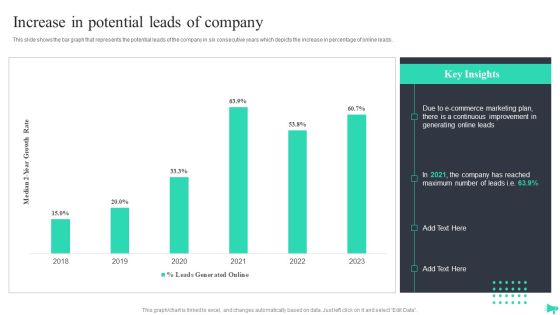
Implementing Ecommerce Marketing Services Plan Increase In Potential Leads Of Company Elements PDF
This slide shows the bar graph that represents the potential leads of the company in six consecutive years which depicts the increase in percentage of online leads. There are so many reasons you need a Implementing Ecommerce Marketing Services Plan Increase In Potential Leads Of Company Elements PDF. The first reason is you can not spend time making everything from scratch, Thus, Slidegeeks has made presentation templates for you too. You can easily download these templates from our website easily.
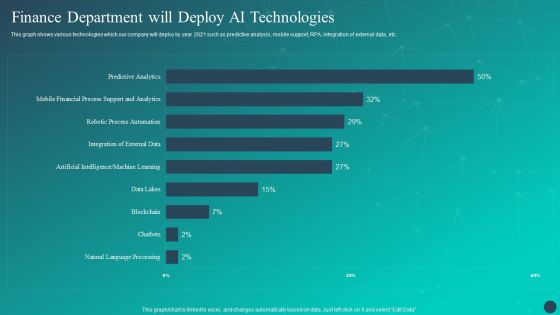
Optimizing AI Strategies To Improve Financial Services Finance Department Will Deploy AI Technologies Professional PDF
This graph shows various technologies which our company will deploy by year 2021 such as predictive analysis, mobile support, RPA, integration of external data, etc. There are so many reasons you need a Optimizing AI Strategies To Improve Financial Services Finance Department Will Deploy AI Technologies Professional PDF. The first reason is you can not spend time making everything from scratch, Thus, Slidegeeks has made presentation templates for you too. You can easily download these templates from our website easily.
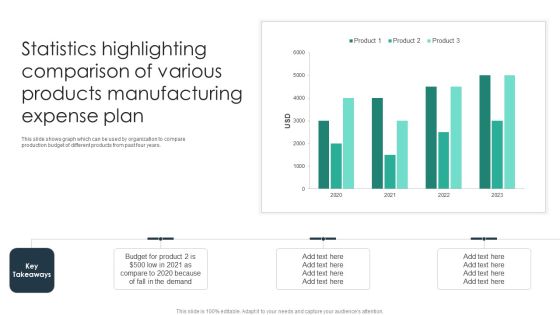
Statistics Highlighting Comparison Of Various Products Manufacturing Expense Plan Formats PDF
This slide shows graph which can be used by organization to compare production budget of different products from past four years. Pitch your topic with ease and precision using this Statistics Highlighting Comparison Of Various Products Manufacturing Expense Plan Formats PDF. This layout presents information on Budget For Product, Demand, Organization. It is also available for immediate download and adjustment. So, changes can be made in the color, design, graphics or any other component to create a unique layout.
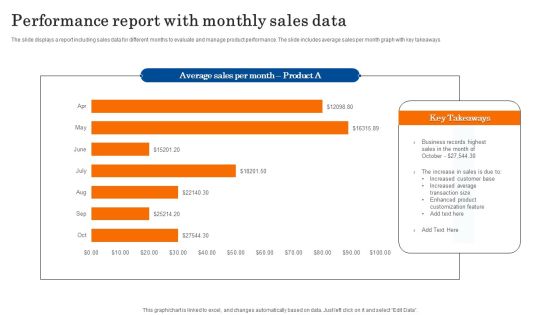
Performance Report With Monthly Sales Data Diagrams PDF
The slide displays a report including sales data for different months to evaluate and manage product performance. The slide includes average sales per month graph with key takeaways. Showcasing this set of slides titled Performance Report With Monthly Sales Data Diagrams PDF. The topics addressed in these templates are Business, Sales, Customization. All the content presented in this PPT design is completely editable. Download it and make adjustments in color, background, font etc. as per your unique business setting.

Customer Relationship Management And Daily Payments Dashboard With Top Reviews Professional PDF
This slide illustrates graphical representation of customer relationship management figures. It includes revenue, daily payments graph and top products etc. Showcasing this set of slides titled Customer Relationship Management And Daily Payments Dashboard With Top Reviews Professional PDF. The topics addressed in these templates are Quality Product, Services, Revenue. All the content presented in this PPT design is completely editable. Download it and make adjustments in color, background, font etc. as per your unique business setting.

Customer Relationship Management Dashboard With Sales And Profit Summary Microsoft PDF
This slide illustrates graphical representation of sales and profit figures. It includes sales summary, revenue vs. expenditure graph and ticket record etc. Showcasing this set of slides titled Customer Relationship Management Dashboard With Sales And Profit Summary Microsoft PDF. The topics addressed in these templates are Product Catalogue, Sales, Profit. All the content presented in this PPT design is completely editable. Download it and make adjustments in color, background, font etc. as per your unique business setting.
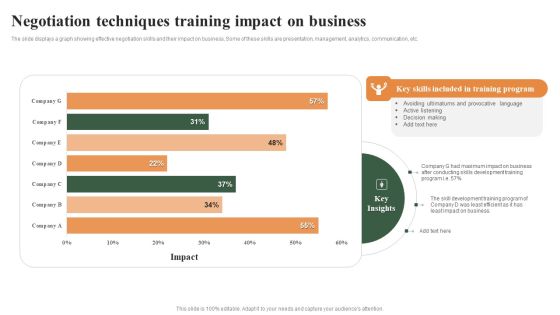
Negotiation Techniques Training Impact On Business Ppt Infographics Visual Aids PDF
The slide displays a graph showing effective negotiation skills and their impact on business, Some of these skills are presentation, management, analytics, communication, etc. Showcasing this set of slides titled Negotiation Techniques Training Impact On Business Ppt Infographics Visual Aids PDF. The topics addressed in these templates are Avoiding Ultimatums, Provocative Language, Active Listening, Decision Making. All the content presented in this PPT design is completely editable. Download it and make adjustments in color, background, font etc. as per your unique business setting.

Digital Marketing Statistics For Client Acquisition Strategy Background PDF
This slide signifies the bar graph of digital marketing strategies implemented to optimize customer conversion rate. It includes search engine optimisation, paid search, social media, display advertisement. Showcasing this set of slides titled Digital Marketing Statistics For Client Acquisition Strategy Background PDF. The topics addressed in these templates are Optimization, Social Media, Marketing. All the content presented in this PPT design is completely editable. Download it and make adjustments in color, background, font etc. as per your unique business setting.
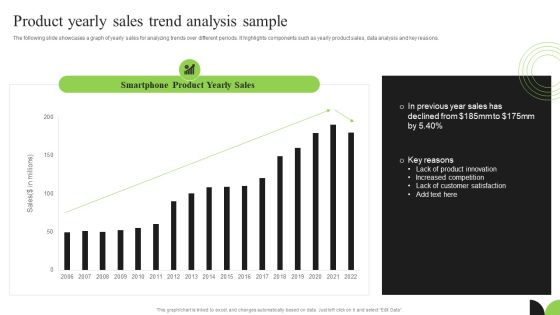
Guidebook For Executing Business Market Intelligence Product Yearly Sales Trend Analysis Sample Pictures PDF
The following slide showcases a graph of yearly sales for analyzing trends over different periods. It highlights components such as yearly product sales, data analysis and key reasons. There are so many reasons you need a Guidebook For Executing Business Market Intelligence Product Yearly Sales Trend Analysis Sample Pictures PDF. The first reason is you can not spend time making everything from scratch, Thus, Slidegeeks has made presentation templates for you too. You can easily download these templates from our website easily.

Buy Side M And A Service Management Vs Consensus Revenue Forecast Introduction PDF
The graph depicts a revenue comparison between management and consensus. It shows historical 2015 to 2020 and projected revenue 2021 to 2024. There are so many reasons you need a Buy Side M And A Service Management Vs Consensus Revenue Forecast Introduction PDF. The first reason is you can not spend time making everything from scratch, Thus, Slidegeeks has made presentation templates for you too. You can easily download these templates from our website easily.
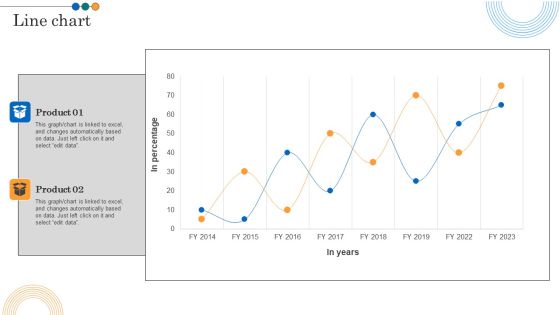
Implementing Marketing Strategies Line Chart Ppt PowerPoint Presentation File Mockup PDF
This graph or chart is linked to excel, and changes automatically based on data. Just left click on it and select edit data. There are so many reasons you need a Implementing Marketing Strategies Line Chart Ppt PowerPoint Presentation File Mockup PDF. The first reason is you can not spend time making everything from scratch, Thus, Slidegeeks has made presentation templates for you too. You can easily download these templates from our website easily.
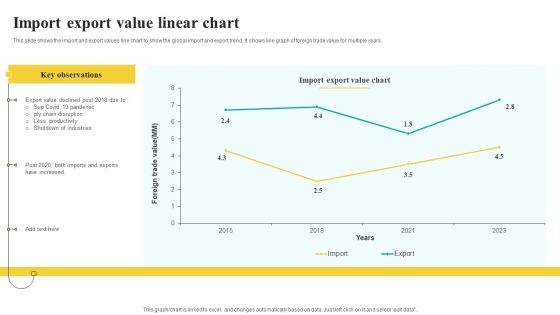
Import Export Value Linear Chart Summary PDF
This slide shows the import and export values line chart to show the global import and export trend. It shows line graph of foreign trade value for multiple years Showcasing this set of slides titled Import Export Value Linear Chart Summary PDF. The topics addressed in these templates are Key Observations, Value Chart, Industries. All the content presented in this PPT design is completely editable. Download it and make adjustments in color, background, font etc. as per your unique business setting.
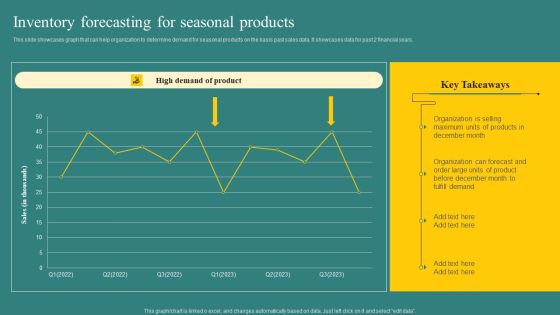
Inventory Forecasting For Seasonal Products Structure PDF
This slide showcases graph that can help organization to determine demand for seasonal products on the basis past sales data. It showcases data for past 2 financial years. There are so many reasons you need a Inventory Forecasting For Seasonal Products Structure PDF. The first reason is you can not spend time making everything from scratch, Thus, Slidegeeks has made presentation templates for you too. You can easily download these templates from our website easily.

Cost Analysis For Fixing Software Glitch Inspiration PDF
This graph depicts cost to fix bugs based on different time period. It include various stages such as requirements, coding, component testing, system testing and production. Showcasing this set of slides titled Cost Analysis For Fixing Software Glitch Inspiration PDF. The topics addressed in these templates are Increase Complexity, Remembering Codes, Lack Availability Service . All the content presented in this PPT design is completely editable. Download it and make adjustments in color, background, font etc. as per your unique business setting.
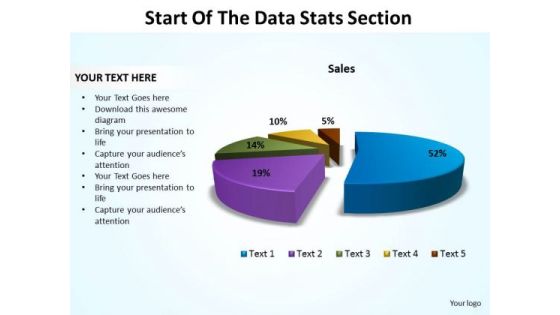
Business Marketing PowerPoint Templates Business Start Of The Data Stats Section Ppt Slides
Business Marketing PowerPoint Templates Business start of the data stats section PPT Slides-This Pie Chart is a simple template that provides a graphical, time-phased overview of a continuing sequence of stages, tasks, or events in a circular flow. You can divide a Pie Chart into segments for illustrating proportion-Business Marketing PowerPoint Templates Business start of the data stats section PPT Slides-This ppt can be used for concepts relating to-3d, Allocate, Allocation, Business, Chart, Circle, Data, Diagram, Divide, Division, Expensive, Financial, Graph Etc.

4 Stages Diverging Arrows Activity Diagram Ppt Cycle Chart PowerPoint Templates
We present our 4 stages diverging arrows activity diagram ppt Cycle Chart PowerPoint templates.Present our Process and Flows PowerPoint Templates because in our day to day pursuits we tend to overlook the fundamentals. Download our Business PowerPoint Templates because this template helps you to grab the attention of your listeners. Download our Arrows PowerPoint Templates because you have to coordinate and motivate your team. Download and present our Flow Charts PowerPoint Templates because you can Educate your team with the attention to be paid. Download and present our Success PowerPoint Templates because this is the unerring accuracy in reaching the target. the effortless ability to launch into flight.Use these PowerPoint slides for presentations relating to Business, Chart, Circle, Cyclic, Data, Diagram, Financial, Goal, Graph, Illustration, Info, Information, Marketing, Model, Option, Part, Pie, Presentation, Process, Result, Sphere, Statistics. The prominent colors used in the PowerPoint template are Green, Gray, White. People tell us our 4 stages diverging arrows activity diagram ppt Cycle Chart PowerPoint templates are Youthful. Customers tell us our Circle PowerPoint templates and PPT Slides will help you be quick off the draw. Just enter your specific text and see your points hit home. People tell us our 4 stages diverging arrows activity diagram ppt Cycle Chart PowerPoint templates are Nostalgic. Professionals tell us our Graph PowerPoint templates and PPT Slides are Pleasant. Customers tell us our 4 stages diverging arrows activity diagram ppt Cycle Chart PowerPoint templates are Whimsical. Use our Graph PowerPoint templates and PPT Slides are Quaint.
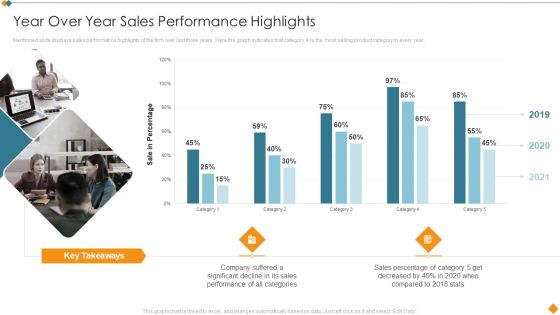
Maintaining Partner Relationships Year Over Year Sales Performance Highlights Template PDF
Mentioned slide displays sales performance highlights of the firm over last three years. Here the graph indicates that category 4 is the most selling product category in every year. Deliver and pitch your topic in the best possible manner with this Maintaining Partner Relationships Year Over Year Sales Performance Highlights Template PDF. Use them to share invaluable insights on Sales Performance, Sale Percentage, 2019 To 2021 and impress your audience. This template can be altered and modified as per your expectations. So, grab it now.

Puzzles Illustrating 9 Steps Linear Manner Manufacturing Flow Charts PowerPoint Templates
We present our puzzles illustrating 9 steps linear manner manufacturing flow charts PowerPoint templates.Use our Business PowerPoint Templates because, A brainwave has occurred to you after review. You know just how to push the graph skyward Use our Design PowerPoint Templates because, This will helps you to explore the minutest detail of each concept and follow the trail to its conclusion. Use our Marketing PowerPoint Templates because,There are a bucketful of brilliant ideas swirling around within your group. Use our Shapes PowerPoint Templates because,You have configured your targets, identified your goals as per priority and importance. Use our Metaphor PowerPoint Templates because,you can put it up there for all to see.Use these PowerPoint slides for presentations relating to abstract, arrow, arrows, business, chart, design, development, diagram, direction, element, flow, flowchart, graph, linear, management, model, motion, organization, plan, process, program, section, segment, set, sign, solution, strategy, symbol, technology. The prominent colors used in the PowerPoint template are Green, White, Gray

Up Arrows Business Growth PowerPoint Templates Ppt Backgrounds For Slides 0213
We present our Up Arrows Business Growth PowerPoint Templates PPT Backgrounds For Slides 0213.Use our Marketing PowerPoint Templates because Watching this your Audience will Grab their eyeballs, they wont even blink. Download and present our Finance PowerPoint Templates because Our PowerPoint Templates and Slides will steer your racing mind. Hit the right buttons and spur on your audience. Download and present our Success PowerPoint Templates because You can Double your output with our PowerPoint Templates and Slides. They make beating deadlines a piece of cake. Download our Business PowerPoint Templates because It is Aesthetically crafted by artistic young minds. Our PowerPoint Templates and Slides are designed to display your dexterity. Use our Arrows PowerPoint Templates because Our PowerPoint Templates and Slides are designed to help you succeed. They have all the ingredients you need.Use these PowerPoint slides for presentations relating to Business graph, graph chart arrow, business, finance, success, arrows, marketing. The prominent colors used in the PowerPoint template are Green, Gray, Black.

Evaluating Net Funding Requirement Of Organization Developing Fundraising Techniques Diagrams PDF
This slide showcases graph that can help organization to evaluate failure rate of previously crowdfunded companies. It illustrates graph that shows failure rate at seed stage for a period of last 4 financial years.Do you know about Slidesgeeks Evaluating Net Funding Requirement Of Organization Developing Fundraising Techniques Diagrams PDF These are perfect for delivering any kind od presentation. Using it, create PowerPoint presentations that communicate your ideas and engage audiences. Save time and effort by using our pre-designed presentation templates that are perfect for a wide range of topic. Our vast selection of designs covers a range of styles, from creative to business, and are all highly customizable and easy to edit. Download as a PowerPoint template or use them as Google Slides themes.
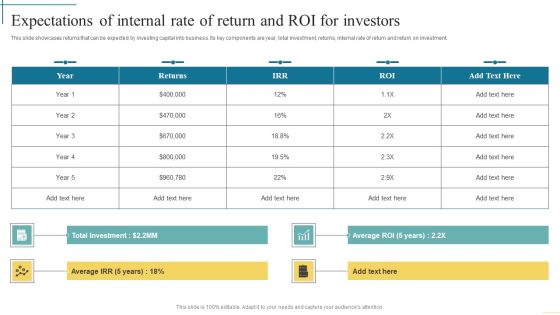
Expectations Of Internal Rate Of Return And Roi For Investors Developing Fundraising Techniques Mockup PDF
This slide showcases graphs that can help organization to evaluate the survival rate of startups that raised capital through angel investors. It showcases graph of startup survival rates and survival rate of business by industry . Want to ace your presentation in front of a live audience Our Expectations Of Internal Rate Of Return And Roi For Investors Developing Fundraising Techniques Mockup PDF can help you do that by engaging all the users towards you. Slidegeeks experts have put their efforts and expertise into creating these impeccable powerpoint presentations so that you can communicate your ideas clearly. Moreover, all the templates are customizable, and easy-to-edit and downloadable. Use these for both personal and commercial use.
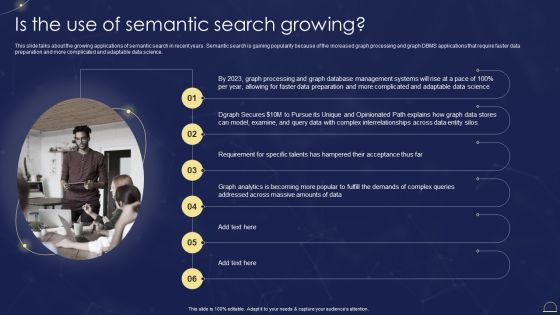
Semantic Web Technologies Is The Use Of Semantic Search Growing Microsoft PDF
This slide talks about the growing applications of semantic search in recent years. Semantic search is gaining popularity because of the increased graph processing and graph DBMS applications that require faster data preparation and more complicated and adaptable data science. Do you have an important presentation coming up Are you looking for something that will make your presentation stand out from the rest Look no further than Semantic Web Technologies Is The Use Of Semantic Search Growing Microsoft PDF. With our professional designs, you can trust that your presentation will pop and make delivering it a smooth process. And with Slidegeeks, you can trust that your presentation will be unique and memorable. So why wait Grab Semantic Web Technologies Is The Use Of Semantic Search Growing Microsoft PDF today and make your presentation stand out from the rest.
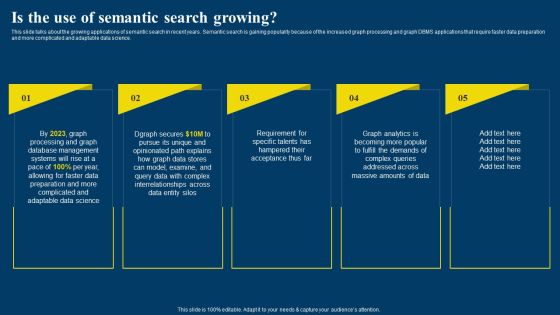
Semantic Web Business Framework Advantages IT Is The Use Of Semantic Search Growing Information PDF
This slide talks about the growing applications of semantic search in recent years. Semantic search is gaining popularity because of the increased graph processing and graph DBMS applications that require faster data preparation and more complicated and adaptable data science. Welcome to our selection of the Semantic Web Business Framework Advantages IT Is The Use Of Semantic Search Growing Information PDF. These are designed to help you showcase your creativity and bring your sphere to life. Planning and Innovation are essential for any business that is just starting out. This collection contains the designs that you need for your everyday presentations. All of our PowerPoints are 100 percent editable, so you can customize them to suit your needs. This multi-purpose template can be used in various situations. Grab these presentation templates today.

Semantic Web Fundamentals Is The Use Of Semantic Search Growing Topics PDF
This slide talks about the growing applications of semantic search in recent years. Semantic search is gaining popularity because of the increased graph processing and graph DBMS applications that require faster data preparation and more complicated and adaptable data science. Do you have to make sure that everyone on your team knows about any specific topic I yes, then you should give Semantic Web Fundamentals Is The Use Of Semantic Search Growing Topics PDF a try. Our experts have put a lot of knowledge and effort into creating this impeccable Semantic Web Fundamentals Is The Use Of Semantic Search Growing Topics PDF. You can use this template for your upcoming presentations, as the slides are perfect to represent even the tiniest detail. You can download these templates from the Slidegeeks website and these are easy to edit. So grab these today.

Semantic Data Searching Technique Is The Use Of Semantic Search Growing Template PDF
This slide talks about the growing applications of semantic search in recent years. Semantic search is gaining popularity because of the increased graph processing and graph DBMS applications that require faster data preparation and more complicated and adaptable data science. Want to ace your presentation in front of a live audience Our Semantic Data Searching Technique Is The Use Of Semantic Search Growing Template PDF can help you do that by engaging all the users towards you. Slidegeeks experts have put their efforts and expertise into creating these impeccable powerpoint presentations so that you can communicate your ideas clearly. Moreover, all the templates are customizable, and easy to edit and downloadable. Use these for both personal and commercial use.

Enterprise Information Web Standards Is The Use Of Semantic Search Growing Template PDF
This slide talks about the growing applications of semantic search in recent years. Semantic search is gaining popularity because of the increased graph processing and graph DBMS applications that require faster data preparation and more complicated and adaptable data science. Want to ace your presentation in front of a live audience Our Enterprise Information Web Standards Is The Use Of Semantic Search Growing Template PDF can help you do that by engaging all the users towards you. Slidegeeks experts have put their efforts and expertise into creating these impeccable powerpoint presentations so that you can communicate your ideas clearly. Moreover, all the templates are customizable, and easy to edit and downloadable. Use these for both personal and commercial use.

Global Business Finance PowerPoint Templates And PowerPoint Themes 0512
Global Business Finance PowerPoint Templates And PowerPoint Themes 0512-Microsoft Powerpoint Templates and Background with business graph success-These high quality PowerPoint templates and PowerPoint images are carefully selected by our team of professionals to convey your ideas in a visually appealing manner. Each download contains a text and print slide. The text and print slides show up automatically when you insert a new slide in the downloaded template

Business Graphic PowerPoint Templates Business Stacked Bar Chart Ppt Slides
Business Graphic PowerPoint Templates Business stacked bar chart PPT Slides-You can use a 100% stacked column chart when you have three or more data series and you want to emphasize the contributions to the whole, especially if the total is the same for each category. . -Business Graphic PowerPoint Templates Business stacked bar chart PPT Slides-This ppt can be used for concepts relating to-Bar, Block, Business, Chart, Color, Colour, Column, Decline, Fill, Finance, Financial, Graph etc.

Business Marketing PowerPoint Templates Business Five Linked Chains Ppt Slides
Business Marketing PowerPoint Templates Business five linked chains PPT Slides-Linear process flow diagram is useful to visualize current projects within a certain time or periodical section-Business Marketing PowerPoint Templates Business five linked chains PPT Slides-This ppt can be used for concepts relating to-Abstract, Algorithm, Arrow, Arrow, Chart, Block, Block, Diagram, Business, Chart, Color, Connection, Design, Development, Diagram, Direction, Element, Flow, Flow, Chart, Flow, Diagram, Flowchart, Graph etc
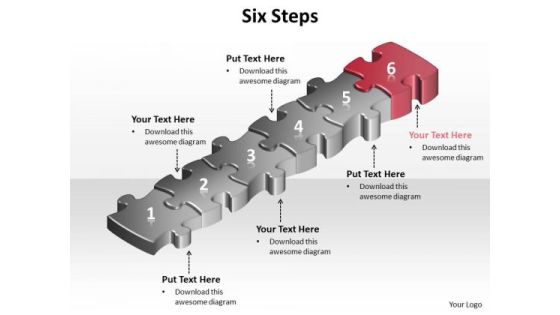
Ppt Red Layouts PowerPoint 2003 Jigsaw Puzzle 2010 Step Templates
PPT red layouts PowerPoint 2003 jigsaw puzzle 2010 step Templates-Use this Business based PowerPoint Diagram to represent the Business issues Graphically. It indicates arrange, block out, blueprint, cast, delineate, design, devise, draft, graph , lay out, outline, plot, project, shape, sketch etc.-PPT red layouts PowerPoint 2003 jigsaw puzzle 2010 step Templates-achievement, activity, adversity, bridge, built, business, cartoon, challenge, character, computer, concept, construction, creativity, decisions, figure, games, goal, graphic, icon, idea, intelligence, organization, people, planning, problems, puzzle, solution, stick, strategy, success

Digital Illustration Of Dollar Finance PowerPoint Templates And PowerPoint Themes 1012
Create visually stunning and define your PPT Presentations in a unique and inspiring manner using our above template which contains a 3d graph of dollar symbol money. This image represents the concept of business growth and success. It is a useful captivating tool concieved to enable you to define your message in your business PPT presentations on economy, finance and marketing. Create captivating presentations to deliver comparative and weighted arguments.

7 Stages Diverging Arrows Schematic Diagram Ppt Charts And Networks PowerPoint Slides
We present our 7 stages diverging arrows schematic diagram ppt Charts and Networks PowerPoint Slides.Download our Marketing PowerPoint Templates because Our PowerPoint Templates and Slides are Clear and concise. Use them and dispel any doubts your team may have. Download and present our Shapes PowerPoint Templates because You can Connect the dots. Fan expectations as the whole picture emerges. Present our Arrows PowerPoint Templates because this Slide offers an excellent background to build up the various stages of your business process. Use our Business PowerPoint Templates because you have analysed many global markets and come up with possibilities. Highlight the pros and cons of other likely business oppurtunities. Download and present our Process and Flows PowerPoint Templates because spreading the light of knowledge around you will clear the doubts and enlighten the questioning minds with your brilliance and ability.Use these PowerPoint slides for presentations relating to Arrows, Business, Chart, Cyclic, Data, Diagram, Financial, Goal, Graph, Illustration, Info, Information, Marketing, Model, Option, Part, Pie, Presentation, Process, Result, Sphere, Statistics. The prominent colors used in the PowerPoint template are Yellow, Gray, Black. The feedback we get is that our 7 stages diverging arrows schematic diagram ppt Charts and Networks PowerPoint Slides are Breathtaking. People tell us our Graph PowerPoint templates and PPT Slides are Splendid. Presenters tell us our 7 stages diverging arrows schematic diagram ppt Charts and Networks PowerPoint Slides are Functional. Use our Graph PowerPoint templates and PPT Slides will make the presenter successul in his career/life. Use our 7 stages diverging arrows schematic diagram ppt Charts and Networks PowerPoint Slides are visually appealing. Use our Graph PowerPoint templates and PPT Slides are Dynamic.

2013 Business Growth Year Finance PowerPoint Templates Ppt Backgrounds For Slides 1212
We present our 2013 Business Growth Year Finance PowerPoint Templates PPT Backgrounds For Slides 1212.Download and present our Arrows PowerPoint Templates because there is a key aspect to be emphasised. Use our Finance PowerPoint Templates because your fledgling career is in the chrysallis stage. Nurture it and watch it grow into a beautiful butterfly. Use our Business PowerPoint Templates because this is the unerring accuracy in reaching the target. the effortless ability to launch into flight. Use our New year PowerPoint Templates because You can safely bank on our PowerPoint Templates and Slides. They will provide a growth factor to your valuable thoughts. Present our Success PowerPoint Templates because iT outlines the entire thought process for the benefit of others. Tell it to the world with your characteristic aplomb.Use these PowerPoint slides for presentations relating to 2013 success bar graph, Arrows, Finance, Business, New year, Success. The prominent colors used in the PowerPoint template are Green, Blue, Blue light. You can be sure our 2013 Business Growth Year Finance PowerPoint Templates PPT Backgrounds For Slides 1212 are Reminiscent. We assure you our graph PowerPoint templates and PPT Slides are readymade to fit into any presentation structure. Use our 2013 Business Growth Year Finance PowerPoint Templates PPT Backgrounds For Slides 1212 are Quaint. Customers tell us our graph PowerPoint templates and PPT Slides provide you with a vast range of viable options. Select the appropriate ones and just fill in your text. Use our 2013 Business Growth Year Finance PowerPoint Templates PPT Backgrounds For Slides 1212 are Awesome. The feedback we get is that our graph PowerPoint templates and PPT Slides are Charming.
 Home
Home