Errc Graph

SLA KPL Dashboard Indicating Compliance Priority With KPI Ppt File Format PDF
This graph or chart is linked to excel, and changes automatically based on data. Just left click on it and select Edit Data. Showcasing this set of slides titled SLA KPL Dashboard Indicating Compliance Priority With KPI Ppt File Format PDF. The topics addressed in these templates are KPI Graph, Insights Here, SLA Compliance Priority. All the content presented in this PPT design is completely editable. Download it and make adjustments in color, background, font etc. as per your unique business setting.

Customer Relationship Management Tasks And Deals Status Dashboard Background PDF
This slide illustrates graphical representation of status report of tasks and deals related to CRM statistical data. It includes total deals graph, total tasks graph etc. Showcasing this set of slides titled Customer Relationship Management Tasks And Deals Status Dashboard Background PDF. The topics addressed in these templates are Invitation, Team Member, Customer Relationship Management. All the content presented in this PPT design is completely editable. Download it and make adjustments in color, background, font etc. as per your unique business setting.
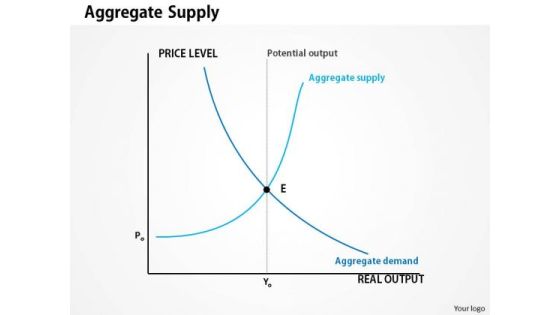
Business Framework Aggregate Supply PowerPoint Presentation
This diagram displays graph of aggregate supply. Aggregate supply is the total value of the goods and services produced. Use this diagram to present information in the visual manner.
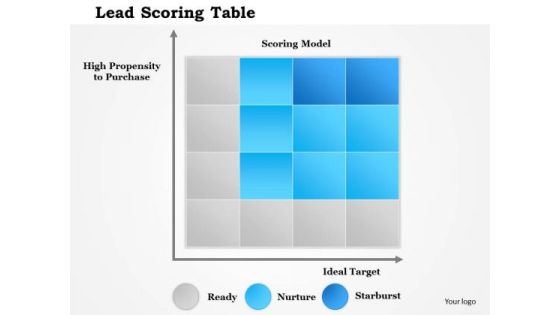
Business Framework Lead Scoring Table PowerPoint Presentation
A graph style cubical chart has been used to decorate this power point template slide. This PPT slide contains the concept of explaining score. Use this score table for displaying any data.
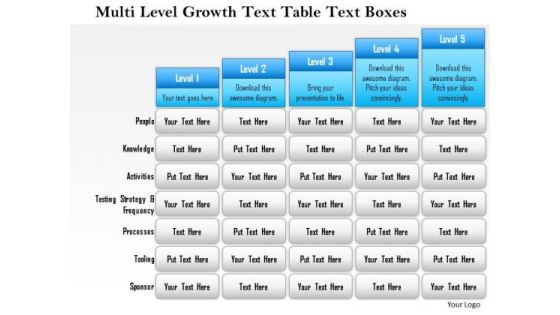
Business Framework Multi Level Growth Text Table Text Boxes 2 PowerPoint Presentation
Five staged text box style chart in bar graph design has been used to decorate this power point template slide. This diagram slide contains the multilevel growth concept. Use this PPT slide for financial growth and result analysis related topics.

Business Framework Solow Growth PowerPoint Presentation
This Power Point template slide has been designed with two level graph with multiple points. This PPT slide contains the Solow growth. Use this PPT template for business and finance related presentations.
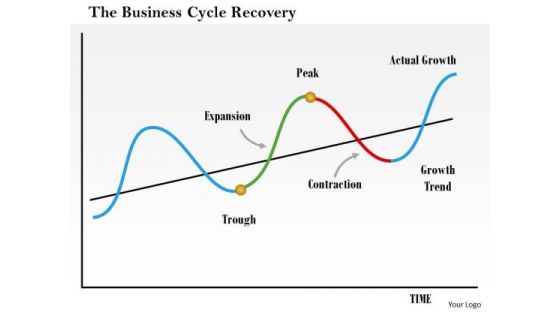
Business Framework The Business Cycle Recovery PowerPoint Presentation
A unidirectional process cycle graph has been used to crafted this Power Point template slide. This PPT slide contains the concept of recovery with high and low nodes. Use this PPT slide and build presentations for your business topics.
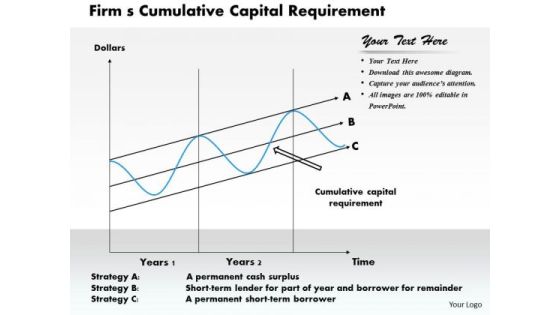
Business Framework Firm S Cumulative Capital Requirement PowerPoint Presentation
This business framework PPT has been crafted with graphic of graph with multiple stages. This PPT diagram contains the concept of firm s- cumulative capital requirements. Use this PPT diagram for your business and management related presentations.

Business Framework Battery Charge Loading Bar PowerPoint Presentation
This business diagram displays bar graph of five battery cells. This business slide contains the concept of business growth shown in multiple levels. Use this diagram to present and compare data in an impressive manner.
Green Arrows On Bars Vector Icon Ppt PowerPoint Presentation Infographic Template Templates Cpb
This is a green arrows on bars vector icon ppt powerpoint presentation infographic template templates cpb. This is a three stage process. The stages in this process are bar chart icon, bar graph icon, data chart icon.
Histogram Column Chart With Red Arrow Vector Icon Ppt PowerPoint Presentation Outline Ideas Cpb
This is a histogram column chart with red arrow vector icon ppt powerpoint presentation outline ideas cpb. This is a three stage process. The stages in this process are bar chart icon, bar graph icon, data chart icon.
Histogram Financial Analysis Vector Icon Ppt PowerPoint Presentation Layouts File Formats Cpb
This is a histogram financial analysis vector icon ppt powerpoint presentation layouts file formats cpb. This is a three stage process. The stages in this process are bar chart icon, bar graph icon, data chart icon.
Histogram Icon Showing Economic Fluctuations Ppt PowerPoint Presentation Slides Samples Cpb
This is a histogram icon showing economic fluctuations ppt powerpoint presentation slides samples cpb. This is a three stage process. The stages in this process are bar chart icon, bar graph icon, data chart icon.
Histogram Showing Business Trends Vector Icon Ppt PowerPoint Presentation Styles Portrait Cpb
This is a histogram showing business trends vector icon ppt powerpoint presentation styles portrait cpb. This is a three stage process. The stages in this process are bar chart icon, bar graph icon, data chart icon.
Histogram With Dollar For Financial Success Vector Icon Ppt PowerPoint Presentation Portfolio Example File Cpb
This is a histogram with dollar for financial success vector icon ppt powerpoint presentation portfolio example file cpb. This is a three stage process. The stages in this process are bar chart icon, bar graph icon, data chart icon.
Histogram With Gear Vector Icon Ppt PowerPoint Presentation Professional Slides Cpb
This is a histogram with gear vector icon ppt powerpoint presentation professional slides cpb. This is a three stage process. The stages in this process are bar chart icon, bar graph icon, data chart icon.
Three Bars For Financial Analysis Vector Icon Ppt PowerPoint Presentation Pictures Background Cpb
This is a three bars for financial analysis vector icon ppt powerpoint presentation pictures background cpb. This is a three stage process. The stages in this process are bar chart icon, bar graph icon, data chart icon.
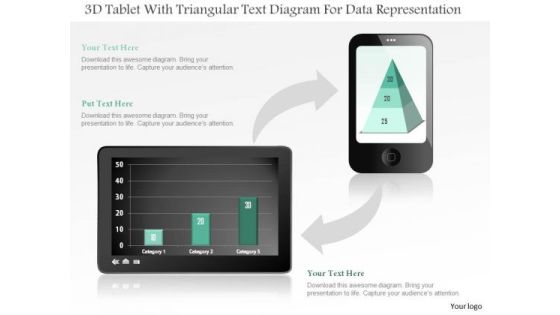
Business Diagram 3d Tablet With Triangular Text Diagram For Data Representation PowerPoint Slide
This business diagram displays bar graph on tablet and pyramid chart on mobile phone. Use this diagram, to make reports for interactive business presentations. Create professional presentations using this diagram.

Business Diagram Data Driven Pie Chart Inside The Magnifier PowerPoint Slide
This business slide displays 3d colorful pie graph with magnifier. This diagram is a data visualization tool that gives you a simple way to present statistical information. This slide helps your audience examine and interpret the data you present.
Business Diagram Human Icons With Bubbles And Different Icons Inside PowerPoint Slide
This diagram displays graph with percentage value growth. This business slide is suitable to present and compare business data. Use this diagram to build professional presentations for your viewers.

Business Diagram Four Steps With 3d Business Person Standing Over It PowerPoint Slide
This business diagram displays bar graph with business person standing on it. This Power Point template has been designed to display personal growth. You may use this diagram to impart professional appearance to your presentations.

Planning Business PowerPoint Template 0910
Business charts and graphs for a successful corporation or company
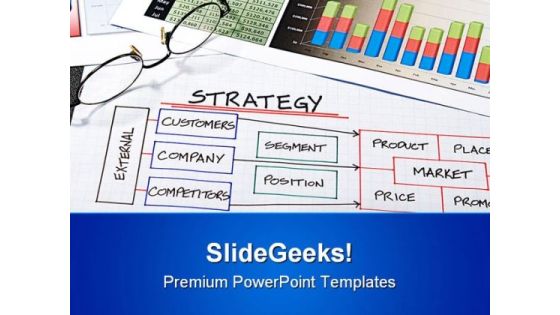
Bus Chart Business PowerPoint Template 1010
Business strategy organizational charts and graphs for success

Pie Chart06 Business PowerPoint Templates And PowerPoint Backgrounds 0611
Microsoft PowerPoint Template and Background with business people and graphs

Pie Chart01 Business PowerPoint Templates And PowerPoint Backgrounds 1211
Microsoft PowerPoint Template and Background with pie graphs

Pie Chart Business PowerPoint Templates And PowerPoint Backgrounds 1211
Microsoft PowerPoint Template and Background with pie graphs
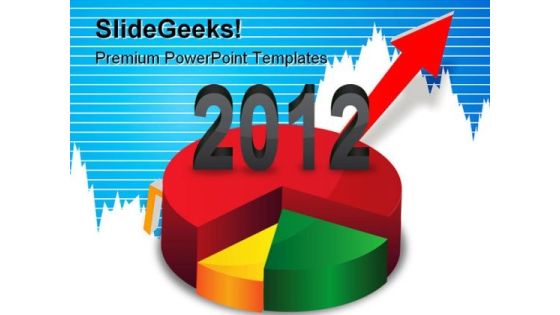
Pie Chart Growth 2012 Business PowerPoint Templates And PowerPoint Backgrounds 1211
Microsoft PowerPoint Template and Background with business pie graphs
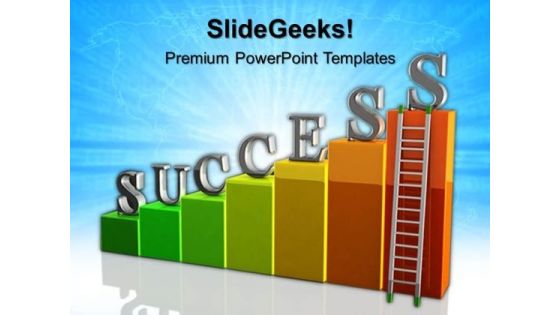
Growth Ladder Success PowerPoint Templates And PowerPoint Themes 0512
Microsoft Powerpoint Templates and Background with color bar graph with ladder-Growth Ladder Success PowerPoint Templates And PowerPoint Themes 0512-These PowerPoint designs and slide layouts can be used for themes relating to -Growth ladder success, abstract, background, business, marketing, finance

Growth Business PowerPoint Templates And PowerPoint Themes 0512
Microsoft Powerpoint Templates and Background with color bar graph with ladder-These templates can be used for presentations relating to-Growth ladder success, abstract, ladder, business, marketing, finance-Growth Business PowerPoint Templates And PowerPoint Themes 0512
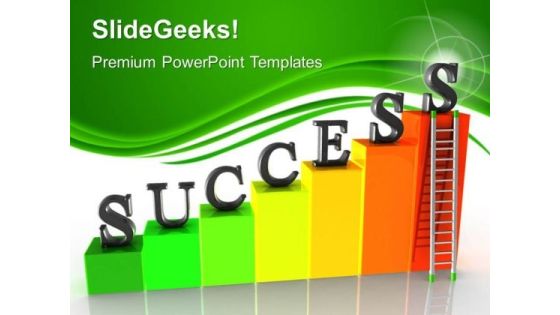
Growth Success PowerPoint Templates And PowerPoint Themes 0512
Microsoft Powerpoint Templates and Background with color bar graph with ladder-These templates can be used for presentations relating to-Growth ladder success, abstract, ladder, business, marketing, finance-Growth Success PowerPoint Templates And PowerPoint Themes 0512

0814 Bargraph Of Dollars Bundles With Arrow Graphic Image Graphics For PowerPoint
This unique image has backdrop of bar graph of dollars bundles with growth arrow. This image displays the concept of financial growth. Define the business growth with this suitable image. Use this image to make outstanding presentations
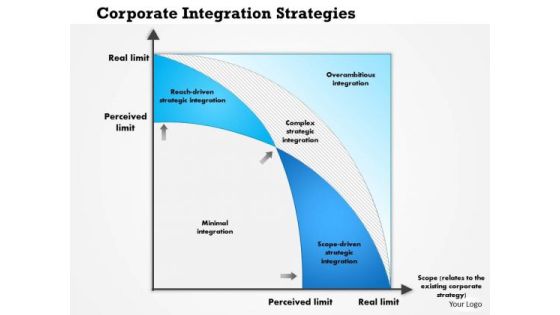
Business Framework Corporate Integration Strategies PowerPoint Presentation
This innovative image slide has been designed to display graph for corporate integration strategies. This business framework template may be used to display corporate strategy management in your presentations. This image slide will enhance the quality of your presentations.

Business Framework Portfolio Risk 01 PowerPoint Presentation
This business framework image slide displays portfolio risk graph PowerPoint template. Use this image slide, in your presentations to depict portfolio risk measures like number of stocks and returns. Make your presentations outshine using this image slide.
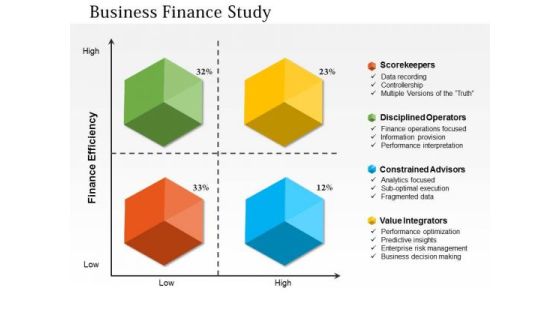
Business Diagram Business Finance Study PowerPoint Ppt Presentation
Our above slide displays business finance study diagram. It contains x-y graph of finance efficiency further divided into four sections. This diagram reflects finance efficiency depends on storekeepers, disciplined operators, constrained advisors and value integrators.
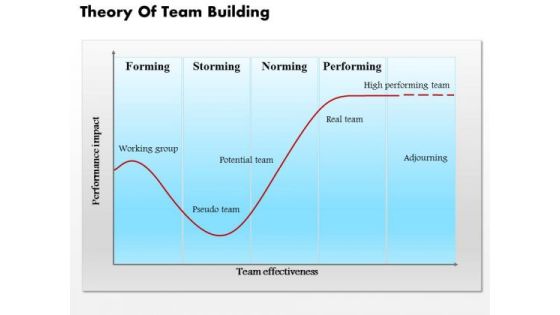
Business Diagram Theory Of Team Building PowerPoint Ppt Presentation
This slide depicts theory of tem building. It contains graph of performance impact and team effectiveness. It reflects steps of team building forming, storming, norming and performing. Download this awesome diagram to capture your audience
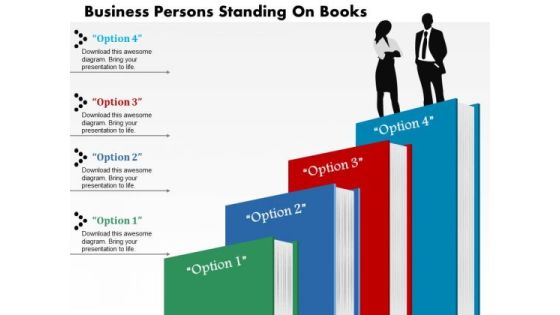
Business Diagram Persons Standing On Books Presentation Slide Template
This power point diagram template has been crafted with graphic of bar graph made with books and 3d man. This diagram template contains the concept of education and success. Use this diagram slide for your business and education presentation.
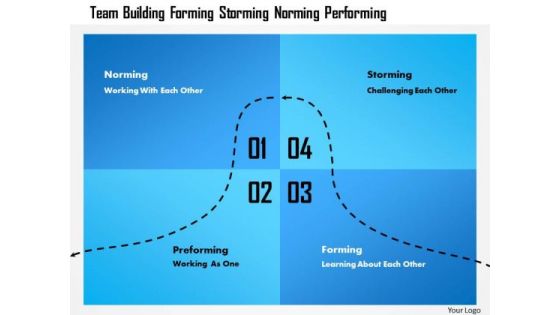
Business Framework Team Building Forming Storming Norming Performing PowerPoint Presentation
This slide depicts theory of team building. It contains graph of performance impact and team effectiveness. It reflects steps of team building forming, storming, norming and performing. Download this awesome diagram to capture your audiences attention.
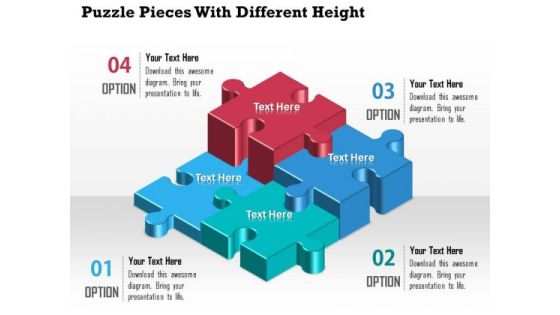
Business Diagram Puzzle Pieces With Different Height Presentation Template
A professional bar graph has been crafted with graphic of puzzles. All these puzzles are in different heights which shows the various levels of any data result representations. Use this diagram for your business result and data analysis related topics.
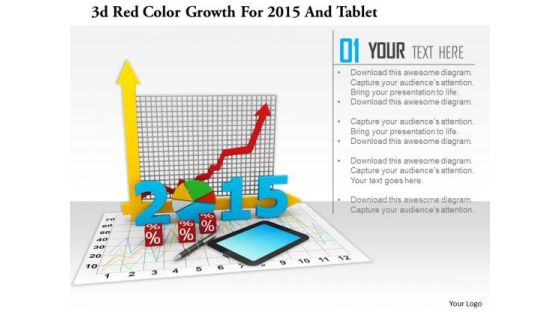
Stock Photo 3d Red Color Growth For 2015 And Tablet PowerPoint Slide
This image slide has graphics of financial charts and reports. This contains bar graph and pie chart to present business reports. Build an innovative presentation using this professional image slide.

Stock Photo 3d Us Map With Growth Arrow And Us Map PowerPoint Slide
This image displays American map with business graph in background. This image slide contains the concept of American economy, business growth and reports. Use this amazing slide to make professional presentations.
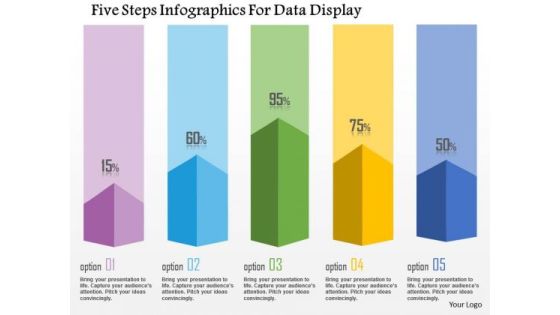
Business Diagram Five Steps Infographics For Data Display Presentation Template
This business diagram has been designed with graphic of five staged info graphics. This diagram can be used to display statistical information. Use this bar graph for your business and sales related presentations.
Globe With Bars And Business Icons Powerpoint Templates
Bar graph with globe for statistical analysis has been displayed in this business slide. This business diagram helps to exhibit global statistical analysis and research. Use this diagram to build an exclusive presentation.

About Us Companys Data Information Powerpoint Slides
Download this PowerPoint template to create an attention grabbing introductory slide. It contains slide bar graph with employee image. Use this professional slide design to build a good reputation of your company.

Bar Chart For Strategic Planning Powerpoint Slides
This PowerPoint template has been designed with bar graph with two teams. This diagram is useful to exhibit strategic planning. This diagram slide can be used to make impressive presentations.
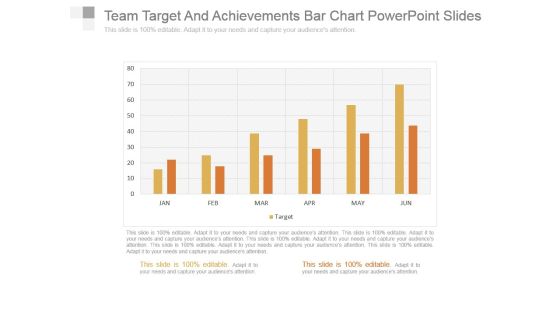
Team Target And Achievements Bar Chart Powerpoint Slides
This is a team target and achievements bar chart powerpoint slides. This is a six stage process. The stages in this process are business, success, graph chart, strategy, marketing.
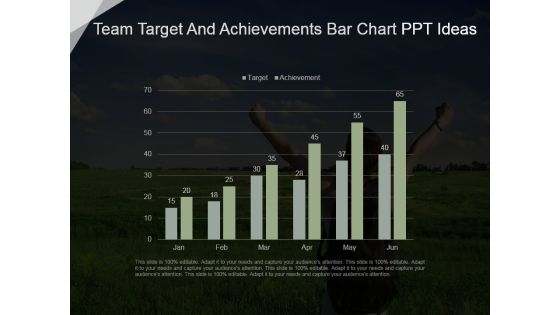
Team Target And Achievements Bar Chart Ppt Ideas
This is a team target and achievements bar chart ppt ideas. This is a six stage process. The stages in this process are business, marketing, graph chart, success, strategy.

Human Resources Planning Development Methods Ppt PowerPoint Presentation Complete Deck With Slides
This is a human resources planning development methods ppt powerpoint presentation complete deck with slides. This is a one stage process. The stages in this process are finance, data analysis, graph representation, planning, process.

Crm Planning And Implementation Procedures And Practices PPT PowerPoint Presentation Complete Deck With Slides
This is a crm planning and implementation procedures and practices ppt powerpoint presentation complete deck with slides. This is a one stage process. The stages in this process are finance, success, process, planning, graph analysis.

Data And Analytics Ppt PowerPoint Presentation Styles Outline
This is a data and analytics ppt powerpoint presentation styles outline. This is a ten stage process. The stages in this process are agile data science, graph analytics, journey sciences.

Data And Analytics Ppt PowerPoint Presentation Gallery Graphics Pictures
This is a data and analytics ppt powerpoint presentation gallery graphics pictures. This is a ten stage process. The stages in this process are graph analytics, journey sciences, augmented reality, hyper personalisation, behavioural analytics.
Data And Analytics Planning Ppt PowerPoint Presentation Model Icon
This is a data and analytics planning ppt powerpoint presentation model icon. This is a ten stage process. The stages in this process are graph analytics, journey sciences, augmented reality, hyper personalisation, behavioural analytics.

Business Marketing PowerPoint Templates Business Pyramid Stacked Column Chart Ppt Slides
Business Marketing PowerPoint Templates Business pyramid stacked column chart PPT Slides-This PowerPoint slide has a stacked pyramid chart that looks elegant because of the pyramid shape and the unique angle in which it appears. . This graph is data driven. Business Marketing PowerPoint Templates Business pyramid stacked column chart PPT Slides-This ppt can be used for concepts relating to-3d, 3d-Pie, Area, Bar, Block, Business, Chart, Color, Colour, Column, Cone, Decline, Fill, Finance, Financial, Gradient, Graph, etc.

Subordinated Loan Funding Funding And Valuation History Of The Company Ppt File Graphics Template PDF
The slide provides the graph of companys funding details. Graph includes he funding amount in dollar MM and the valuation of the company in Dollar MM after each funding round.Deliver and pitch your topic in the best possible manner with this subordinated loan funding funding and valuation history of the company ppt file graphics template pdf. Use them to share invaluable insights on funding and valuation history of the company. and impress your audience. This template can be altered and modified as per your expectations. So, grab it now.
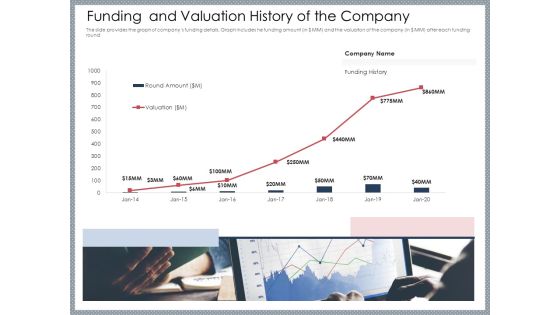
Mezzanine Venture Capital Funding Pitch Deck Funding And Valuation History Of The Company Microsoft PDF
The slide provides the graph of companys funding details. Graph includes he funding amount in MM and the valuation of the company in MM after each funding round. Deliver and pitch your topic in the best possible manner with this mezzanine venture capital funding pitch deck funding and valuation history of the company microsoft pdf. Use them to share invaluable insights on company, history, funding, valuation and impress your audience. This template can be altered and modified as per your expectations. So, grab it now.

Post COVID Recovery Strategy Oil Gas Industry Crude Oil Price Recovery After COVID Crises Guidelines PDF
This slide covers the crude oil price recovery which will takes place as a U-shaped recovery along with the graph and key insights of the graph which will showcase the WTI oil details. Deliver and pitch your topic in the best possible manner with this post covid recovery strategy oil gas industry crude oil price recovery after covid crises guidelines pdf. Use them to share invaluable insights on global, growth, price and impress your audience. This template can be altered and modified as per your expectations. So, grab it now.

Hybrid Investment Pitch Deck Funding And Valuation History Of The Company Ppt Slides Deck PDF
The slide provides the graph of companys funding details. Graph includes he funding amount in MM and the valuation of the company in MM after each funding round. Deliver an awe inspiring pitch with this creative hybrid investment pitch deck funding and valuation history of the company ppt slides deck pdf bundle. Topics like funding and valuation history of the company can be discussed with this completely editable template. It is available for immediate download depending on the needs and requirements of the user.
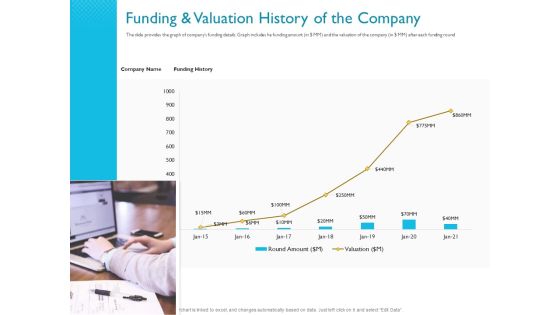
Investor Funding Deck For Hybrid Financing Funding And Valuation History Of The Company Ppt Styles Brochure PDF
The slide provides the graph of companys funding details. Graph includes he funding amount in dollar MM and the valuation of the company in dollar MM after each funding round. Deliver and pitch your topic in the best possible manner with this investor funding deck for hybrid financing funding and valuation history of the company ppt styles brochure pdf. Use them to share invaluable insights on round amount, valuation, funding history and impress your audience. This template can be altered and modified as per your expectations. So, grab it now.
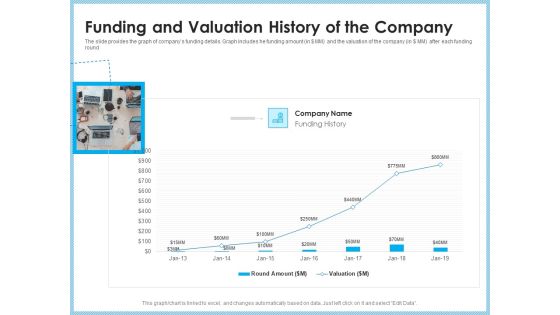
Investment Pitch To Generating Capital From Mezzanine Credit Funding And Valuation History Of The Company Rules PDF
The slide provides the graph of companys funding details. Graph includes he funding amount in dollar MM and the valuation of the company in dollar MM after each funding round. Deliver and pitch your topic in the best possible manner with this investment pitch to generating capital from mezzanine credit funding and valuation history of the company rules pdf. Use them to share invaluable insights on round amount, valuation and impress your audience. This template can be altered and modified as per your expectations. So, grab it now.

Investor Pitch Deck To Collect Capital From Subordinated Loan Funding And Valuation History Of The Company Template PDF
The slide provides the graph of companys funding details. Graph includes he funding amount in dollar MM and the valuation of the company in dollar MM after each funding round. Deliver an awe-inspiring pitch with this creative investor pitch deck to collect capital from subordinated loan funding and valuation history of the company template pdf bundle. Topics like funding history, round amount, valuation can be discussed with this completely editable template. It is available for immediate download depending on the needs and requirements of the user.
Funding And Valuation History Of The Company Ppt Icon Show PDF
The slide provides the graph of companys funding details. Graph includes he funding amount in dollar MM and the valuation of the company in dollar MM after each funding round. Deliver and pitch your topic in the best possible manner with this funding and valuation history of the company ppt icon show pdf. Use them to share invaluable insights on funding and valuation history of the company and impress your audience. This template can be altered and modified as per your expectations. So, grab it now.
 Home
Home