Errc Graph

Bar Chart Ppt PowerPoint Presentation Summary File Formats
This is a bar chart ppt powerpoint presentation summary file formats. This is a two stage process. The stages in this process are business, finance, financial years, sales in percentage, graph.

Column Chart Ppt PowerPoint Presentation Layouts Graphic Images
This is a column chart ppt powerpoint presentation layouts graphic images. This is a two stage process. The stages in this process are business, finance, years, graph, expenditure in, marketing.

Bar Chart Ppt PowerPoint Presentation Model Sample
This is a bar chart ppt powerpoint presentation model sample. This is a two stage process. The stages in this process are sales in percentage, business, marketing, graph, percentage, year.

Balance Sheet Kpis Ppt PowerPoint Presentation Infographic Template Designs
This is a balance sheet kpis ppt powerpoint presentation infographic template designs. This is a four stage process. The stages in this process are business, marketing, finance, graph, strategy.
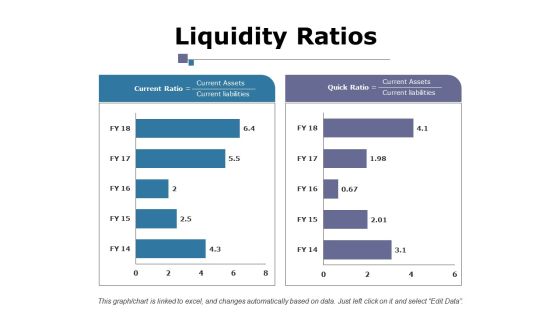
Liquidity Ratios Ppt PowerPoint Presentation Layouts Example File
This is a liquidity ratios ppt powerpoint presentation layouts example file. This is a two stage process. The stages in this process are business, current ratio, quick ratio, marketing, finance, graph.
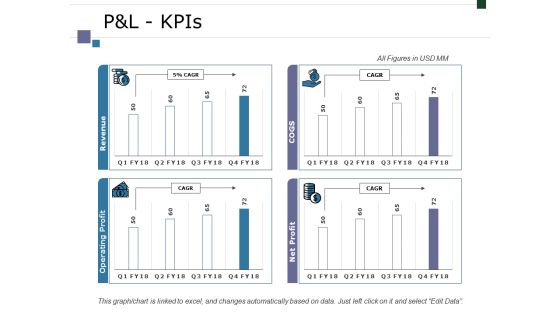
Pandl Kpis Ppt PowerPoint Presentation Infographic Template Graphics Tutorials
This is a pandl kpis ppt powerpoint presentation infographic template graphics tutorials. This is a four stage process. The stages in this process are business, marketing, finance, graph, strategy.

Clustered Column Line Ppt PowerPoint Presentation Topics
This is a clustered column line ppt powerpoint presentation topics. This is a three stage process. The stages in this process are product, in percentage, growth, bar graph, business.

Column Chart Ppt PowerPoint Presentation Infographics Guidelines
This is a column chart ppt powerpoint presentation infographics guidelines. This is a two stage process. The stages in this process are product, expenditure in, years, business, bar graph.

Clustered Bar Ppt PowerPoint Presentation Styles Graphics
This is a clustered bar ppt powerpoint presentation styles graphics. This is a three stage process. The stages in this process are business, marketing, finance, graph, strategy, unit count.

Column Chart Ppt PowerPoint Presentation Show Structure
This is a column chart ppt powerpoint presentation show structure. This is a two stage process. The stages in this process are business, financial year in, sales in percentage, marketing, graph.
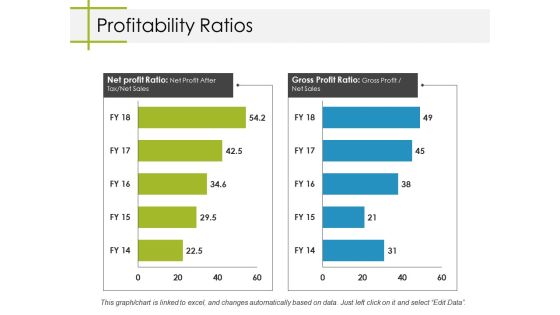
Profitability Ratios Ppt PowerPoint Presentation Inspiration Information
This is a profitability ratios ppt powerpoint presentation inspiration information. This is a two stage process. The stages in this process are business, net profit ratio, gross profit ratio, marketing, graph.
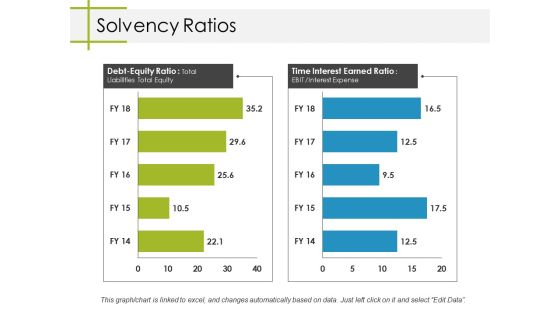
Solvency Ratios Ppt PowerPoint Presentation Professional Rules
This is a solvency ratios ppt powerpoint presentation professional rules. This is a two stage process. The stages in this process are business, marketing, debt equity ratio, time interest earned ratio, graph.

Cash Flow Statement Kpis Ppt PowerPoint Presentation Pictures Graphics
This is a cash flow statement kpis ppt powerpoint presentation pictures graphics. This is a four stage process. The stages in this process are business, marketing, graph, finance, strategy.

Clustered Bar Ppt PowerPoint Presentation Pictures Clipart Images
This is a clustered bar ppt powerpoint presentation pictures clipart images. This is a three stage process. The stages in this process are business, marketing, graph, finance, strategy, unit count.

Profitability Ratios Ppt PowerPoint Presentation Summary Outline
This is a profitability ratios ppt powerpoint presentation summary outline. This is a two stage process. The stages in this process are business, net profit ratio, gross profit ratio, marketing, graph.

Stacked Line With Markers Ppt PowerPoint Presentation Pictures Design Templates
This is a stacked line with markers ppt powerpoint presentation pictures design templates. This is a one stage process. The stages in this process are business, marketing, finance, in million, graph.

P And L Kpis Tabular Form Ppt PowerPoint Presentation Pictures Gallery
This is a p and l kpis tabular form ppt powerpoint presentation pictures gallery. This is a four stage process. The stages in this process are business, marketing, graph, strategy, finance.

Column Chart Ppt PowerPoint Presentation Layouts Vector
This is a column chart ppt powerpoint presentation layouts vector. This is a two stage process. The stages in this process are product, column chart, bar graph, percentage, finance.

Area Chart Ppt PowerPoint Presentation Infographics Graphics Pictures
This is a area chart ppt powerpoint presentation infographics graphics pictures. This is a two stage process. The stages in this process are business, sales in percentage, area chart, marketing, graph.

Balance Sheet Kpis Template 1 Ppt PowerPoint Presentation Show Inspiration
This is a balance sheet kpis template 1 ppt powerpoint presentation show inspiration. This is a four stage process. The stages in this process are business, marketing, graph, current liabilities, total liabilities.

Balance Sheet Kpis Template 2 Ppt PowerPoint Presentation Gallery Example
This is a balance sheet kpis template 2 ppt powerpoint presentation gallery example. This is a four stage process. The stages in this process are business, marketing, graph, current liabilities, total liabilities.

Competitor Comparison Template 1 Ppt PowerPoint Presentation Infographic Template Mockup
This is a competitor comparison template 1 ppt powerpoint presentation infographic template mockup. This is a five stage process. The stages in this process are business, marketing, graph, finance, strategy.

Competitor Comparison Template 2 Ppt PowerPoint Presentation Infographics Objects
This is a competitor comparison template 2 ppt powerpoint presentation infographics objects. This is a five stage process. The stages in this process are business, marketing, graph, finance, strategy.

Competitor Market Share And Sales Revenues Ppt PowerPoint Presentation Summary Influencers
This is a competitor market share and sales revenues ppt powerpoint presentation summary influencers. This is a four stage process. The stages in this process are business, marketing, graph, finance, strategy.

Combo Chart Ppt PowerPoint Presentation Pictures Summary
This is a combo chart ppt powerpoint presentation pictures summary. This is a three stage process. The stages in this process are product, market size, growth rate, bar graph, success.

Competitor Comparison Template 1 Ppt PowerPoint Presentation Layouts Slide Portrait
This is a competitor comparison template 1 ppt powerpoint presentation layouts slide portrait. This is a four stage process. The stages in this process are business, marketing, graph, finance, strategy.

Competitor Comparison Template 2 Ppt PowerPoint Presentation Inspiration Images
This is a competitor comparison template 2 ppt powerpoint presentation inspiration images. This is a five stage process. The stages in this process are business, marketing, graph, finance, strategy.

Summary Financials Wc Analysis Roce Roe Ppt PowerPoint Presentation Ideas Rules
This is a summary financials wc analysis roce roe ppt powerpoint presentation ideas rules. This is a two stage process. The stages in this process are business, marketing, working capital analysis, roce and roe, graph.

Revenue Split By Product Segment Template 2 Ppt PowerPoint Presentation Gallery Example File
This is a revenue split by product segment template 2 ppt powerpoint presentation gallery example file. This is a four stage process. The stages in this process are business, marketing, graph, finance, revenue split.

Radar Chart Ppt PowerPoint Presentation Show Graphic Images
This is a radar chart ppt powerpoint presentation show graphic images. This is a two stage process. The stages in this process are business, radar chart, marketing, graph, strategy.

Clustered Column Ppt PowerPoint Presentation Inspiration Introduction
This is a clustered column ppt powerpoint presentation inspiration introduction. This is a two stage process. The stages in this process are business, marketing, in percentage, finance, graph, strategy.

Area Chart Ppt PowerPoint Presentation Icon Aids
This is a area chart ppt powerpoint presentation icon aids. This is a three stage process. The stages in this process are financial years, sales in percentage, business, marketing, graph.

Bar Chart Ppt PowerPoint Presentation Summary Themes
This is a bar chart ppt powerpoint presentation summary themes. This is a three stage process. The stages in this process are financial years, sales in percentage, business, marketing, graph.

Combo Chart Ppt PowerPoint Presentation Gallery Design Ideas
This is a combo chart ppt powerpoint presentation gallery design ideas. This is a three stage process. The stages in this process are business, financial years, sales in percentage, finance, graph.

Stacked Area Clustered Column Ppt PowerPoint Presentation Gallery Gridlines
This is a stacked area clustered column ppt powerpoint presentation gallery gridlines. This is a three stage process. The stages in this process are bar graph, product, in percentage.

Area Chart Ppt PowerPoint Presentation Model Demonstration
This is a area chart ppt powerpoint presentation model demonstration. This is a two stage process. The stages in this process are business, marketing, financial year, in percentage, graph.

Combo Chart Ppt PowerPoint Presentation Summary Background Images
This is a combo chart ppt powerpoint presentation summary background images. This is a two stage process. The stages in this process are business, marketing, financial year, in percentage, graph.

Area Chart Ppt PowerPoint Presentation Layouts Graphic Images
This is a area chart ppt powerpoint presentation layouts graphic images. This is a three stage process. The stages in this process are business, in years, marketing, in percentage, finance, graph.

Revenue Split By Product Segment Template 2 Ppt PowerPoint Presentation Summary Good
This is a revenue split by product segment template 2 ppt powerpoint presentation summary good. This is a four stage process. The stages in this process are business, marketing, finance, strategy, graph.
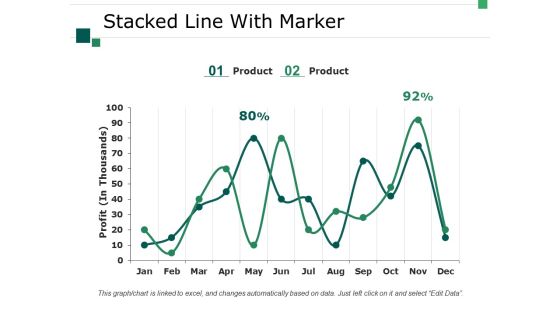
Stacked Line With Marker Ppt PowerPoint Presentation Professional Designs Download
This is a stacked line with marker ppt powerpoint presentation professional designs download. This is a two stage process. The stages in this process are business, marketing, strategy, graph, profit.

Volume High Low Close Chart Ppt PowerPoint Presentation Visual Aids Slides
This is a volume high low close chart ppt powerpoint presentation visual aids slides. This is a two stage process. The stages in this process are bar graph, marketing, strategy, finance, planning.

Clustered Column Line Ppt PowerPoint Presentation Model Graphics Tutorials
This is a clustered column line ppt powerpoint presentation model graphics tutorials. This is a three stage process. The stages in this process are business, marketing, in percentage, finance, graph.

Company Sales And Performance Dashboard Ppt PowerPoint Presentation Show Structure
This is a company sales and performance dashboard ppt powerpoint presentation show structure. This is a four stage process. The stages in this process are year product sales, month growth in revenue, profit margins graph, year profits.

Stacked Area Clustered Column Ppt PowerPoint Presentation Summary Slides
This is a stacked area clustered column ppt powerpoint presentation summary slides. This is a three stage process. The stages in this process are product, in percentage, financial year, bar graph.
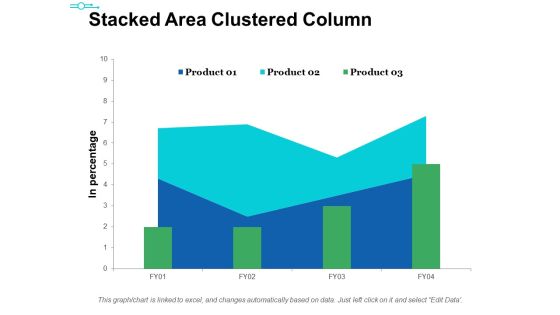
Stacked Area Clustered Column Ppt PowerPoint Presentation Ideas Themes
This is a stacked area clustered column ppt powerpoint presentation ideas themes. This is a three stage process. The stages in this process are product, in percentage, bar graph, area chart, growth.
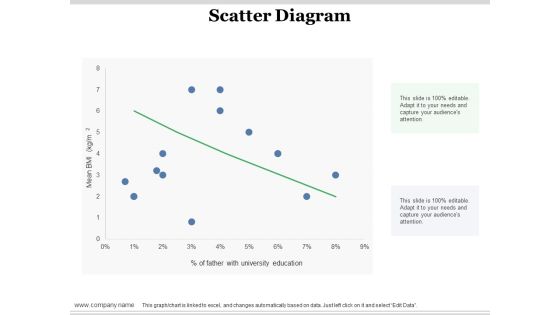
Scatter Diagram Ppt PowerPoint Presentation Infographic Template Design Ideas
This is a scatter diagram ppt powerpoint presentation infographic template design ideas. This is a one stage process. The stages in this process are scatter diagram, finance, in percentage, business, bar graph.

Bar Chart Ppt PowerPoint Presentation Styles Graphics Tutorials Ppt PowerPoint Presentation Slides Gallery
This is a bar chart ppt powerpoint presentation styles graphics tutorials ppt powerpoint presentation slides gallery. This is a two stage process. The stages in this process are bar graph, growth, success, business, marketing.
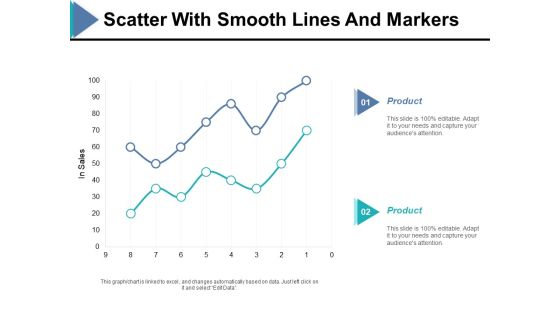
Scatter With Smooth Lines And Markers Ppt PowerPoint Presentation Ideas Example
This is a scatter with smooth lines and markers ppt powerpoint presentation ideas example. This is a two stage process. The stages in this process are in sales, finance, bar graph, product, business.

Stacked Bar Ppt PowerPoint Presentation Model Graphics
This is a stacked bar ppt powerpoint presentation model graphics. This is a two stage process. The stages in this process are stacked bar, product, chart and graph, finance, business.
Scatter Bubble Chart Ppt PowerPoint Presentation Model Icon
This is a scatter bubble chart ppt powerpoint presentation model icon. This is a three stage process. The stages in this process are finance, business, management, marketing, chart and graph.

Key Market Drivers And Forecast Ppt PowerPoint Presentation Summary Templates
This is a key market drivers and forecast ppt powerpoint presentation summary templates. This is a two stage process. The stages in this process are key market drivers, forecast, growth, bar graph, business.

Market Drivers Hardware And Software Ppt PowerPoint Presentation Inspiration Graphics Design
This is a market drivers hardware and software ppt powerpoint presentation inspiration graphics design. This is a two stage process. The stages in this process are key market drivers, forecast, growth, bar graph, business.
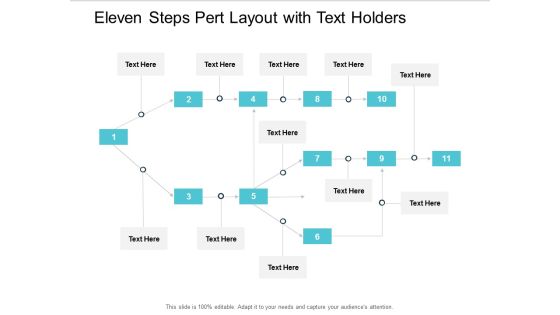
Eleven Steps Pert Layout With Text Holders Ppt Powerpoint Presentation Ideas Background Image
This is a eleven steps pert layout with text holders ppt powerpoint presentation ideas background image. This is a eleven stage process. The stages in this process are pert chart, program evaluation and review technique, pert graph.

Pert Layout For Project Management Ppt Powerpoint Presentation Professional Smartart
This is a pert layout for project management ppt powerpoint presentation professional smartart. This is a three stage process. The stages in this process are pert chart, program evaluation and review technique, pert graph.
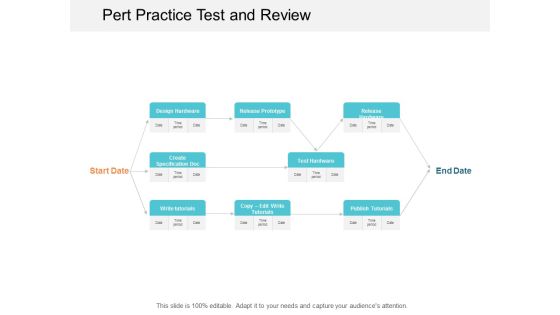
Pert Practice Test And Review Ppt Powerpoint Presentation Layouts Template
This is a pert practice test and review ppt powerpoint presentation layouts template. This is a two stage process. The stages in this process are pert chart, program evaluation and review technique, pert graph.

Program Evaluation Chart From Start To Finish Ppt Powerpoint Presentation Professional Examples
This is a program evaluation chart from start to finish ppt powerpoint presentation professional examples. This is a three stage process. The stages in this process are pert chart, program evaluation and review technique, pert graph.
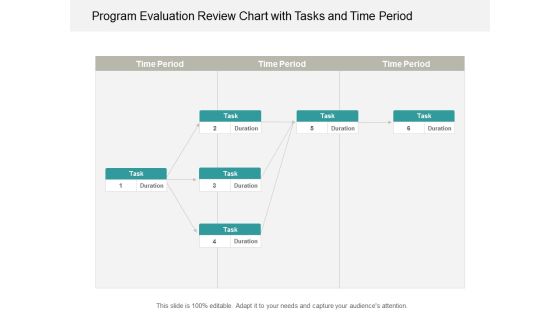
Program Evaluation Review Chart With Tasks And Time Period Ppt Powerpoint Presentation Portfolio Infographic Template
This is a program evaluation review chart with tasks and time period ppt powerpoint presentation portfolio infographic template. This is a six stage process. The stages in this process are pert chart, program evaluation and review technique, pert graph.
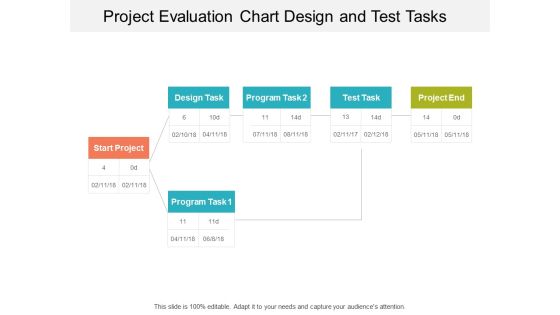
Project Evaluation Chart Design And Test Tasks Ppt Powerpoint Presentation Show Graphics Design
This is a project evaluation chart design and test tasks ppt powerpoint presentation show graphics design. This is a three stage process. The stages in this process are pert chart, program evaluation and review technique, pert graph.
Project Task Planning And Evaluation Chart Ppt Powerpoint Presentation Icon Slide
This is a project task planning and evaluation chart ppt powerpoint presentation icon slide. This is a nine stage process. The stages in this process are pert chart, program evaluation and review technique, pert graph.

Stages Of Project Evaluation Design Merge Test Ppt Powerpoint Presentation Outline Example Introduction
This is a stages of project evaluation design merge test ppt powerpoint presentation outline example introduction. This is a three stage process. The stages in this process are pert chart, program evaluation and review technique, pert graph.


 Continue with Email
 Sign up for an account
 Home
Home