Errc Graph

Clustered Bar Ppt PowerPoint Presentation Icon Images
This is a clustered bar ppt powerpoint presentation icon images. This is a three stage process. The stages in this process are unit count, finance, marketing, graph, business.

Clustered Column Ppt PowerPoint Presentation Summary Show
This is a clustered column ppt powerpoint presentation summary show. This is a two stage process. The stages in this process are finance, marketing, business, graph, strategy.

Stacked Bar Ppt PowerPoint Presentation Infographics Clipart
This is a stacked bar ppt powerpoint presentation infographics clipart. This is a two stage process. The stages in this process are finance, marketing, business, unit count, graph.

Clustered Column Ppt PowerPoint Presentation Slides Visuals
This is a clustered column ppt powerpoint presentation slides visuals. This is a two stage process. The stages in this process are bar graph, marketing, strategy, finance, planning.
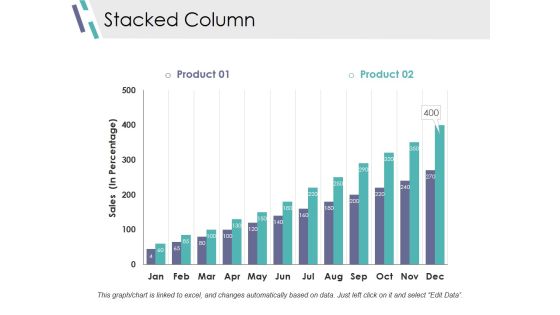
Stacked Column Ppt PowerPoint Presentation Professional Display
This is a stacked column ppt powerpoint presentation professional display. This is a two stage process. The stages in this process are bar graph, marketing, strategy, finance, planning.

Column Chart Ppt PowerPoint Presentation Summary Slides
This is a column chart ppt powerpoint presentation summary slides. This is a two stage process. The stages in this process are finance, marketing, business, graph, years.

Column Chart Ppt PowerPoint Presentation Summary Deck
This is a column chart ppt powerpoint presentation summary deck. This is a two stage process. The stages in this process are expenditure in, years, business, marketing, graph.

Line Chart Ppt PowerPoint Presentation Summary Rules
This is a line chart ppt powerpoint presentation summary rules. This is a two stage process. The stages in this process are profit, business, marketing, graph, finance.

Radar Chart Ppt PowerPoint Presentation Professional Aids
This is a radar chart ppt powerpoint presentation professional aids. This is a two stage process. The stages in this process are marketing, business, radar chart, finance, graph.
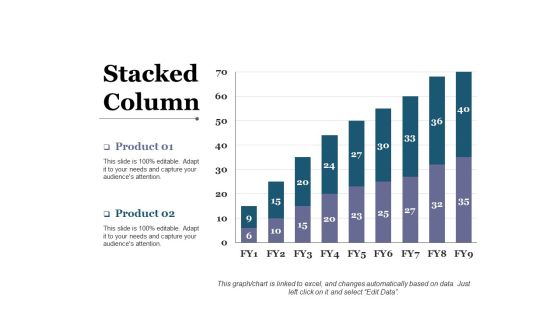
Stacked Column Ppt PowerPoint Presentation Ideas Maker
This is a stacked column ppt powerpoint presentation ideas maker. This is a two stage process. The stages in this process are business, financial, marketing, graph, strategy.

Clustered Column Ppt PowerPoint Presentation Professional Styles
This is a clustered column ppt powerpoint presentation professional styles. This is a two stage process. The stages in this process are product, profit, bar graph, growth, success.

Column Chart Ppt PowerPoint Presentation Portfolio Outline
This is a column chart ppt powerpoint presentation portfolio outline. This is a two stage process. The stages in this process are column chart, business, marketing, graph, strategy.

Column Chart Ppt PowerPoint Presentation File Inspiration
This is a column chart ppt powerpoint presentation file inspiration. This is a two stage process. The stages in this process are business, marketing, years, expenditure in, graph.
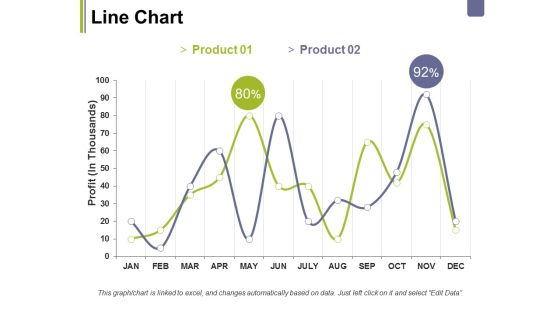
Line Chart Ppt PowerPoint Presentation Layouts Topics
This is a line chart ppt powerpoint presentation layouts topics. This is a two stage process. The stages in this process are business, profit, chart, percentage, graph, marketing.

Competitors Average Price Product Ppt PowerPoint Presentation Summary Display
This is a competitors average price product ppt powerpoint presentation summary display. This is a five stage process. The stages in this process are business, marketing, graph, finance.

Filled Area Ppt PowerPoint Presentation File Skills
This is a filled area ppt powerpoint presentation file skills. This is a two stage process. The stages in this process are business, marketing, strategy, graph.

Stacked Bar Ppt PowerPoint Presentation Pictures Slides
This is a stacked bar ppt powerpoint presentation pictures slides. This is a two stage process. The stages in this process are business, marketing, graph, finance, strategy.

Clustered Bar Ppt PowerPoint Presentation Icon Background
This is a clustered bar ppt powerpoint presentation icon background. This is a three stage process. The stages in this process are business, unit count, marketing, graph, finance.

Clustered Column Ppt PowerPoint Presentation Styles Diagrams
This is a clustered column ppt powerpoint presentation styles diagrams. This is a two stage process. The stages in this process are business, marketing, graph, finance, clustered column.

Column Chart Ppt PowerPoint Presentation Show Images
This is a column chart ppt powerpoint presentation show images. This is a two stage process. The stages in this process are product, expenditure, years, bar graph, growth.

Activity Ratios Ppt PowerPoint Presentation Summary Tips
This is a activity ratios ppt powerpoint presentation summary tips. This is a two stage process. The stages in this process are finance, chart graph, marketing, planning, analysis.

Liquidity Ratios Ppt PowerPoint Presentation Inspiration Skills
This is a liquidity ratios ppt powerpoint presentation inspiration skills. This is a two stage process. The stages in this process are finance, chart graph, marketing, planning, analysis.

Clustered Column Ppt PowerPoint Presentation Ideas Format Ideas
This is a clustered column ppt powerpoint presentation ideas format ideas. This is a two stage process. The stages in this process are business, marketing, graph, finance, strategy.
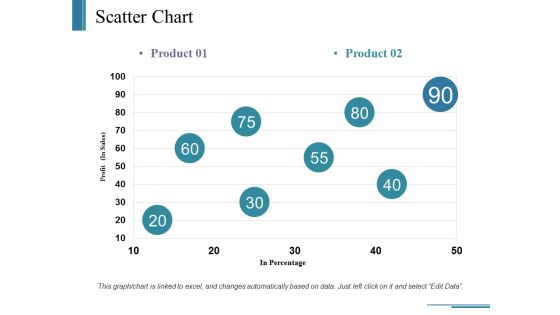
Scatter Chart Ppt PowerPoint Presentation Ideas Example
This is a scatter chart ppt powerpoint presentation ideas example. This is a two stage process. The stages in this process are business, in percentage, profit, marketing, graph.

Stacked Bar Ppt PowerPoint Presentation Gallery Summary
This is a stacked bar ppt powerpoint presentation gallery summary. This is a two stage process. The stages in this process are business, marketing, graph, unit count, finance.

Area Chart Ppt PowerPoint Presentation Outline Examples
This is a area chart ppt powerpoint presentation outline examples. This is a two stage process. The stages in this process are business, marketing, graph, finance, strategy.
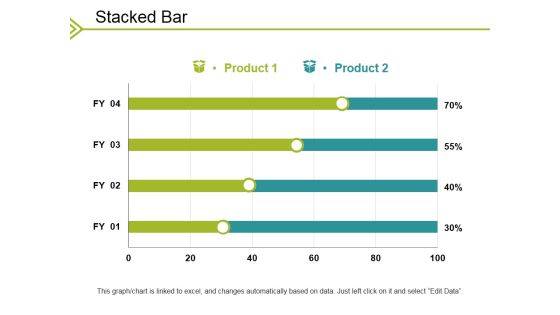
Stacked Bar Ppt PowerPoint Presentation File Outfit
This is a stacked bar ppt powerpoint presentation file outfit. This is a two stage process. The stages in this process are business, in percentage, marketing, strategy, graph.

Data Collection Histograms Ppt PowerPoint Presentation Show Topics
This is a data collection histograms ppt powerpoint presentation show topics. This is a seven stage process. The stages in this process are business, marketing, histogram, finance, graph.

Area Chart Ppt PowerPoint Presentation Outline Good
This is a area chart ppt powerpoint presentation outline good. This is a two stage process. The stages in this process are business, chart, marketing, finance, strategy, graph.

Column Chart Ppt PowerPoint Presentation Outline Deck
This is a column chart ppt powerpoint presentation outline deck. This is a two stage process. The stages in this process are business, marketing, expenditure in, years, graph.

Column Chart Ppt PowerPoint Presentation Ideas Deck
This is a column chart ppt powerpoint presentation ideas deck. This is a two stage process. The stages in this process are business, marketing, dollars, in years, graph.

Cash Flow Statement Kpis Ppt PowerPoint Presentation Clipart
This is a cash flow statement kpis ppt powerpoint presentation clipart. This is a four stage process. The stages in this process are business, marketing, finance, graph, strategy.

Column Chart Ppt PowerPoint Presentation Professional Template
This is a column chart ppt powerpoint presentation professional template. This is a two stage process. The stages in this process are product, percentage, finance, bar graph, growth.

Area Chart Ppt PowerPoint Presentation Icon Gallery
This is a area chart ppt powerpoint presentation icon gallery. This is a two stage process. The stages in this process are sales in percentage, product, bar graph.

Timeline Analysis Ppt PowerPoint Presentation Professional Ideas
This is a timeline analysis ppt powerpoint presentation professional ideas. This is a seven stage process. The stages in this process are process changes, timeline analysis, bar graph.

Demand Statistics Ppt PowerPoint Presentation Portfolio Guide
This is a demand statistics ppt powerpoint presentation portfolio guide. This is a four stage process. The stages in this process are demand, graph, growth, success, year.

Balance Sheet Kpis Ppt PowerPoint Presentation File Picture
This is a balance sheet kpis ppt powerpoint presentation file picture. This is a four stage process. The stages in this process are business, marketing, finance, graph, cagr.

Competitive Analysis Ppt PowerPoint Presentation Summary Picture
This is a competitive analysis ppt powerpoint presentation summary picture. This is a one stage process. The stages in this process are business, marketing, competitive analysis, finance, graph.

Demand Statistics Ppt PowerPoint Presentation Pictures Format Ideas
This is a demand statistics ppt powerpoint presentation pictures format ideas. This is a four stage process. The stages in this process are business, marketing, finance, graph, years.

Combo Chart Ppt PowerPoint Presentation Infographics Ideas
This is a combo chart ppt powerpoint presentation infographics ideas. This is a four stage process. The stages in this process are bar graph, marketing, strategy, finance, analysis.

Radar Chart Ppt PowerPoint Presentation Styles Deck
This is a radar chart ppt powerpoint presentation styles deck. This is a two stage process. The stages in this process are business, radar chart, finance, strategy, graph.
Stacked Bar Ppt PowerPoint Presentation Icon Deck
This is a stacked bar ppt powerpoint presentation icon deck. This is a three stage process. The stages in this process are business, unit count, marketing, strategy, graph.

Column Chart Ppt PowerPoint Presentation Summary
This is a column chart ppt powerpoint presentation summary. This is a two stage process. The stages in this process are bar graph, marketing, strategy, finance, planning.

Clustered Bar Ppt PowerPoint Presentation Slides Deck
This is a clustered bar ppt powerpoint presentation slides deck. This is a two stage process. The stages in this process are product, profit, bar graph.

Sales Projections Ppt PowerPoint Presentation Model Examples
This is a sales projections ppt powerpoint presentation model examples. This is a five stage process. The stages in this process are on sales, in years, bar graph.
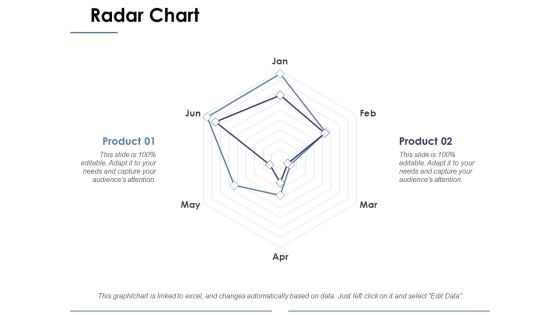
Radar Chart Ppt PowerPoint Presentation Portfolio Portrait
This is a radar chart ppt powerpoint presentation portfolio portrait. This is a two stage process. The stages in this process are business, radar chart, marketing, graph, strategy.

Column Chart Ppt PowerPoint Presentation Model Layout Ideas
This is a column chart ppt powerpoint presentation model layout ideas. This is a two stage process. The stages in this process are product, column chart, bar graph.

Clustered Column Ppt PowerPoint Presentation Styles Templates
This is a clustered column ppt powerpoint presentation styles templates. This is a two stage process. The stages in this process are product, profit, bar graph.

Column Chart Ppt PowerPoint Presentation Layouts Images
This is a column chart ppt powerpoint presentation layouts images. This is a two stage process. The stages in this process are product, column chart, bar graph, marketing.

Stratification Ppt PowerPoint Presentation Infographic Template Rules
This is a stratification ppt powerpoint presentation infographic template rules. This is a three stage process. The stages in this process are stratification, reactor, purity, iron, chart graph.

Business Framework The Strategic Planning Gap PowerPoint Presentation
This Power Point diagram template has been designed with graphic of mathematical graph. This business framework contains the concept of strategic planning gap. Use this diagram template for your business strategy and planning related topics in your management presentations.
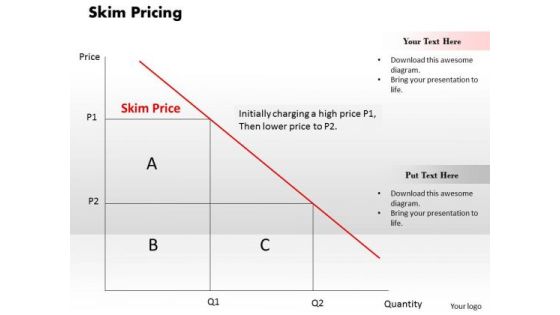
Business Framework Skim Pricing PowerPoint Presentation
This business framework power point template contains the graphic of graph. This PPT has been created with concept of skim pricing. Explain the skim pricing in your business and financial presentations by using this unique PPT.
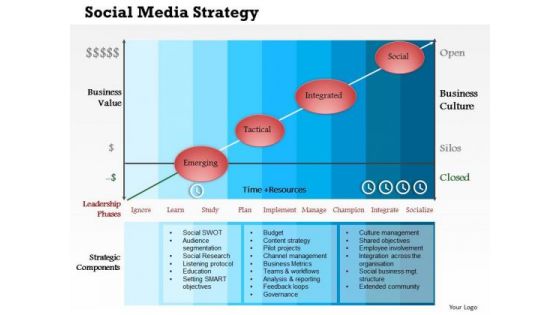
Business Framework Social Media Strategy PowerPoint Presentation
Define social media strategies in your business presentations by using this innovative business framework PPT. This PPT contains the social media marketing strategy and tools with the bar graph. Use this PPT for your social media and business related topics.

Business Framework Financial Distress PowerPoint Presentation
Define financial distress in your financial presentation with this exclusive PPT diagram. This PPT diagram contains the graphic of graph. This PPT diagram may be used for OTC and foreign exchange related topics.

Business Framework 10 Percent To 90 Percent PowerPoint Presentation
This business diagram has been designed with graphic of multiple pie graphs. This diagram slide contains the concept of result analysis with percentage values. Use this diagram to present and compare data in an impressive manner

Annual Customer Service Performance Review Example Of Ppt
This is a annual customer service performance review example of ppt. This is a twelve stage process. The stages in this process are bar graph, growth, data, customer, success.

Bar Chart With Annual Performance Analysis Over Years Ppt PowerPoint Presentation Design Ideas
This is a bar chart with annual performance analysis over years ppt powerpoint presentation design ideas. This is a five stage process. The stages in this process are business, strategy, marketing, analysis, line graph.
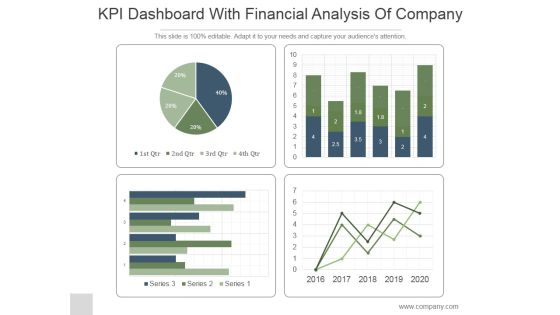
KPI Dashboard With Financial Analysis Of Company Ppt PowerPoint Presentation Backgrounds
This is a kpi dashboard with financial analysis of company ppt powerpoint presentation backgrounds. This is a four stage process. The stages in this process are business, strategy, marketing, line graph, finance.
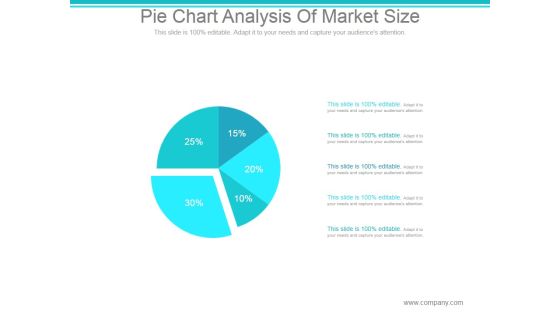
Pie Chart Analysis Of Market Size Ppt PowerPoint Presentation Show
This is a pie chart analysis of market size ppt powerpoint presentation show. This is a five stage process. The stages in this process are chart, graph, pie, percentage, business.
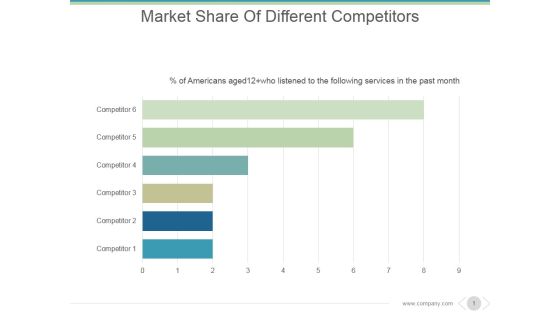
Market Share Of Different Competitors Ppt PowerPoint Presentation Inspiration
This is a market share of different competitors ppt powerpoint presentation inspiration. This is a six stage process. The stages in this process are competitor, business, marketing, graph, finance.


 Continue with Email
 Sign up for an account
 Home
Home