AI PPT Maker
Templates
PPT Bundles
Design Services
Business PPTs
Business Plan
Management
Strategy
Introduction PPT
Roadmap
Self Introduction
Timelines
Process
Marketing
Agenda
Technology
Medical
Startup Business Plan
Cyber Security
Dashboards
SWOT
Proposals
Education
Pitch Deck
Digital Marketing
KPIs
Project Management
Product Management
Artificial Intelligence
Target Market
Communication
Supply Chain
Google Slides
Research Services
 One Pagers
All Categories
-
Home
- Customer Favorites
- Errc Graph
Errc Graph

Personal Branding Plan For Executives Key Demographics For Social Media Campaign Ideas PDF
Mentioned slide depicts key statistics that an influencer can use to address audience demographics details when running a social media campaign. The best PPT templates are a great way to save time, energy, and resources. Slidegeeks have 100 percent editable powerpoint slides making them incredibly versatile. With these quality presentation templates, you can create a captivating and memorable presentation by combining visually appealing slides and effectively communicating your message. Download Personal Branding Plan For Executives Key Demographics For Social Media Campaign Ideas PDF from Slidegeeks and deliver a wonderful presentation.

Personal Branding Plan For Executives Metrics Addressing Social Media Followers Diagrams PDF
This slide illustrates key metrics that can be used by an influencer for addressing their social media followers over different channels such as Facebook, Twitter, Instagram along with their demographics. The Personal Branding Plan For Executives Metrics Addressing Social Media Followers Diagrams PDF is a compilation of the most recent design trends as a series of slides. It is suitable for any subject or industry presentation, containing attractive visuals and photo spots for businesses to clearly express their messages. This template contains a variety of slides for the user to input data, such as structures to contrast two elements, bullet points, and slides for written information. Slidegeeks is prepared to create an impression.
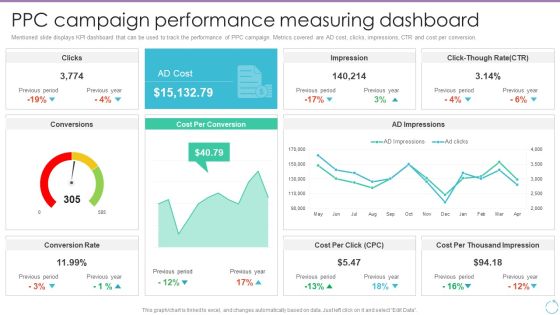
Personal Branding Plan For Executives Ppc Campaign Performance Measuring Download PDF
Mentioned slide displays KPI dashboard that can be used to track the performance of PPC campaign. Metrics covered are AD cost, clicks, impressions, CTR and cost per conversion. Take your projects to the next level with our ultimate collection of Personal Branding Plan For Executives Ppc Campaign Performance Measuring Download PDF. Slidegeeks has designed a range of layouts that are perfect for representing task or activity duration, keeping track of all your deadlines at a glance. Tailor these designs to your exact needs and give them a truly corporate look with your own brand colors theyll make your projects stand out from the rest.
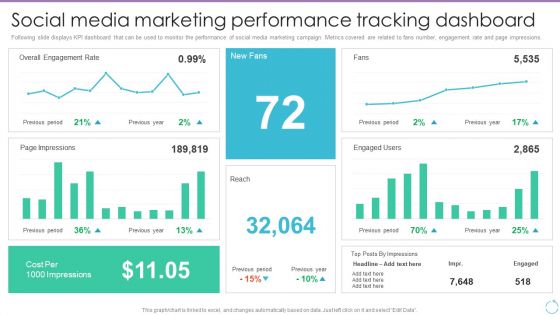
Personal Branding Plan For Executives Social Media Marketing Performance Clipart PDF
Following slide displays KPI dashboard that can be used to monitor the performance of social media marketing campaign. Metrics covered are related to fans number, engagement rate and page impressions. Slidegeeks is one of the best resources for PowerPoint templates. You can download easily and regulate Personal Branding Plan For Executives Social Media Marketing Performance Clipart PDF for your personal presentations from our wonderful collection. A few clicks is all it takes to discover and get the most relevant and appropriate templates. Use our Templates to add a unique zing and appeal to your presentation and meetings. All the slides are easy to edit and you can use them even for advertisement purposes.

Personal Branding Plan For Executives What Makes Personal Branding Best In Class Introduction PDF
Mentioned slide highlights survey results related to personal branding. It shows information about the critical factors that helps in making personal branding best in class. Are you in need of a template that can accommodate all of your creative concepts This one is crafted professionally and can be altered to fit any style. Use it with Google Slides or PowerPoint. Include striking photographs, symbols, depictions, and other visuals. Fill, move around, or remove text boxes as desired. Test out color palettes and font mixtures. Edit and save your work, or work with colleagues. Download Personal Branding Plan For Executives What Makes Personal Branding Best In Class Introduction PDF and observe how to make your presentation outstanding. Give an impeccable presentation to your group and make your presentation unforgettable.

Video Promotion Techniques Customer Conversion Rate From Social Media Platforms Inspiration PDF
The following slide outlines customer conversion rate derived from different social media channels. The key channels highlighted in the slide are Facebook, Instagram, YouTube, Twitter and Snapchat. Present like a pro with Video Promotion Techniques Customer Conversion Rate From Social Media Platforms Inspiration PDF Create beautiful presentations together with your team, using our easy-to-use presentation slides. Share your ideas in real-time and make changes on the fly by downloading our templates. So whether youre in the office, on the go, or in a remote location, you can stay in sync with your team and present your ideas with confidence. With Slidegeeks presentation got a whole lot easier. Grab these presentations today.
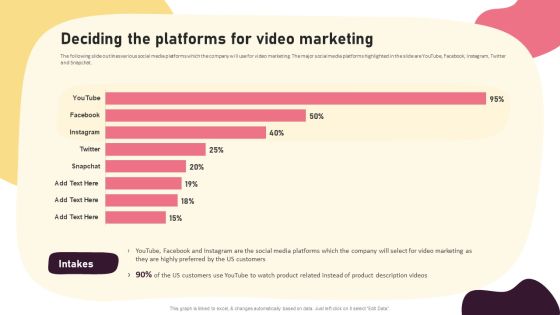
Video Promotion Techniques Deciding The Platforms For Video Marketing Ideas PDF
The following slide outlines various social media platforms which the company will use for video marketing. The major social media platforms highlighted in the slide are YouTube, Facebook, Instagram, Twitter and Snapchat. Slidegeeks is here to make your presentations a breeze with Video Promotion Techniques Deciding The Platforms For Video Marketing Ideas PDF With our easy-to-use and customizable templates, you can focus on delivering your ideas rather than worrying about formatting. With a variety of designs to choose from, youre sure to find one that suits your needs. And with animations and unique photos, illustrations, and fonts, you can make your presentation pop. So whether youre giving a sales pitch or presenting to the board, make sure to check out Slidegeeks first.
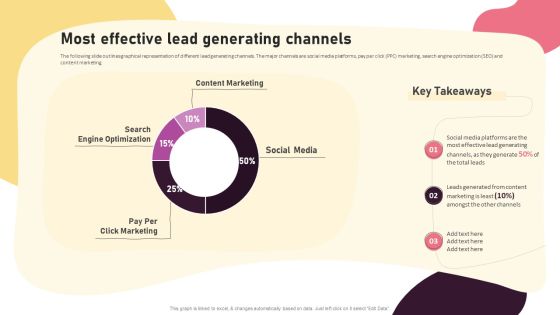
Video Promotion Techniques Most Effective Lead Generating Channels Template PDF
The following slide outlines graphical representation of different lead generating channels. The major channels are social media platforms, pay per click PPC marketing, search engine optimization SEO and content marketing. Whether you have daily or monthly meetings, a brilliant presentation is necessary. Video Promotion Techniques Most Effective Lead Generating Channels Template PDF can be your best option for delivering a presentation. Represent everything in detail using Video Promotion Techniques Most Effective Lead Generating Channels Template PDF and make yourself stand out in meetings. The template is versatile and follows a structure that will cater to your requirements. All the templates prepared by Slidegeeks are easy to download and edit. Our research experts have taken care of the corporate themes as well. So, give it a try and see the results.

Video Promotion Techniques Engagement Rate From Various Social Media Platforms Sample PDF
The following slide outlines the engagement rate generated from video content on different social media channels. Facebook, Instagram, YouTube, Twitter and Snapchat are some of the major channels which are highlighted in the slide. Make sure to capture your audiences attention in your business displays with our gratis customizable Video Promotion Techniques Engagement Rate From Various Social Media Platforms Sample PDF. These are great for business strategies, office conferences, capital raising or task suggestions. If you desire to acquire more customers for your tech business and ensure they stay satisfied, create your own sales presentation with these plain slides.

Video Promotion Techniques Factors To Consider While Budgeting Video Marketing Strategy Microsoft PDF
The following slide outlines multiple factors which the company needs to consider while planning and budgeting video marketing strategy. The key factors are technology, production, content and marketing readiness. Formulating a presentation can take up a lot of effort and time, so the content and message should always be the primary focus. The visuals of the PowerPoint can enhance the presenters message, so our Video Promotion Techniques Factors To Consider While Budgeting Video Marketing Strategy Microsoft PDF was created to help save time. Instead of worrying about the design, the presenter can concentrate on the message while our designers work on creating the ideal templates for whatever situation is needed. Slidegeeks has experts for everything from amazing designs to valuable content, we have put everything into Video Promotion Techniques Factors To Consider While Budgeting Video Marketing Strategy Microsoft PDF.

Video Promotion Techniques Identifying Key Demographics Of Target Audience Ideas PDF
The following slide outlines the major demographics of video marketing target audience. Information covered in this slide is related to gender, age, location, income and education level. This modern and well-arranged Video Promotion Techniques Identifying Key Demographics Of Target Audience Ideas PDF provides lots of creative possibilities. It is very simple to customize and edit with the Powerpoint Software. Just drag and drop your pictures into the shapes. All facets of this template can be edited with Powerpoint, no extra software is necessary. Add your own material, put your images in the places assigned for them, adjust the colors, and then you can show your slides to the world, with an animated slide included.

Video Promotion Techniques KPI Dashboard To Measure Effectiveness Of Youtube Pictures PDF
The following slide outlines key performance indicator KPI dashboard which will assist the marketer to track YouTube marketing campaign performance. The key metrics covered in the slide are subscribers gained and lost, likes, dislikes, comments, shares etc. Explore a selection of the finest Video Promotion Techniques KPI Dashboard To Measure Effectiveness Of Youtube Pictures PDF here. With a plethora of professionally designed and pre-made slide templates, you can quickly and easily find the right one for your upcoming presentation. You can use our Video Promotion Techniques KPI Dashboard To Measure Effectiveness Of Youtube Pictures PDF to effectively convey your message to a wider audience. Slidegeeks has done a lot of research before preparing these presentation templates. The content can be personalized and the slides are highly editable. Grab templates today from Slidegeeks.
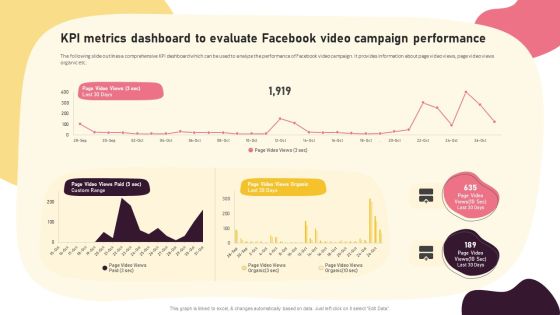
Video Promotion Techniques KPI Metrics Dashboard To Evaluate Facebook Video Introduction PDF
The following slide outlines a comprehensive KPI dashboard which can be used to analyze the performance of Facebook video campaign. It provides information about page video views, page video views organic etc. The best PPT templates are a great way to save time, energy, and resources. Slidegeeks have 100 percent editable powerpoint slides making them incredibly versatile. With these quality presentation templates, you can create a captivating and memorable presentation by combining visually appealing slides and effectively communicating your message. Download Video Promotion Techniques KPI Metrics Dashboard To Evaluate Facebook Video Introduction PDF from Slidegeeks and deliver a wonderful presentation.

Video Promotion Techniques Measuring ROI Of Video Marketing Diagrams PDF
The following slide illustrates a chart highlighting the return on investment ROI from different social media platforms using video marketing strategy. The key channels are Facebook, Instagram and YouTube. Retrieve professionally designed Video Promotion Techniques Measuring ROI Of Video Marketing Diagrams PDF to effectively convey your message and captivate your listeners. Save time by selecting pre-made slideshows that are appropriate for various topics, from business to educational purposes. These themes come in many different styles, from creative to corporate, and all of them are easily adjustable and can be edited quickly. Access them as PowerPoint templates or as Google Slides themes. You dont have to go on a hunt for the perfect presentation because Slidegeeks got you covered from everywhere.

Video Promotion Techniques What Type Of Content Preferred By Customers Introduction PDF
The following slide outlines a survey which will assist the marketer to find out the content preference of consumers. The type of content highlighted in the slide are videos, email, social images, bog articles and content in PDF form. From laying roadmaps to briefing everything in detail, our templates are perfect for you. You can set the stage with your presentation slides. All you have to do is download these easy-to-edit and customizable templates. Video Promotion Techniques What Type Of Content Preferred By Customers Introduction PDF will help you deliver an outstanding performance that everyone would remember and praise you for. Do download this presentation today.
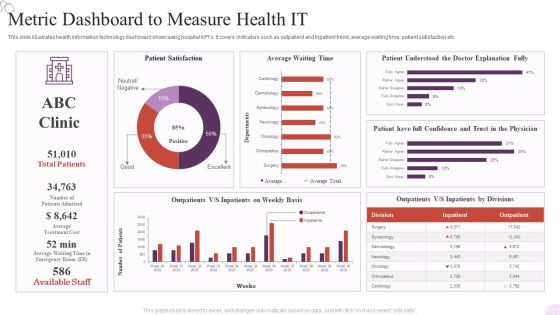
Metric Dashboard To Measure Health IT Background PDF
Pitch your topic with ease and precision using this Metric Dashboard To Measure Health IT Background PDF. This layout presents information on Metric Dashboard, Patient Satisfaction, Average Waiting Time. It is also available for immediate download and adjustment. So, changes can be made in the color, design, graphics or any other component to create a unique layout.

Dashboard For Tracking Organizational OGSM Model Metrics Microsoft PDF
Pitch your topic with ease and precision using this Dashboard For Tracking Organizational OGSM Model Metrics Microsoft PDF. This layout presents information on Revenue, Market Share, Gross Margin. It is also available for immediate download and adjustment. So, changes can be made in the color, design, graphics or any other component to create a unique layout.

Adopting Flexible Work Policy Analyzing Workplace Flexibility Survey Results Portrait PDF
The following slide outlines result of the remote working survey in the form of statistical data. Using this data the organizations can improve flexible work culture and boost workers morale in the organization. Boost your pitch with our creative Adopting Flexible Work Policy Analyzing Workplace Flexibility Survey Results Portrait PDF. Deliver an awe-inspiring pitch that will mesmerize everyone. Using these presentation templates you will surely catch everyones attention. You can browse the ppts collection on our website. We have researchers who are experts at creating the right content for the templates. So you dont have to invest time in any additional work. Just grab the template now and use them.

Adopting Flexible Work Policy Clustered Column Chart Clipart PDF
Slidegeeks is one of the best resources for PowerPoint templates. You can download easily and regulate Adopting Flexible Work Policy Clustered Column Chart Clipart PDF for your personal presentations from our wonderful collection. A few clicks is all it takes to discover and get the most relevant and appropriate templates. Use our Templates to add a unique zing and appeal to your presentation and meetings. All the slides are easy to edit and you can use them even for advertisement purposes.

Adopting Flexible Work Policy Dashboard To Analyze Flexible Working Strategies Impact Template PDF
The following slide delineates a key performance indicator KPI dashboard through which managers can evaluate the success of a flexible working policy on workforce performance. The major KPIs are absenteeism rate, overall labor effectiveness etc. Do you have to make sure that everyone on your team knows about any specific topic I yes, then you should give Adopting Flexible Work Policy Dashboard To Analyze Flexible Working Strategies Impact Template PDF a try. Our experts have put a lot of knowledge and effort into creating this impeccable Adopting Flexible Work Policy Dashboard To Analyze Flexible Working Strategies Impact Template PDF. You can use this template for your upcoming presentations, as the slides are perfect to represent even the tiniest detail. You can download these templates from the Slidegeeks website and these are easy to edit. So grab these today.

Adopting Flexible Work Policy Flexible Working Challenges Post Covid19 Elements PDF
The following slide delineates flexible scheduling challenges which are faced by small, medium, and large-scale businesses after the pandemic. The challenges are lack of bonding, distractions at home, poor internet connection, staying motivated and communication gap. Crafting an eye-catching presentation has never been more straightforward. Let your presentation shine with this tasteful yet straightforward Adopting Flexible Work Policy Flexible Working Challenges Post Covid19 Elements PDF template. It offers a minimalistic and classy look that is great for making a statement. The colors have been employed intelligently to add a bit of playfulness while still remaining professional. Construct the ideal Adopting Flexible Work Policy Flexible Working Challenges Post Covid19 Elements PDF that effortlessly grabs the attention of your audience Begin now and be certain to wow your customers.

Adopting Flexible Work Policy Impact Of Flexible Working On Employees Performance Ideas PDF
The following slide showcases the impact of remote working on performance of the workforce. Employee productivity, job satisfaction, employee retention and absenteeism rate are the major factors that are mentioned in the slide along with key insights. Coming up with a presentation necessitates that the majority of the effort goes into the content and the message you intend to convey. The visuals of a PowerPoint presentation can only be effective if it supplements and supports the story that is being told. Keeping this in mind our experts created Adopting Flexible Work Policy Impact Of Flexible Working On Employees Performance Ideas PDF to reduce the time that goes into designing the presentation. This way, you can concentrate on the message while our designers take care of providing you with the right template for the situation.

Adopting Flexible Work Policy Statistics Showing Continuously Rise In Flexible Icons PDF
The following slide outlines a diagrammatic representation outlining the percentage of companies switching to flexible work arrangements. It includes details of the last 5 years along with key observations. Presenting this PowerPoint presentation, titled Adopting Flexible Work Policy Statistics Showing Continuously Rise In Flexible Icons PDF, with topics curated by our researchers after extensive research. This editable presentation is available for immediate download and provides attractive features when used. Download now and captivate your audience. Presenting this Adopting Flexible Work Policy Statistics Showing Continuously Rise In Flexible Icons PDF. Our researchers have carefully researched and created these slides with all aspects taken into consideration. This is a completely customizable Adopting Flexible Work Policy Statistics Showing Continuously Rise In Flexible Icons PDF that is available for immediate downloading. Download now and make an impact on your audience. Highlight the attractive features available with our PPTs.

Adopting Flexible Work Policy Work From Home Performance Management Dashboard Demonstration PDF
The following slide outlines a comprehensive key performance indicator KPI dashboard that can be used to showcase employees performance during work-from-home WFH. Information covered in this slide is related to average result area scores etc. Slidegeeks is one of the best resources for PowerPoint templates. You can download easily and regulate Adopting Flexible Work Policy Work From Home Performance Management Dashboard Demonstration PDF for your personal presentations from our wonderful collection. A few clicks is all it takes to discover and get the most relevant and appropriate templates. Use our Templates to add a unique zing and appeal to your presentation and meetings. All the slides are easy to edit and you can use them even for advertisement purposes.

Adopting Flexible Work Policy Area Chart Ppt PowerPoint Presentation File Slideshow PDF
Do you have to make sure that everyone on your team knows about any specific topic I yes, then you should give Adopting Flexible Work Policy Area Chart Ppt PowerPoint Presentation File Slideshow PDF a try. Our experts have put a lot of knowledge and effort into creating this impeccable Adopting Flexible Work Policy Area Chart Ppt PowerPoint Presentation File Slideshow PDF. You can use this template for your upcoming presentations, as the slides are perfect to represent even the tiniest detail. You can download these templates from the Slidegeeks website and these are easy to edit. So grab these today.

Adopting Flexible Work Policy Pie Chart Ppt PowerPoint Presentation File Layouts PDF
Do you have an important presentation coming up Are you looking for something that will make your presentation stand out from the rest Look no further than Adopting Flexible Work Policy Pie Chart Ppt PowerPoint Presentation File Layouts PDF. With our professional designs, you can trust that your presentation will pop and make delivering it a smooth process. And with Slidegeeks, you can trust that your presentation will be unique and memorable. So why wait Grab Adopting Flexible Work Policy Pie Chart Ppt PowerPoint Presentation File Layouts PDF today and make your presentation stand out from the rest.

Adopting Flexible Work Policy Stock Chart Ppt PowerPoint Presentation File Influencers PDF
If your project calls for a presentation, then Slidegeeks is your go-to partner because we have professionally designed, easy-to-edit templates that are perfect for any presentation. After downloading, you can easily edit Adopting Flexible Work Policy Stock Chart Ppt PowerPoint Presentation File Influencers PDF and make the changes accordingly. You can rearrange slides or fill them with different images. Check out all the handy templates

Business Revenue And Client Retention Analytics Dashboard Brochure PDF
This slide shows dashboard of service department of firm to make business decisions using customer analytics and covers essential KPIs of customer. It includes request answered, revenue, support cost, customer satisfaction and retention, average time to solve issue. Showcasing this set of slides titled Business Revenue And Client Retention Analytics Dashboard Brochure PDF. The topics addressed in these templates are Customer Satisfaction, Customer Retention, Revenue. All the content presented in this PPT design is completely editable. Download it and make adjustments in color, background, font etc. as per your unique business setting.

Communication Channels Used By Client And Business Enterprises Guidelines PDF
This slide shows statistical data of communication between company and consumer. It includes email, phone, in person, social media, online forms, knowledge base, portals, text, live support, mobile app, discussion forums and voice activated personal assistants. Pitch your topic with ease and precision using this Communication Channels Used By Client And Business Enterprises Guidelines PDF. This layout presents information on Service, Communication, Customer. It is also available for immediate download and adjustment. So, changes can be made in the color, design, graphics or any other component to create a unique layout.
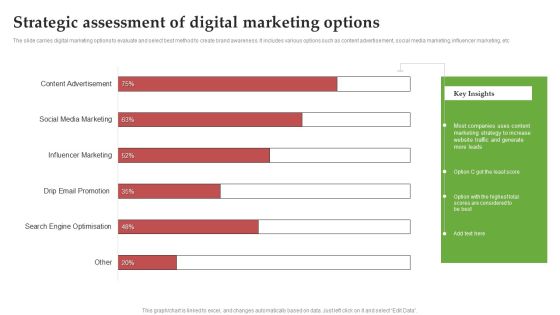
Strategic Assessment Of Digital Marketing Options Ppt PowerPoint Presentation File Show PDF
The slide carries digital marketing options to evaluate and select best method to create brand awareness. It includes various options such as content advertisement, social media marketing, influencer marketing, etc. Pitch your topic with ease and precision using this Strategic Assessment Of Digital Marketing Options Ppt PowerPoint Presentation File Show PDF. This layout presents information on Influencer Marketing, Social Media Marketing, Content Advertisement. It is also available for immediate download and adjustment. So, changes can be made in the color, design, graphics or any other component to create a unique layout.

Strategic Performance Analysis Tools Survey Microsoft PDF
This slide showcase survey result of 300 professional organization using strategic performance measurement tools. It includes elements such as key performance indicators, performance appraisal method, six sigma method, 360 degree feedback etc. Pitch your topic with ease and precision using this Strategic Performance Analysis Tools Survey Microsoft PDF. This layout presents information on Strategic Performance, Analysis Tools Survey. It is also available for immediate download and adjustment. So, changes can be made in the color, design, graphics or any other component to create a unique layout.
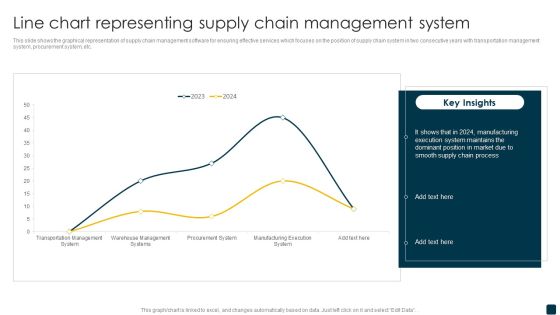
Line Chart Representing Supply Chain Management System Rules PDF
This slide shows the graphical representation of supply chain management software for ensuring effective services which focuses on the position of supply chain system in two consecutive years with transportation management system, procurement system, etc. Pitch your topic with ease and precision using this Line Chart Representing Supply Chain Management System Rules PDF. This layout presents information on Supply Chain Process, Manufacturing, Execution System. It is also available for immediate download and adjustment. So, changes can be made in the color, design, graphics or any other component to create a unique layout.

Annual Business Financial Summary Dashboard Themes PDF
This slide shows annual financial report dashboard of company to monitor yearly business performance. It includes various indicators such as revenue, net profits, costs and breakdown of cost. Showcasing this set of slides titled Annual Business Financial Summary Dashboard Themes PDF. The topics addressed in these templates are Revenue, Costs, Net Profit. All the content presented in this PPT design is completely editable. Download it and make adjustments in color, background, font etc. as per your unique business setting.

Business Sales And Revenue Summary Dashboard Brochure PDF
This slide exhibits sales report dashboards that provides information of sales activities and performance in financial year. It includes elements such as average weekly sales revenue, customer acquisition cost, customer lifetime value and sales target. Pitch your topic with ease and precision using this Business Sales And Revenue Summary Dashboard Brochure PDF. This layout presents information on Average Revenue, Customer Lifetime, Customer Acquisition. It is also available for immediate download and adjustment. So, changes can be made in the color, design, graphics or any other component to create a unique layout.

Car Company Rating Column Chart With Key Insights Structure PDF
This slide illustrates car company ratings to compare the quality and preference of customers towards the specific car brand. It shows consumer rating, expert rating, predicted rating and desired rating.Showcasing this set of slides titled Car Company Rating Column Chart With Key Insights Structure PDF. The topics addressed in these templates are Performance Quality, Top Security, Predicted Rating. All the content presented in this PPT design is completely editable. Download it and make adjustments in color, background, font etc. as per your unique business setting.

Company Age Wise Employee Count Column Chart With Key Insights Microsoft PDF
This slide illustrates employee count by age to find the recruitment rate for company. It includes aspects such as the number of employees and age.Pitch your topic with ease and precision using this Company Age Wise Employee Count Column Chart With Key Insights Microsoft PDF. This layout presents information on Employees Working, Total Workforce, Require Replacement. It is also available for immediate download and adjustment. So, changes can be made in the color, design, graphics or any other component to create a unique layout.

Continent Inflation Rate Percentage Column Chart With Key Insights Topics PDF
This slide illustrates percentage of inflation rate in continents to increase value of investment returns. It includes parts such as continents and inflation rate percentage.Showcasing this set of slides titled Continent Inflation Rate Percentage Column Chart With Key Insights Topics PDF. The topics addressed in these templates are Developing Countries, Covid Restrictions, Food Supplies. All the content presented in this PPT design is completely editable. Download it and make adjustments in color, background, font etc. as per your unique business setting.
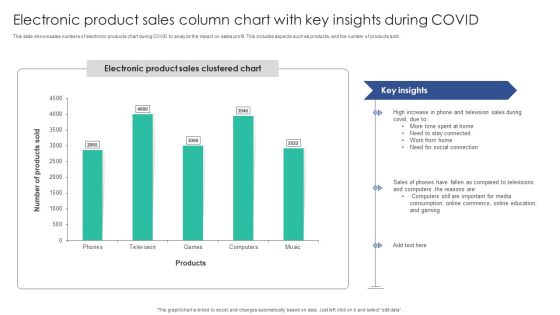
Electronic Product Sales Column Chart With Key Insights During COVID Microsoft PDF
This slide shows sales numbers of electronic products chart during COVID to analyze the impact on sales profit. This includes aspects such as products, and the number of products sold. Pitch your topic with ease and precision using this Electronic Product Sales Column Chart With Key Insights During COVID Microsoft PDF. This layout presents information on Stay Connected, Social Connection, Compared Televisions. It is also available for immediate download and adjustment. So, changes can be made in the color, design, graphics or any other component to create a unique layout.

Insurance Policy Proportion Types Column Chart With Key Insights Ideas PDF
This slide illustrates policy percentage chart in various cities of Unites States of America to increase policy sales. It depicts cities, and insurance counts Showcasing this set of slides titled Insurance Policy Proportion Types Column Chart With Key Insights Ideas PDF. The topics addressed in these templates are Floods Hurricanes, Tourists Visit, Invest Property. All the content presented in this PPT design is completely editable. Download it and make adjustments in color, background, font etc. as per your unique business setting.
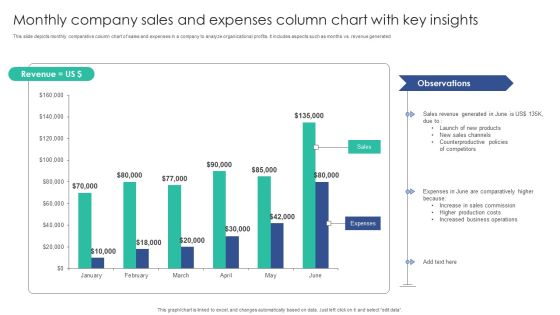
Monthly Company Sales And Expenses Column Chart With Key Insights Mockup PDF
This slide depicts monthly comparative column chart of sales and expenses in a company to analyze organizational profits. It includes aspects such as months vs. revenue generatedPitch your topic with ease and precision using this Monthly Company Sales And Expenses Column Chart With Key Insights Mockup PDF. This layout presents information on Sales Channels, Counterproductive Policies, Sales Commission. It is also available for immediate download and adjustment. So, changes can be made in the color, design, graphics or any other component to create a unique layout.

Monthly Employee Expenses Column Chart With Key Insights Download PDF
This slide shows monthly expenses of employee chart to determine living expense and budget planning. It includes parts such as months and monthly expenses.Showcasing this set of slides titled Monthly Employee Expenses Column Chart With Key Insights Download PDF. The topics addressed in these templates are Expense Utilities, Festive Expenditure, Gasoline Expense. All the content presented in this PPT design is completely editable. Download it and make adjustments in color, background, font etc. as per your unique business setting.
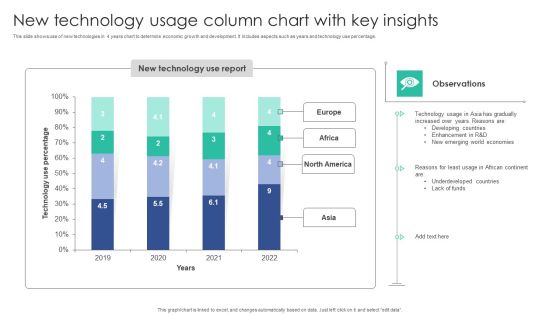
New Technology Usage Column Chart With Key Insights Brochure PDF
This slide shows use of new technologies in 4 years chart to determine economic growth and development. It Includes aspects such as years and technology use percentage.Pitch your topic with ease and precision using this New Technology Usage Column Chart With Key Insights Brochure PDF. This layout presents information on Technology Gradually, Increased Reasons, Developing Countries. It is also available for immediate download and adjustment. So, changes can be made in the color, design, graphics or any other component to create a unique layout.
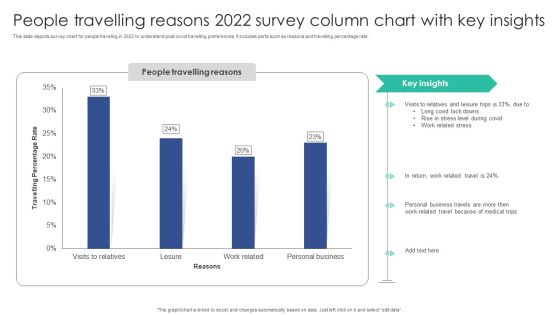
People Travelling Reasons 2022 Survey Column Chart With Key Insights Sample PDF
This slide depicts survey chart for people traveling in 2022 to understand post covid travelling preferences. It includes parts such as reasons and travelling percentage rate.Pitch your topic with ease and precision using this People Travelling Reasons 2022 Survey Column Chart With Key Insights Sample PDF. This layout presents information on Visits Relatives, Leisure Trips, Personal Business. It is also available for immediate download and adjustment. So, changes can be made in the color, design, graphics or any other component to create a unique layout.

Profit And Discount By Products Column Chart With Key Insights Template PDF
This slide illustrates the profits earned and discounts offered by respective products to measure efficient financial operations. It includes aspects such as products and profit, discount revenue.Showcasing this set of slides titled Profit And Discount By Products Column Chart With Key Insights Template PDF. The topics addressed in these templates are Product Profit, Generated Product, Version Launched. All the content presented in this PPT design is completely editable. Download it and make adjustments in color, background, font etc. as per your unique business setting.
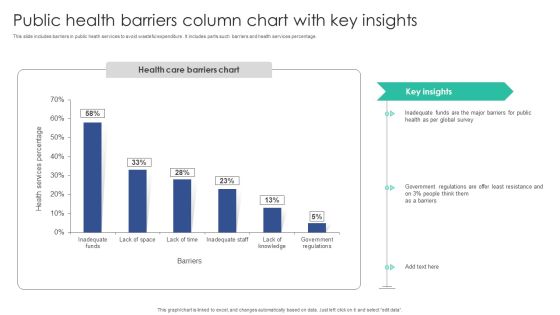
Public Health Barriers Column Chart With Key Insights Portrait PDF
This slide includes barriers in public heath services to avoid wasteful expenditure . It includes parts such barriers and health services percentage.Pitch your topic with ease and precision using this Public Health Barriers Column Chart With Key Insights Portrait PDF. This layout presents information on Inadequate Funds, Global Survey, Government Regulations. It is also available for immediate download and adjustment. So, changes can be made in the color, design, graphics or any other component to create a unique layout.
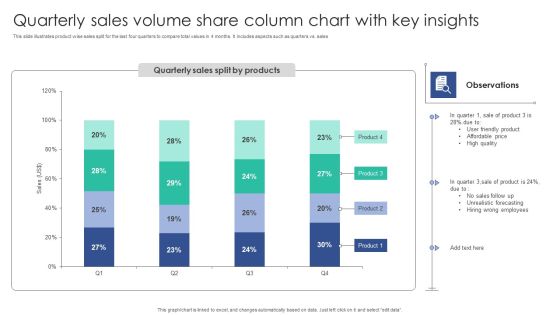
Quarterly Sales Volume Share Column Chart With Key Insights Structure PDF
This slide illustrates product wise sales split for the last four quarters to compare total values in 4 months. It includes aspects such as quarters vs. salesShowcasing this set of slides titled Quarterly Sales Volume Share Column Chart With Key Insights Structure PDF. The topics addressed in these templates are Unrealistic Forecasting, Wrong Employees, Friendly Product. All the content presented in this PPT design is completely editable. Download it and make adjustments in color, background, font etc. as per your unique business setting.

Regional Sales Percentage Column Chart With Key Insights Diagrams PDF
This slide illustrates sales percentage chart in regions of USA to calculate and interpret present fuel consumption. It includes parts such as regions and sales percentage.Pitch your topic with ease and precision using this Regional Sales Percentage Column Chart With Key Insights Diagrams PDF. This layout presents information on Industries Central, Sales Central, Productions Companies. It is also available for immediate download and adjustment. So, changes can be made in the color, design, graphics or any other component to create a unique layout.

Soft Drinks Brand Preference Column Chart With Key Insights Clipart PDF
This slide shows survey results of soft drinks consumption by different age groups of consumers. Major brands covered are coke, Pepsi, coke zero, and Pepsi max to visualize soda consumption.Showcasing this set of slides titled Soft Drinks Brand Preference Column Chart With Key Insights Clipart PDF. The topics addressed in these templates are Survey Consumers, Personalized Advertisements, Emotional Connect. All the content presented in this PPT design is completely editable. Download it and make adjustments in color, background, font etc. as per your unique business setting.
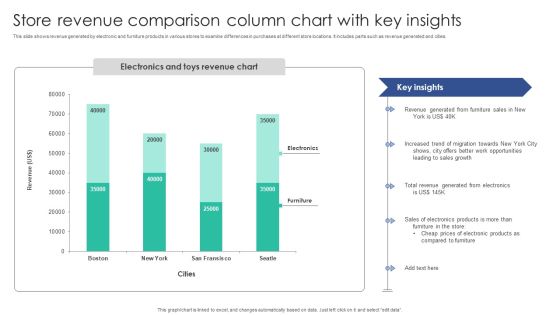
Store Revenue Comparison Column Chart With Key Insights Themes PDF
This slide shows revenue generated by electronic and furniture products in various stores to examine differences in purchases at different store locations. It includes parts such as revenue generated and cities. Showcasing this set of slides titled Store Revenue Comparison Column Chart With Key Insights Themes PDF. The topics addressed in these templates are Revenue Generated, Furniture Sales, Increased Trend. All the content presented in this PPT design is completely editable. Download it and make adjustments in color, background, font etc. as per your unique business setting.
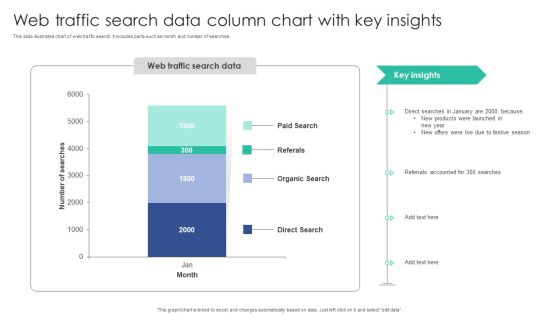
Web Traffic Search Data Column Chart With Key Insights Inspiration PDF
This slide illustrates chart of web traffic search. It includes parts such as month and number of searches.Pitch your topic with ease and precision using this Web Traffic Search Data Column Chart With Key Insights Inspiration PDF. This layout presents information on Organic Search, Referrals Accounted, Products Launched. It is also available for immediate download and adjustment. So, changes can be made in the color, design, graphics or any other component to create a unique layout.

Yearly Paid Subscription Column Chart With Key Insights Microsoft PDF
This slide depicts yearly chart for paid subscriptions to encourage constant improvement in services and profit. It includes parts such as years and number of subscriptions.Showcasing this set of slides titled Yearly Paid Subscription Column Chart With Key Insights Microsoft PDF. The topics addressed in these templates are Paid Subscribers, Company Gained, Subscriptions Represents. All the content presented in this PPT design is completely editable. Download it and make adjustments in color, background, font etc. as per your unique business setting.
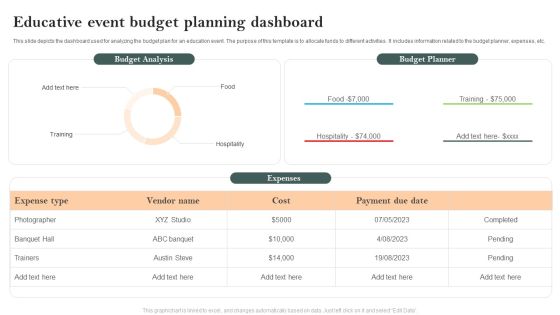
Educative Event Budget Planning Dashboard Professional PDF
This slide depicts the dashboard used for analyzing the budget plan for an education event. The purpose of this template is to allocate funds to different activities. It includes information related to the budget planner, expenses, etc.Showcasing this set of slides titled Educative Event Budget Planning Dashboard Professional PDF. The topics addressed in these templates are Budget Analysis, Budget Planner, Payment Date. All the content presented in this PPT design is completely editable. Download it and make adjustments in color, background, font etc. as per your unique business setting.
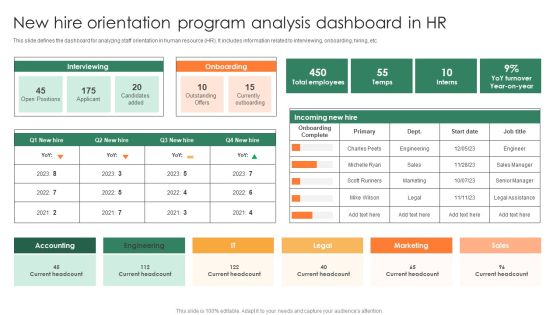
New Hire Orientation Program Analysis Dashboard In HR Clipart PDF
Pitch your topic with ease and precision using this New Hire Orientation Program Analysis Dashboard In HR Clipart PDF. This layout presents information on Currently Outboarding, Current Headcount, Onboarding Complete. It is also available for immediate download and adjustment. So, changes can be made in the color, design, graphics or any other component to create a unique layout.
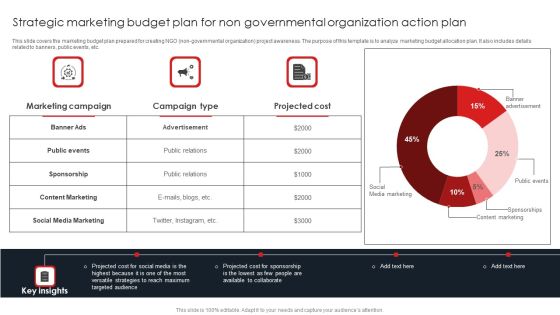
Strategic Marketing Budget Plan For Non Governmental Organization Action Plan Background PDF
This slide covers the marketing budget plan prepared for creating NGO non-governmental organization project awareness. The purpose of this template is to analyze marketing budget allocation plan. It also includes details related to banners, public events, etc.Pitch your topic with ease and precision using this Strategic Marketing Budget Plan For Non Governmental Organization Action Plan Background PDF. This layout presents information on Content Marketing, Media Marketing, Projected Cost. It is also available for immediate download and adjustment. So, changes can be made in the color, design, graphics or any other component to create a unique layout.
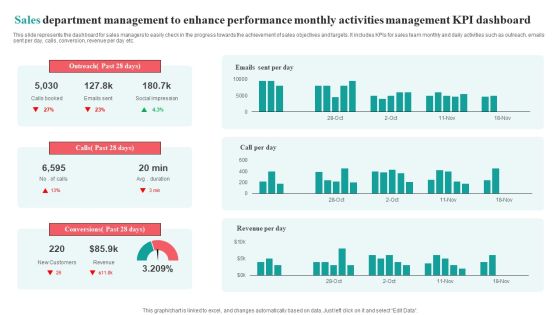
Sales Department Management To Enhance Performance Monthly Activities Management KPI Dashboard Brochure PDF
This slide represents the dashboard for sales managers to easily check in the progress towards the achievement of sales objectives and targets. It includes KPIs for sales team monthly and daily activities such as outreach, emails sent per day, calls, conversion, revenue per day etc.Pitch your topic with ease and precision using this Sales Department Management To Enhance Performance Monthly Activities Management KPI Dashboard Brochure PDF. This layout presents information on Social Impression, Conversions Past, Outreach Past. It is also available for immediate download and adjustment. So, changes can be made in the color, design, graphics or any other component to create a unique layout.
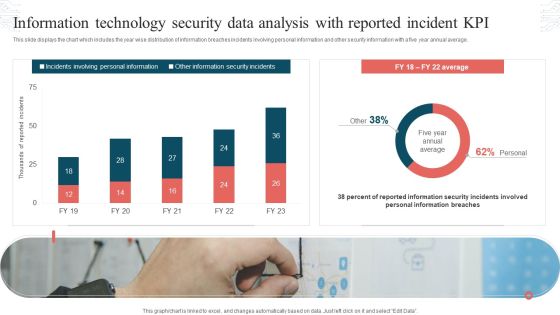
Information Technology Security Data Analysis With Reported Incident KPI Download PDF
This slide displays the chart which includes the year wise distribution of information breaches incidents involving personal information and other security information with a five year annual average. Showcasing this set of slides titled Information Technology Security Data Analysis With Reported Incident KPI Download PDF. The topics addressed in these templates are Incidents Involving, Personal Information, Other Information, Security Incidents. All the content presented in this PPT design is completely editable. Download it and make adjustments in color, background, font etc. as per your unique business setting.
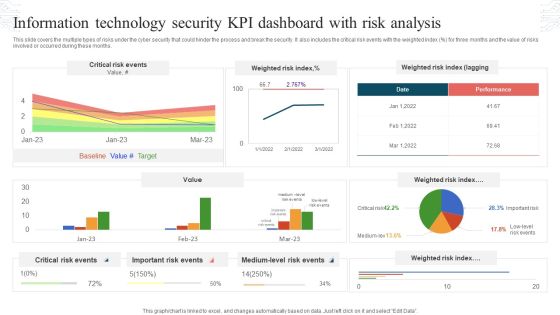
Information Technology Security KPI Dashboard With Risk Analysis Topics PDF
This slide covers the multiple types of risks under the cyber security that could hinder the process and break the security. It also includes the critical risk events with the weighted index percent for three months and the value of risks involved or occurred during these months. Showcasing this set of slides titled Information Technology Security KPI Dashboard With Risk Analysis Topics PDF. The topics addressed in these templates are Critical Risk Events, Weighted Risk Index, Important Risk Events. All the content presented in this PPT design is completely editable. Download it and make adjustments in color, background, font etc. as per your unique business setting.

Information Technology Security Team Analytics Dashboard With KPI Themes PDF
This slide elaborates about the number of incidents that have taken place in cyber security and the malware types with per incident. It also includes the number of open and resolved ticked. Showcasing this set of slides titled Information Technology Security Team Analytics Dashboard With KPI Themes PDF. The topics addressed in these templates are Open Incidents, Resolved Incidents, Open Tickets, Resolved Tickets. All the content presented in this PPT design is completely editable. Download it and make adjustments in color, background, font etc. as per your unique business setting.
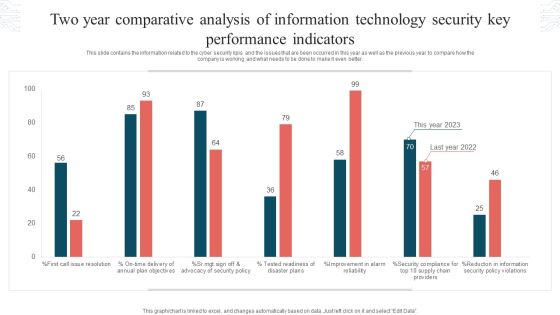
Two Year Comparative Analysis Of Information Technology Security Key Performance Indicators Graphics PDF
This slide contains the information related to the cyber security kpis and the issues that are been occurred in this year as well as the previous year to compare how the company is working and what needs to be done to make it even better. Showcasing this set of slides titled Two Year Comparative Analysis Of Information Technology Security Key Performance Indicators Graphics PDF. The topics addressed in these templates are Tested Readiness, Disaster Plans, Security Policy Violations. All the content presented in this PPT design is completely editable. Download it and make adjustments in color, background, font etc. as per your unique business setting.

Information Technology Operations Operations Dashboard For Issues Management Infographics PDF
The slide illustrates various KPIs to manage and track IT operations in business. Various elements included in the dashboard are month-wise issue status, types of issues, average resolution time, overall status and resolved issues. Showcasing this set of slides titled Information Technology Operations Operations Dashboard For Issues Management Infographics PDF. The topics addressed in these templates are Information Technology Operations, Operations Dashboard, Issues Management. All the content presented in this PPT design is completely editable. Download it and make adjustments in color, background, font etc. as per your unique business setting.
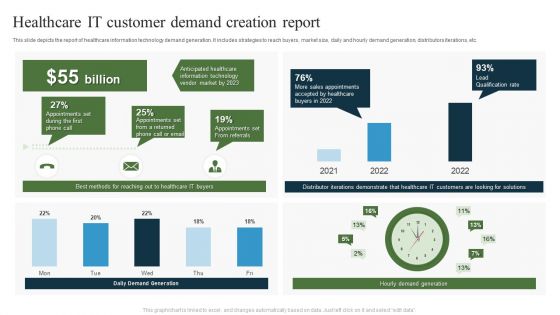
Healthcare IT Customer Demand Creation Report Ppt Gallery Graphics Download PDF
This slide depicts the report of healthcare information technology demand generation. It includes strategies to reach buyers, market size, daily and hourly demand generation, distributors iterations, etc. Showcasing this set of slides titled Healthcare IT Customer Demand Creation Report Ppt Gallery Graphics Download PDF. The topics addressed in these templates are Distributor Iterations Demonstrate, Healthcare IT Customers, Anticipated Healthcare. All the content presented in this PPT design is completely editable. Download it and make adjustments in color, background, font etc. as per your unique business setting.

KPI Dashboard For ESO System Ppt PowerPoint Presentation File Template PDF
This slide covers kpi dashboard for enterprise security operations. It involves details such as active alerts, active automated investigation, devices with major issues and report of daily devices. Pitch your topic with ease and precision using this KPI Dashboard For ESO System Ppt PowerPoint Presentation File Template PDF. This layout presents information on Security Health, Misconfigured, Service Operating Normally. It is also available for immediate download and adjustment. So, changes can be made in the color, design, graphics or any other component to create a unique layout.

ESO System Incident Management KPI Dashboard Ppt PowerPoint Presentation File Graphic Images PDF
This slide covers enterprise security operation incident management kpi dashboard. It involves details such as average resolution time, new incidents, incident status and new incidents by category. Pitch your topic with ease and precision using this ESO System Incident Management KPI Dashboard Ppt PowerPoint Presentation File Graphic Images PDF. This layout presents information on Average Resolution Time, Incident Status, New Incidents. It is also available for immediate download and adjustment. So, changes can be made in the color, design, graphics or any other component to create a unique layout.

Capital Raised With Initial Public Offering Download PDF
This slide showcase evolution of number of IPOs and capital raised . It include breakdown, north America leads and exchange growth rate. Showcasing this set of slides titled Capital Raised With Initial Public Offering Download PDF. The topics addressed in these templates are Capital Raised, With Initial, Public Offering. All the content presented in this PPT design is completely editable. Download it and make adjustments in color, background, font etc. as per your unique business setting.

Counts Of Initial Public Offering In Listing Exchange Topics PDF
Showcasing this set of slides titled Counts Of Initial Public Offering In Listing Exchange Topics PDF. The topics addressed in these templates are Counts Of Initial, Public Offering, In Listing Exchange All the content presented in this PPT design is completely editable. Download it and make adjustments in color, background, font etc. as per your unique business setting.
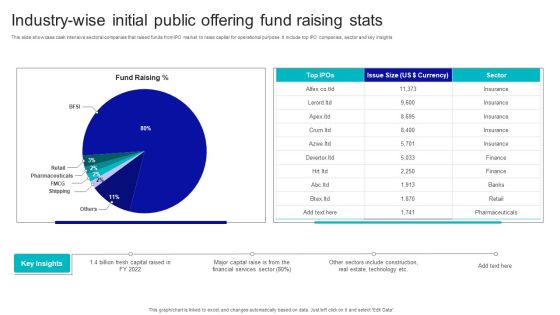
Industry Wise Initial Public Offering Fund Raising Stats Demonstration PDF
This slide showcase cash intensive sectoral companies that raised funds from IPO market to raise capital for operational purpose. It include top IPO companies, sector and key insights. Pitch your topic with ease and precision using this Industry Wise Initial Public Offering Fund Raising Stats Demonstration PDF. This layout presents information on Industry Wise Initial, Public Offering, Fund Raising Stats. It is also available for immediate download and adjustment. So, changes can be made in the color, design, graphics or any other component to create a unique layout.

Digital Twin Tech IT Dashboard For Our Successful Digital Twin Model Microsoft PDF
This slide represents the digital twin technology dashboard that covers the details of the city, such as the status of CCTVs, buses, street lights, environment sensors, and so on. Do you have an important presentation coming up Are you looking for something that will make your presentation stand out from the rest Look no further than Digital Twin Tech IT Dashboard For Our Successful Digital Twin Model Microsoft PDF. With our professional designs, you can trust that your presentation will pop and make delivering it a smooth process. And with Slidegeeks, you can trust that your presentation will be unique and memorable. So why wait Grab Digital Twin Tech IT Dashboard For Our Successful Digital Twin Model Microsoft PDF today and make your presentation stand out from the rest.
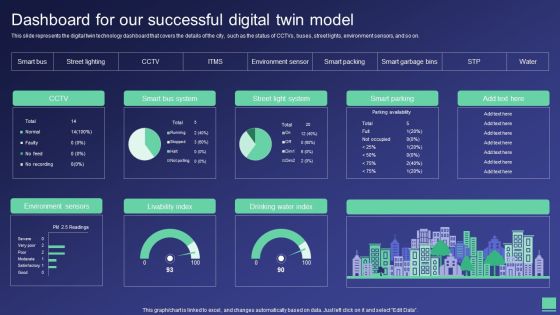
Digital Twin Tech IT Dashboard For Our Successful Digital Twin Model Ppt Layouts Grid PDF
This slide represents the digital twin technology dashboard that covers the details of the city, such as the status of CCTVs, buses, street lights, environment sensors, and so on. Boost your pitch with our creative Digital Twin Tech IT Dashboard For Our Successful Digital Twin Model Ppt Layouts Grid PDF. Deliver an awe-inspiring pitch that will mesmerize everyone. Using these presentation templates you will surely catch everyones attention. You can browse the ppts collection on our website. We have researchers who are experts at creating the right content for the templates. So you dont have to invest time in any additional work. Just grab the template now and use them.
Fundamentals Of Reinforcement Performance Tracking Dashboard For Reinforcement Elements PDF
This slide represents the performance tracking dashboard for the reinforcement learning model based on different time frames and categories. Make sure to capture your audiences attention in your business displays with our gratis customizable Fundamentals Of Reinforcement Performance Tracking Dashboard For Reinforcement Elements PDF. These are great for business strategies, office conferences, capital raising or task suggestions. If you desire to acquire more customers for your tech business and ensure they stay satisfied, create your own sales presentation with these plain slides.

Fundamentals Of Reinforcement Reinforcement Learning In Marketing Industry Introduction PDF
This slide outlines the application of reinforcement learning in marketing to overcome the problem of finding the correct audience and higher returns on investment. It provides a real-time display as impressions, profit margins, and so on. The Fundamentals Of Reinforcement Reinforcement Learning In Marketing Industry Introduction PDF is a compilation of the most recent design trends as a series of slides. It is suitable for any subject or industry presentation, containing attractive visuals and photo spots for businesses to clearly express their messages. This template contains a variety of slides for the user to input data, such as structures to contrast two elements, bullet points, and slides for written information. Slidegeeks is prepared to create an impression.
Employees Attrition Tracking Rate Stats Summary Report By Departments Slides PDF
This slide illustrates employees quarterly turnover rates for different departments. It also includes turnover rates on the basis of distinct positions and duration of retention in company. Showcasing this set of slides titled Employees Attrition Tracking Rate Stats Summary Report By Departments Slides PDF. The topics addressed in these templates are Employee Turnover, Involuntary. All the content presented in this PPT design is completely editable. Download it and make adjustments in color, background, font etc. as per your unique business setting.
Employees Attrition Tracking Statistics And Resignation Rate Report By Industry Background PDF
This slide covers dashboard for industry wise employees turnover rates. It further includes statistics on resignation rare of workers, average turnover rates for different industries. Pitch your topic with ease and precision using this Employees Attrition Tracking Statistics And Resignation Rate Report By Industry Background PDF. This layout presents information on Employees, Industry, Average Turnover Rate. It is also available for immediate download and adjustment. So, changes can be made in the color, design, graphics or any other component to create a unique layout.
HR Manager KPI Dashboard With Employee Attrition Tracking Report Brochure PDF
This slide covers performance key indicators for HR manager. It also indicates employee turnover count, new recruitment, retention, training and development of new employees. Showcasing this set of slides titled HR Manager KPI Dashboard With Employee Attrition Tracking Report Brochure PDF. The topics addressed in these templates are Recruitment, Employee Turnover, Development. All the content presented in this PPT design is completely editable. Download it and make adjustments in color, background, font etc. as per your unique business setting.
Impact Survey Report Of Employee Attrition Tracking On Team Operations Demonstration PDF
This slide covers key factors having high impact on day to day team operations. It includes areas such as delay in project delivery, loss of productivity, rehiring cost and on boarding a replacement, low team morale, stress issues, legal and HR related issues. Pitch your topic with ease and precision using this Impact Survey Report Of Employee Attrition Tracking On Team Operations Demonstration PDF. This layout presents information on Employees Turnover, Project, Cost. It is also available for immediate download and adjustment. So, changes can be made in the color, design, graphics or any other component to create a unique layout.
Parameters Impacting Employee Attrition Tracking Rates Report Sample PDF
This slide depicts key reasons for employee turnover rate. It includes career development, work-life balance, management behaviour, compensation, wellbeing, job characteristics, work environment, relocation and retirement. Showcasing this set of slides titled Parameters Impacting Employee Attrition Tracking Rates Report Sample PDF. The topics addressed in these templates are Parameters Impacting Employee, Attrition Tracking Rates Report. All the content presented in this PPT design is completely editable. Download it and make adjustments in color, background, font etc. as per your unique business setting.
Report On Cost Of High Restaurant Attrition Tracking With Key Insights Topics PDF
This slide depicts breakdown of cost incurred due to restaurant employees turnover. It includes components such as productivity loss, recruitment costs, selection costs, pre-departure costs, orientation and training costs, along with turnover rates, cost per churned employee, total annual cost. Pitch your topic with ease and precision using this Report On Cost Of High Restaurant Attrition Tracking With Key Insights Topics PDF. This layout presents information on Average Turnover Cost, Employee, Productivity. It is also available for immediate download and adjustment. So, changes can be made in the color, design, graphics or any other component to create a unique layout.
Sales Attrition Tracking Report With Revenue And Customer Churn Analytics Formats PDF
This slide covers dashboard depicting total annual sales in company. It includes key components such as revenue, profit margins, cost incurred, cost breakdown, up sell and churn trends. Showcasing this set of slides titled Sales Attrition Tracking Report With Revenue And Customer Churn Analytics Formats PDF. The topics addressed in these templates are Revenue, Number Of Sales, Profit, Cost. All the content presented in this PPT design is completely editable. Download it and make adjustments in color, background, font etc. as per your unique business setting.
Staff Productivity And Attrition Tracking Rate Statistical Report Ideas PDF
This slide covers dashboard for employees productivity stats. It further includes stats for absence rates, cost incurred, benefits derived, satisfaction index, net promoter score, turnover and promotion rates. Pitch your topic with ease and precision using this Staff Productivity And Attrition Tracking Rate Statistical Report Ideas PDF. This layout presents information on Absence Cost, Benefits Satisfaction, Productivity Rate. It is also available for immediate download and adjustment. So, changes can be made in the color, design, graphics or any other component to create a unique layout.
Survey Report On Global Voluntary Attrition Tracking By Function Background PDF
This slide depicts survey outcomes on turnover rates based on different functions. It includes survey based on multiple functions such as IT, legal, R and D, public sector, customer support, marketing, HR, sales and finance. along with overall global rates. Showcasing this set of slides titled Survey Report On Global Voluntary Attrition Tracking By Function Background PDF. The topics addressed in these templates are Finance Function, Global Turnover Rates. All the content presented in this PPT design is completely editable. Download it and make adjustments in color, background, font etc. as per your unique business setting.

Global Market Scenario Of Building Management Services Ppt Pictures Layouts PDF
This slide highlights the facility management services market share and future growth rate in different geographies. It showcases growth of organized and unorganized facility management services. Showcasing this set of slides titled Global Market Scenario Of Building Management Services Ppt Pictures Layouts PDF. The topics addressed in these templates are Facility Management, Global Market Share, Facility Management Future, Growth Rate. All the content presented in this PPT design is completely editable. Download it and make adjustments in color, background, font etc. as per your unique business setting.
Issues Tracking Dashboard For Organizational Building Management Ppt Infographics Topics PDF
This slide showcases dashboard which can help organization to keep track of issues plus faults during facility management and rectify them within stipulated time. Its key elements are issues reported, fault tracking, etc. Pitch your topic with ease and precision using this Issues Tracking Dashboard For Organizational Building Management Ppt Infographics Topics PDF. This layout presents information on Fault Tracking, Issues Reported, Location. It is also available for immediate download and adjustment. So, changes can be made in the color, design, graphics or any other component to create a unique layout.

Building Management Dashboard Highlighting Power Consumption And Occupancy Rate Template PDF
This slide showcases dashboard that can help organization to keep track of power consumed by machinery and occupancy rate during facility management. Its key components are HVAC, occupancy rate, service requests and temperature. Pitch your topic with ease and precision using this Building Management Dashboard Highlighting Power Consumption And Occupancy Rate Template PDF. This layout presents information on Lighting, Power, Water, Electricity, Temperature. It is also available for immediate download and adjustment. So, changes can be made in the color, design, graphics or any other component to create a unique layout.

Organizational Change Management Process Flow Dashboard Ppt PowerPoint Presentation Diagram PDF
This slide covers Business change management lifecycle dashboard. It involves overall health, customer data, financials and operational efficiency. Pitch your topic with ease and precision using this Organizational Change Management Process Flow Dashboard Ppt PowerPoint Presentation Diagram PDF. This layout presents information on Financial Data, Operational Efficiency, Consumer Data. It is also available for immediate download and adjustment. So, changes can be made in the color, design, graphics or any other component to create a unique layout.
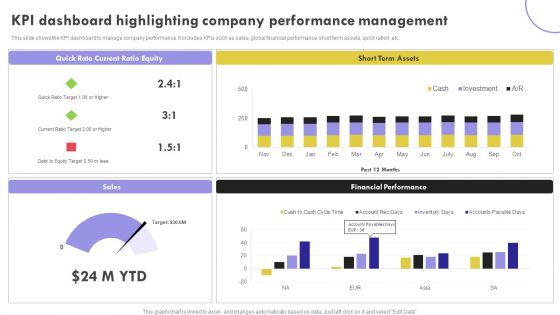
KPI Dashboard Highlighting Company Performance Management Inspiration PDF
This slide shows the KPI dashboard to manage company performance. It includes KPIs such as sales, global financial performance, short term assets, quick ration, etc.Showcasing this set of slides titled KPI Dashboard Highlighting Company Performance Management Inspiration PDF. The topics addressed in these templates are Current Ratio, Term Assets, Financial Performance. All the content presented in this PPT design is completely editable. Download it and make adjustments in color, background, font etc. as per your unique business setting.
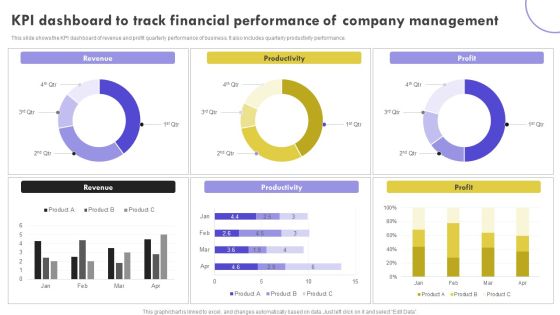
KPI Dashboard To Track Financial Performance Of Company Management Clipart PDF
This slide shows the KPI dashboard of revenue and profit quarterly performance of business. It also includes quarterly productivity performance. Pitch your topic with ease and precision using this KPI Dashboard To Track Financial Performance Of Company Management Clipart PDF. This layout presents information on Revenue, Productivity, Profit. It is also available for immediate download and adjustment. So, changes can be made in the color, design, graphics or any other component to create a unique layout.

Customer And Product Sales Performance Comparison Matrix Introduction PDF
This slide shows client and product sales Performance comparison matrix. It includes top products and Customer of the organization. Showcasing this set of slides titled Customer And Product Sales Performance Comparison Matrix Introduction PDF. The topics addressed in these templates are Top Products, Top Customers, Sales. All the content presented in this PPT design is completely editable. Download it and make adjustments in color, background, font etc. as per your unique business setting.

KPI Dashboard Of Customer And Product Sales Performance Comparison Information PDF
This slide shows the KPI dashboard of client and product sales comparison. It also includes sales by location and total sales. Pitch your topic with ease and precision using this KPI Dashboard Of Customer And Product Sales Performance Comparison Information PDF. This layout presents information on Product Sales, Client Sales, Tim Santana. It is also available for immediate download and adjustment. So, changes can be made in the color, design, graphics or any other component to create a unique layout.
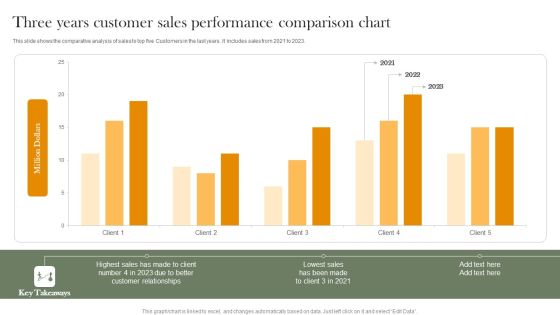
Three Years Customer Sales Performance Comparison Chart Professional PDF
This slide shows the comparative analysis of sales to top five Customers in the last years. It includes sales from 2021 to 2023. Pitch your topic with ease and precision using this Three Years Customer Sales Performance Comparison Chart Professional PDF. This layout presents information on Highest Sales, Customer Relationships, Lowest Sales. It is also available for immediate download and adjustment. So, changes can be made in the color, design, graphics or any other component to create a unique layout.

Actual And Forecasted E Commerce Revenue Analysis Comparison Clipart PDF
This slide shows the comparison between actual and forecasted revenue of e-commerce company products. Showcasing this set of slides titled Actual And Forecasted E Commerce Revenue Analysis Comparison Clipart PDF. The topics addressed in these templates are Actual Revenue, Forecasted Revenue, Bearish Market. All the content presented in this PPT design is completely editable. Download it and make adjustments in color, background, font etc. as per your unique business setting.

KPI Dashboard To Monitor E Commerce Revenue Analysis Performance Mockup PDF
This slide shows the key performance indicators dashboard which can be used to analyze current financial position of e-commerce business. It includes metrics such as revenue, expenses, profit, cash in hand, etc. Showcasing this set of slides titled KPI Dashboard To Monitor E Commerce Revenue Analysis Performance Mockup PDF. The topics addressed in these templates are Accounts Receivable, Accounts Payable, Revenue, Expenses. All the content presented in this PPT design is completely editable. Download it and make adjustments in color, background, font etc. as per your unique business setting.

KPI Dashboard To Track E Commerce Business Revenue Analysis Rules PDF
This slide shows dashboard which can be used by organizations to monitor ecommerce revenue analysis. It includes metrics such as orders, purchases, delivery status etc. Pitch your topic with ease and precision using this KPI Dashboard To Track E Commerce Business Revenue Analysis Rules PDF. This layout presents information on Total Purchases, Total Sales, Pending Delivery, Collection. It is also available for immediate download and adjustment. So, changes can be made in the color, design, graphics or any other component to create a unique layout.
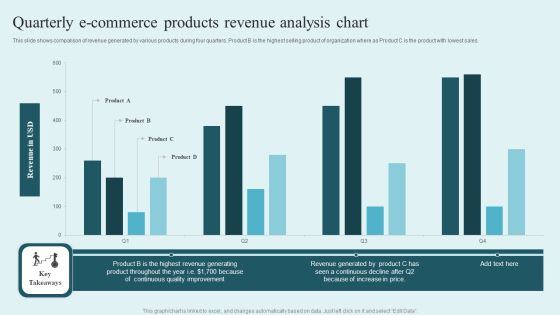
Quarterly E Commerce Products Revenue Analysis Chart Guidelines PDF
This slide shows comparison of revenue generated by various products during four quarters. Product B is the highest selling product of organization where as Product C is the product with lowest sales. Showcasing this set of slides titled Quarterly E Commerce Products Revenue Analysis Chart Guidelines PDF. The topics addressed in these templates are Revenue USD, Product, Continuous Quality Improvement. All the content presented in this PPT design is completely editable. Download it and make adjustments in color, background, font etc. as per your unique business setting.

Effect Of Technology In Financial Services Industry Ppt Outline Design Templates PDF
This slide cover the different impacts of technology on the various activities of the business. It also shows the SaaS - powered technology use by the company. Showcasing this set of slides titled Effect Of Technology In Financial Services Industry Ppt Outline Design Templates PDF. The topics addressed in these templates are Equity Loan Hardware, Technology Advancement, Highest Number. All the content presented in this PPT design is completely editable. Download it and make adjustments in color, background, font etc. as per your unique business setting.
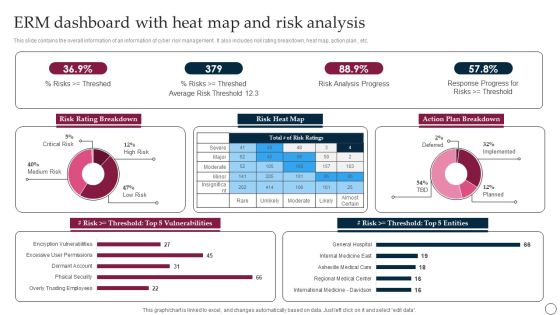
ERM Dashboard With Heat Map And Risk Analysis Ppt PowerPoint Presentation File Backgrounds PDF
This slide contains the overall information of an information of cyber risk management . It also includes risk rating breakdown, heat map, action plan , etc. Showcasing this set of slides titled ERM Dashboard With Heat Map And Risk Analysis Ppt PowerPoint Presentation File Backgrounds PDF. The topics addressed in these templates are Risk Rating Breakdown, Average Risk, Risk Analysis Progress. All the content presented in this PPT design is completely editable. Download it and make adjustments in color, background, font etc. as per your unique business setting.

Market Analysis Of Smart Farming Tech With Growth Drivers Template PDF
The following slide highlights smart farming tech market analysis with growth drivers to measure progress and track performance. It include growth drivers such as increase demand of weather monitoring system, increase in human resource investment and key insights such as estimated market value, forecasted revenue etc.Pitch your topic with ease and precision using this Market Analysis Of Smart Farming Tech With Growth Drivers Template PDF. This layout presents information on Estimated Growth, Estimated Market Value, Forecasted Revenue. It is also available for immediate download and adjustment. So, changes can be made in the color, design, graphics or any other component to create a unique layout.

Human Resource Audit System Functional Analysis Dashboard Sample PDF
This slide defines the dashboard analyzing the human resource HR audit based on the headcount. It includes information related to the gender wise position, monthly and function based headcount. Showcasing this set of slides titled Human Resource Audit System Functional Analysis Dashboard Sample PDF. The topics addressed in these templates are Human Resource Audit System, Functional Analysis Dashboard. All the content presented in this PPT design is completely editable. Download it and make adjustments in color, background, font etc. as per your unique business setting.

SEO Marketing Dashboard To Measure Integrated Marketing Communication Campaign Efficiency Brochure PDF
This slide covers SEO marketing KPI dashboard to measure IMC campaign efficiency. It involves data such as sessions from organic, organic sessions by source, organic conversion, pages per sessions from organic. Showcasing this set of slides titled SEO Marketing Dashboard To Measure Integrated Marketing Communication Campaign Efficiency Brochure PDF. The topics addressed in these templates are Sessions Organic, Organic Session Source, Previous Period, Organic Revenue. All the content presented in this PPT design is completely editable. Download it and make adjustments in color, background, font etc. as per your unique business setting.
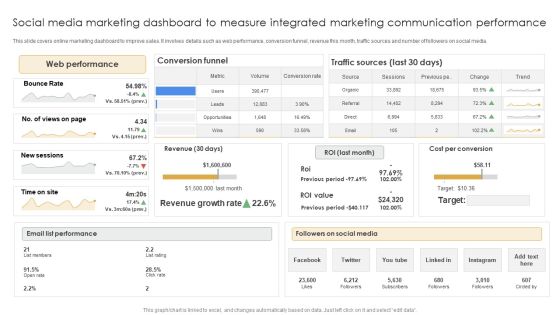
Social Media Marketing Dashboard To Measure Integrated Marketing Communication Performance Clipart PDF
This slide covers online marketing dashboard to improve sales. It involves details such as web performance, conversion funnel, revenue this month, traffic sources and number of followers on social media. Pitch your topic with ease and precision using this Social Media Marketing Dashboard To Measure Integrated Marketing Communication Performance Clipart PDF. This layout presents information on Web Performance, Email List Performance, Followers Social Media. It is also available for immediate download and adjustment. So, changes can be made in the color, design, graphics or any other component to create a unique layout.

Cash Management Dashboard With Sales Outstanding And Liquidity Ratio Analysis Information PDF
This showcases dashboard that can help organization in cash management and track KPIs to evaluate the financial performance of company. It key components are liquidity ratios, cash balance. days sales outstanding, days inventory outstanding and days payable outstanding. Pitch your topic with ease and precision using this Cash Management Dashboard With Sales Outstanding And Liquidity Ratio Analysis Information PDF. This layout presents information on Cash Conversion, Working Capital, Cash Balance. It is also available for immediate download and adjustment. So, changes can be made in the color, design, graphics or any other component to create a unique layout.

Financial KPI Dashboard With Liquidity Ratio Analysis And Current Assets Breakdown Ideas PDF
This showcases KPI dashboard the can help organization to evaluate the financial performance and analyze the liquidity ratios. Its key components are vendor payment error rate, budget variance and cash conversion cycle. Showcasing this set of slides titled. The topics addressed in these templates are Quick Status, Workning Capital, Budget Variance. All the content presented in this PPT design is completely editable. Download it and make adjustments in color, background, font etc. as per your unique business setting.
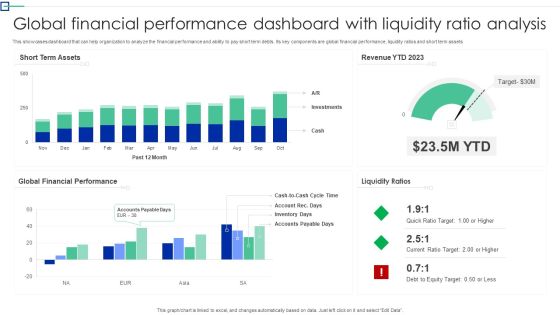
Global Financial Performance Dashboard With Liquidity Ratio Analysis Information PDF
This showcases dashboard that can help organization to analyze the financial performance and ability to pay short term debts. Its key components are global financial performance, liquidity ratios and short term assets. Pitch your topic with ease and precision using this Global Financial Performance Dashboard With Liquidity Ratio Analysis Information PDF. This layout presents information on Short Term Assets, Global Financial Performance, Liquidity Ratios. It is also available for immediate download and adjustment. So, changes can be made in the color, design, graphics or any other component to create a unique layout.
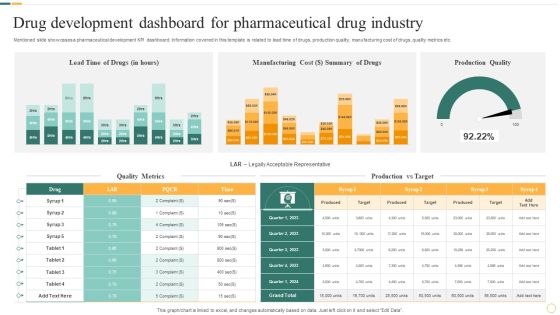
Drug Development Dashboard For Pharmaceutical Drug Industry Portrait PDF
Mentioned slide showcases a pharmaceutical development KPI dashboard. Information covered in this template is related to lead time of drugs, production quality, manufacturing cost of drugs, quality metrics etc. Showcasing this set of slides titled Drug Development Dashboard For Pharmaceutical Drug Industry Portrait PDF. The topics addressed in these templates are Manufacturing Cost, Summary Of Drugs, Production Quality. All the content presented in this PPT design is completely editable. Download it and make adjustments in color, background, font etc. as per your unique business setting.
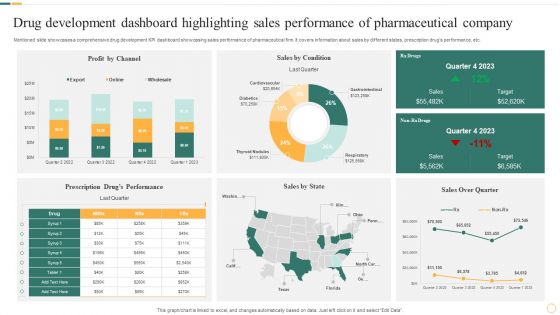
Drug Development Dashboard Highlighting Sales Performance Of Pharmaceutical Company Microsoft PDF
Mentioned slide showcases a comprehensive drug development KPI dashboard showcasing sales performance of pharmaceutical firm. It covers information about sales by different states, prescription drugs performance, etc. Pitch your topic with ease and precision using this Drug Development Dashboard Highlighting Sales Performance Of Pharmaceutical Company Microsoft PDF. This layout presents information on Sales By Condition, Profit By Channel, Sales By State. It is also available for immediate download and adjustment. So, changes can be made in the color, design, graphics or any other component to create a unique layout.
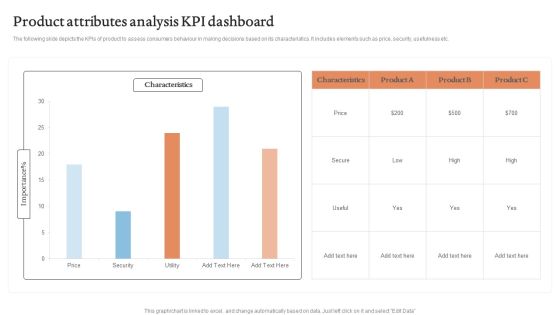
Product Attributes Analysis KPI Dashboard Graphics PDF
The following slide depicts the KPIs of product to assess consumers behaviour in making decisions based on its characteristics. It includes elements such as price, security, usefulness etc.Showcasing this set of slides titled Product Attributes Analysis KPI Dashboard Graphics PDF. The topics addressed in these templates are Characteristics, Product Attributes, Analysis KPI Dashboard. All the content presented in this PPT design is completely editable. Download it and make adjustments in color, background, font etc. as per your unique business setting.
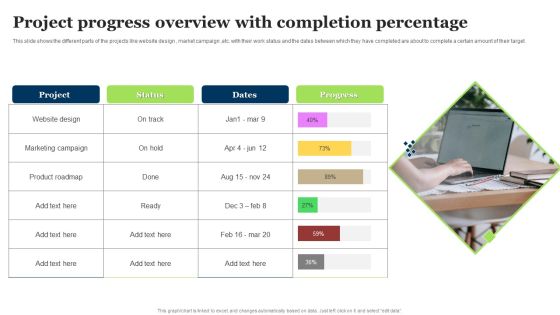
Project Progress Overview With Completion Percentage Ppt Inspiration Format Ideas PDF
This slide covers the month wise status of multiple projects for better management without any chaos or confusion. It also shows the status category that means whether there are new projects, in progress, completed , on hold or cancelled. Showcasing this set of slides titled Project Progress Overview With Completion Percentage Ppt Inspiration Format Ideas PDF. The topics addressed in these templates are Project, Marketing Campaign, Product Roadmap. All the content presented in this PPT design is completely editable. Download it and make adjustments in color, background, font etc. as per your unique business setting.
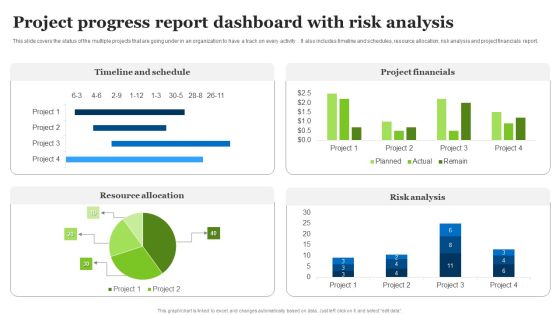
Project Progress Report Dashboard With Risk Analysis Ppt Examples PDF
This slide covers the status of the multiple projects that are going under in an organization to have a track on every activity . It also includes timeline and schedules, resource allocation, risk analysis and project financials report. Pitch your topic with ease and precision using this Project Progress Report Dashboard With Risk Analysis Ppt Examples PDF. This layout presents information on Timeline And Schedule, Project Financials, Risk Analysis. It is also available for immediate download and adjustment. So, changes can be made in the color, design, graphics or any other component to create a unique layout.
Software Business Management Project Progress Ppt Show Icon PDF
This slide covers the project report on software with planning and building status . It also includes start and finish date , report date , overall status , scope , cost and effort. Pitch your topic with ease and precision using this Software Business Management Project Progress Ppt Show Icon PDF. This layout presents information on Overall Status Summary, Planning, Building. It is also available for immediate download and adjustment. So, changes can be made in the color, design, graphics or any other component to create a unique layout.

Project Overview Dashboard With Budget And Task Completion Progress Slides PDF
This slide elaborates about the project of the web development and its status on every step with budget allocation and the number of tasks completed or will be completing in certain amount of time. Showcasing this set of slides titled Project Overview Dashboard With Budget And Task Completion Progress Slides PDF. The topics addressed in these templates are Project Title, Budget, Risks. All the content presented in this PPT design is completely editable. Download it and make adjustments in color, background, font etc. as per your unique business setting.

Project Progress Dashboard With Timeline And Budget Mockup PDF
This slide covers the tasks to be given and their status whether they are completed or on hold , progressing and overdue. It also includes the task priority chart, budget and pending items with task timeline. Pitch your topic with ease and precision using this Project Progress Dashboard With Timeline And Budget Mockup PDF. This layout presents information on Task Timeline, Project Status, Pending Items. It is also available for immediate download and adjustment. So, changes can be made in the color, design, graphics or any other component to create a unique layout.
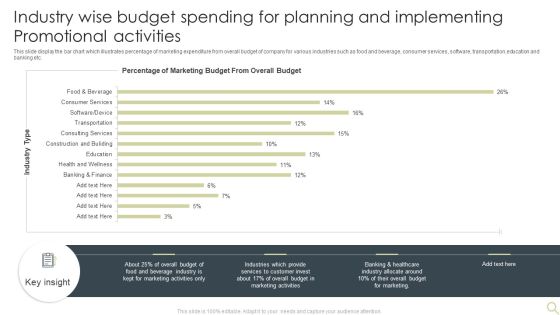
Industry Wise Budget Spending For Planning And Implementing Promotional Activities Introduction PDF
This slide display the bar chart which illustrates percentage of marketing expenditure from overall budget of company for various industries such as food and beverage, consumer services, software, transportation,education and banking etc. Showcasing this set of slides titled Industry Wise Budget Spending For Planning And Implementing Promotional Activities Introduction PDF. The topics addressed in these templates are Marketing, Beverage Industry, Budget. All the content presented in this PPT design is completely editable. Download it and make adjustments in color, background, font etc. as per your unique business setting.

KPI Dashboard To Track Performance Of Online Promotional Budget Plan Inspiration PDF
This slide enables to monitor quarterly performance and return on marketing expenditure of digital marketing executed by an organization. It includes source wise performance report , return on investment, sales funnel , average order value report etc. Pitch your topic with ease and precision using this KPI Dashboard To Track Performance Of Online Promotional Budget Plan Inspiration PDF. This layout presents information on Average Order Value, Return On Investment, Sales. It is also available for immediate download and adjustment. So, changes can be made in the color, design, graphics or any other component to create a unique layout.

Promotional Budget Plan Analysis Dashboard For Startups Template PDF
This slide provides a dashboard for analysis of marketing budget plan that can be used by managers to optimize their advertisement strategies. It displays the comparison of total marketing budget of different companies, ROI, marketing campaign analysis and program budgets. Showcasing this set of slides titled Promotional Budget Plan Analysis Dashboard For Startups Template PDF. The topics addressed in these templates are Marketing Budget, Marketing Campaign, Competitive Analysis. All the content presented in this PPT design is completely editable. Download it and make adjustments in color, background, font etc. as per your unique business setting.

Promotional Budget Plan For Manufacturing Firm Information PDF
This slide showcase the allocation of monthly budget for various dimension of product manufacturing and marketing process. It includes budget for Face to face F2F marketing ,banner advertising, cost of hiring sales executives, managing events and promotions, SEO etc. Pitch your topic with ease and precision using this Promotional Budget Plan For Manufacturing Firm Information PDF. This layout presents information on Marketing, Budget, Sales Personnel. It is also available for immediate download and adjustment. So, changes can be made in the color, design, graphics or any other component to create a unique layout.
Scrum Task Project Management And Tracking Dashboard Elements PDF
The following slide showcases tracking dashboard for scrum project management. It includes information about weekly tracking, overall completion, start and end date, remaining days, sprints, status productivity, engaged users, etc. Showcasing this set of slides titled Scrum Task Project Management And Tracking Dashboard Elements PDF. The topics addressed in these templates are Tracking Dashboard, Scrum Task Project Management. All the content presented in this PPT design is completely editable. Download it and make adjustments in color, background, font etc. as per your unique business setting.

Scrum Task Project Management Dashboard Information PDF
The following slide demonstrates scrum project task management dashboard. It includes information about sprint velocity, scope changes, tasks category, tasks progress, planned, finished, added, removed, bug, story, etc. Pitch your topic with ease and precision using this Scrum Task Project Management Dashboard Information PDF. This layout presents information on Scrum Task Project, Management Dashboard. It is also available for immediate download and adjustment. So, changes can be made in the color, design, graphics or any other component to create a unique layout.

Emerging Technology Selling Forecasts Report Clipart PDF
This slide covers sales projections for consumer tech products. It includes unit sales for devices such wearable devices, smart speakers, smart home, 4K ultra televisions, virtual reality devices and drones along with percentage of unit sales growth and revenue projections. Showcasing this set of slides titled Emerging Technology Selling Forecasts Report Clipart PDF. The topics addressed in these templates are Emerging Technology Selling Forecasts, Market. All the content presented in this PPT design is completely editable. Download it and make adjustments in color, background, font etc. as per your unique business setting.

Selling Forecasts Dashboard With Revenue Predictions Elements PDF
This slide covers estimated sales projections based on different regions. It includes elements such as potential revenue and predicted revenue, predicted risks, sales forecasted by agents , etc. Showcasing this set of slides titled Selling Forecasts Dashboard With Revenue Predictions Elements PDF. The topics addressed in these templates are Forecasted Value, Potential Revenue, Predicted Risk. All the content presented in this PPT design is completely editable. Download it and make adjustments in color, background, font etc. as per your unique business setting.

Team Selling Forecasts And Deal Conversion Report Themes PDF
This slide covers sales projections for multiple employees in a team. It includes elements such employee names, sales progress bars, closed sales revenue, planned and projected sales revenue. Pitch your topic with ease and precision using this Team Selling Forecasts And Deal Conversion Report Themes PDF. This layout presents information on Sales Progress, Employee, Team Selling Forecasts. It is also available for immediate download and adjustment. So, changes can be made in the color, design, graphics or any other component to create a unique layout.

Smartphone App Analytics Services Comparison Brochure PDF
This slide shows market share of various app analytics to understand customer behavior. It includes analytics such as google analytics, flurry analytics, facebook analytics, fabric, and mixpanel. Pitch your topic with ease and precision using this Smartphone App Analytics Services Comparison Brochure PDF. This layout presents information on Different Services Measure, Visitor Stats Differently, Provides Accurate Results. It is also available for immediate download and adjustment. So, changes can be made in the color, design, graphics or any other component to create a unique layout.
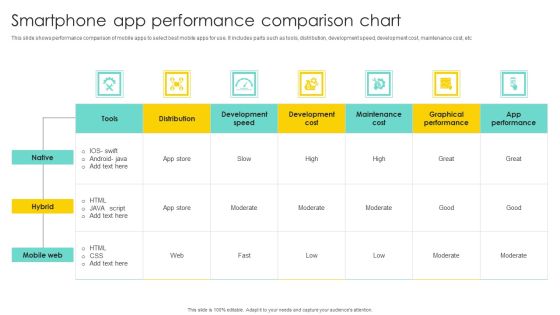
Smartphone App Performance Comparison Chart Rules PDF
Showcasing this set of slides titled Smartphone App Performance Comparison Chart Rules PDF. The topics addressed in these templates are Development Speed, Maintenance Cost, Graphical Performance. All the content presented in this PPT design is completely editable. Download it and make adjustments in color, background, font etc. as per your unique business setting.
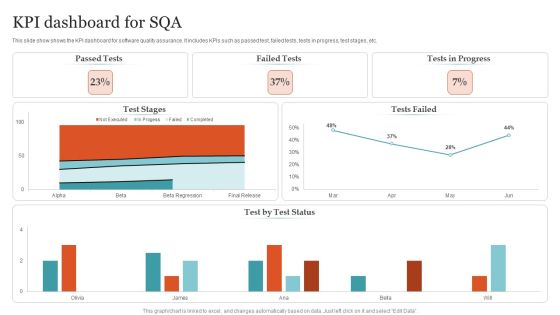
KPI Dashboard For SQA Ppt PowerPoint Presentation Gallery Structure PDF
This slide show shows the KPI dashboard for software quality assurance. It includes KPIs such as passed test, failed tests, tests in progress, test stages, etc. Pitch your topic with ease and precision using this KPI Dashboard For SQA Ppt PowerPoint Presentation Gallery Structure PDF. This layout presents information on Passed Tests, Failed Tests, Tests Progress . It is also available for immediate download and adjustment. So, changes can be made in the color, design, graphics or any other component to create a unique layout.

Target Market Assessment Process Roadmap Demonstration PDF
This slide represents the Gantt chart for target market analysis. It includes tasks such as conducting market research, identifying demographics, developing buyer persona, developing business strategy, etc. Showcasing this set of slides titled Target Market Assessment Process Roadmap Demonstration PDF. The topics addressed in these templates are Develop, Target Demographics, Target Market. All the content presented in this PPT design is completely editable. Download it and make adjustments in color, background, font etc. as per your unique business setting.

Target Market Assessment With Audience Demographics Inspiration PDF
This slide covers the dashboard for target audience analysis. It includes demographics based on gender, age, region, population density, household structure, and income. Pitch your topic with ease and precision using this Target Market Assessment With Audience Demographics Inspiration PDF. This layout presents information on Target Market Assessment, Audience Demographics . It is also available for immediate download and adjustment. So, changes can be made in the color, design, graphics or any other component to create a unique layout.
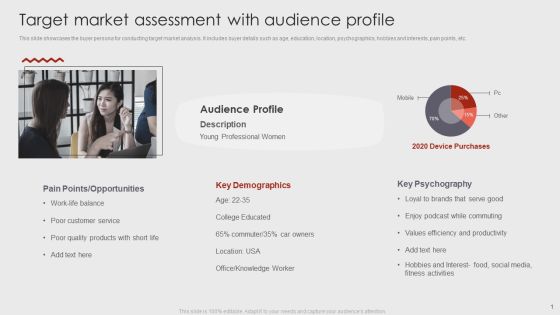
Target Market Assessment With Audience Profile Mockup PDF
This slide showcases the buyer persona for conducting target market analysis. It includes buyer details such as age, education, location, psychographics, hobbies and interests, pain points, etc. Showcasing this set of slides titled Target Market Assessment With Audience Profile Mockup PDF. The topics addressed in these templates are Opportunities, Key Demographics, Key Psychography. All the content presented in this PPT design is completely editable. Download it and make adjustments in color, background, font etc. as per your unique business setting.

Workplace Work Stress And Absenteeism Dashboard Pictures PDF
This slide illustrates facts and figures related to work stress ang high absenteeism rate. It includes top 3 workplace issues, average workdays missed, etc.Showcasing this set of slides titled Workplace Work Stress And Absenteeism Dashboard Pictures PDF. The topics addressed in these templates are Employees Reported, Workplace Issues, Highest Absenteeism. All the content presented in this PPT design is completely editable. Download it and make adjustments in color, background, font etc. as per your unique business setting.

Implementing Succession Planning Dashboard To Measure Employee Turnover Rate Mockup PDF
This slide shows a dashboard that can be used by a firm to measure its employee turnover rate at different locations. It also portraits details about annual fluctuation rate along with number of leavers. There are so many reasons you need a Implementing Succession Planning Dashboard To Measure Employee Turnover Rate Mockup PDF. The first reason is you cant spend time making everything from scratch, Thus, Slidegeeks has made presentation templates for you too. You can easily download these templates from our website easily.

Implementing Succession Planning Department Wise Analysis Of Employee Attrition Inspiration PDF
Mentioned slide illustrates headquarter wise and department wise analysis of employee attrition. It also shows information about employee exit by job role. From laying roadmaps to briefing everything in detail, our templates are perfect for you. You can set the stage with your presentation slides. All you have to do is download these easy-to-edit and customizable templates. Implementing Succession Planning Department Wise Analysis Of Employee Attrition Inspiration PDF will help you deliver an outstanding performance that everyone would remember and praise you for. Do download this presentation today.

Implementing Succession Planning Determining Employee Motivation Factors Slides PDF
Mentioned slide illustrates information about employee motivation factors along with the details about most dominating factor that impact employee performance. Slidegeeks is here to make your presentations a breeze with Implementing Succession Planning Determining Employee Motivation Factors Slides PDF With our easy-to-use and customizable templates, you can focus on delivering your ideas rather than worrying about formatting. With a variety of designs to choose from, youre sure to find one that suits your needs. And with animations and unique photos, illustrations, and fonts, you can make your presentation pop. So whether youre giving a sales pitch or presenting to the board, make sure to check out Slidegeeks first.

Implementing Succession Planning Determining The Challenges Faced In Succession Professional PDF
Following slide illustrates information about most common challenges faced by the organizations while implementing succession planning program. Do you have an important presentation coming up Are you looking for something that will make your presentation stand out from the rest Look no further than Implementing Succession Planning Determining The Challenges Faced In Succession Professional PDF. With our professional designs, you can trust that your presentation will pop and make delivering it a smooth process. And with Slidegeeks, you can trust that your presentation will be unique and memorable. So why wait Grab Implementing Succession Planning Determining The Challenges Faced In Succession Professional PDF today and make your presentation stand out from the rest.
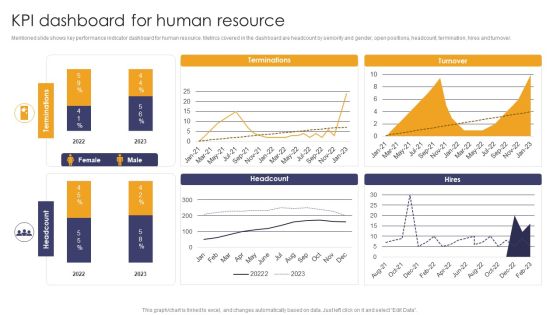
Implementing Succession Planning KPI Dashboard For Human Resource Template PDF
Mentioned slide shows key performance indicator dashboard for human resource. Metrics covered in the dashboard are headcount by seniority and gender, open positions, headcount, termination, hires and turnover. If you are looking for a format to display your unique thoughts, then the professionally designed Implementing Succession Planning KPI Dashboard For Human Resource Template PDF is the one for you. You can use it as a Google Slides template or a PowerPoint template. Incorporate impressive visuals, symbols, images, and other charts. Modify or reorganize the text boxes as you desire. Experiment with shade schemes and font pairings. Alter, share or cooperate with other people on your work. Download Implementing Succession Planning KPI Dashboard For Human Resource Template PDF and find out how to give a successful presentation. Present a perfect display to your team and make your presentation unforgettable.
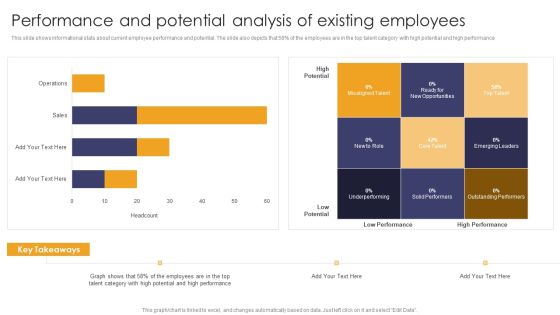
Implementing Succession Planning Performance And Potential Analysis Of Existing Infographics PDF
This slide shows informational stats about current employee performance and potential. The slide also depicts that 58 percent of the employees are in the top talent category with high potential and high performance. Crafting an eye-catching presentation has never been more straightforward. Let your presentation shine with this tasteful yet straightforward Implementing Succession Planning Performance And Potential Analysis Of Existing Infographics PDF template. It offers a minimalistic and classy look that is great for making a statement. The colors have been employed intelligently to add a bit of playfulness while still remaining professional. Construct the ideal Implementing Succession Planning Performance And Potential Analysis Of Existing Infographics PDF that effortlessly grabs the attention of your audience Begin now and be certain to wow your customers.
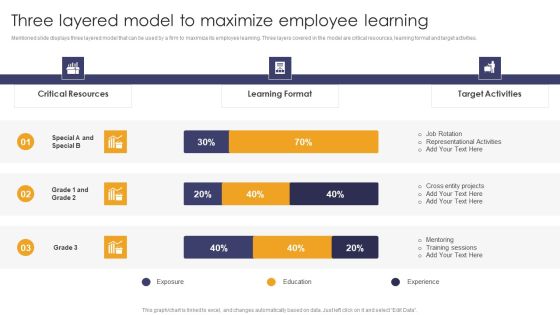
Implementing Succession Planning Three Layered Model To Maximize Employee Learning Introduction PDF
Mentioned slide displays three layered model that can be used by a firm to maximize its employee learning. Three layers covered in the model are critical resources, learning format and target activities. The Implementing Succession Planning Three Layered Model To Maximize Employee Learning Introduction PDF is a compilation of the most recent design trends as a series of slides. It is suitable for any subject or industry presentation, containing attractive visuals and photo spots for businesses to clearly express their messages. This template contains a variety of slides for the user to input data, such as structures to contrast two elements, bullet points, and slides for written information. Slidegeeks is prepared to create an impression.
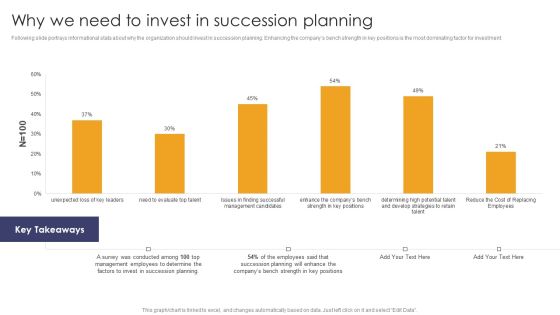
Implementing Succession Planning Why We Need To Invest In Succession Planning Portrait PDF
Following slide portrays informational stats about why the organization should invest in succession planning. Enhancing the companys bench strength in key positions is the most dominating factor for investment. Retrieve professionally designed Implementing Succession Planning Why We Need To Invest In Succession Planning Portrait PDF to effectively convey your message and captivate your listeners. Save time by selecting pre-made slideshows that are appropriate for various topics, from business to educational purposes. These themes come in many different styles, from creative to corporate, and all of them are easily adjustable and can be edited quickly. Access them as PowerPoint templates or as Google Slides themes. You dont have to go on a hunt for the perfect presentation because Slidegeeks got you covered from everywhere.
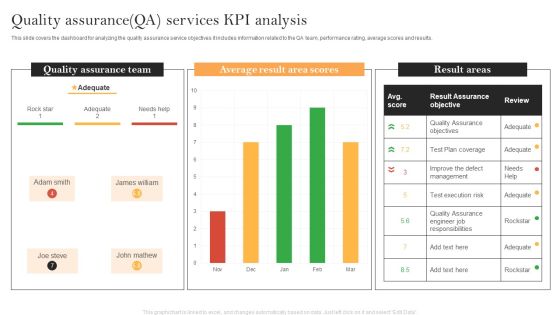
Quality Assurance QA Services KPI Analysis Demonstration PDF
This slide covers the dashboard for analyzing the quality assurance service objectives it includes information related to the QA team, performance rating, average scores and results. Showcasing this set of slides titled Quality Assurance QA Services KPI Analysis Demonstration PDF. The topics addressed in these templates are Quality Assurance Team, Average Result Area, Result Assurance Objective. All the content presented in this PPT design is completely editable. Download it and make adjustments in color, background, font etc. as per your unique business setting.

Banking Dashboard To Determine Total Loans And Deposits Information Icons PDF
Mentioned slide portrays banking dashboard providing information on total loans and deposits by region and by district. Boost your pitch with our creative Banking Dashboard To Determine Total Loans And Deposits Information Icons PDF. Deliver an awe inspiring pitch that will mesmerize everyone. Using these presentation templates you will surely catch everyones attention. You can browse the ppts collection on our website. We have researchers who are experts at creating the right content for the templates. So you do not have to invest time in any additional work. Just grab the template now and use them.
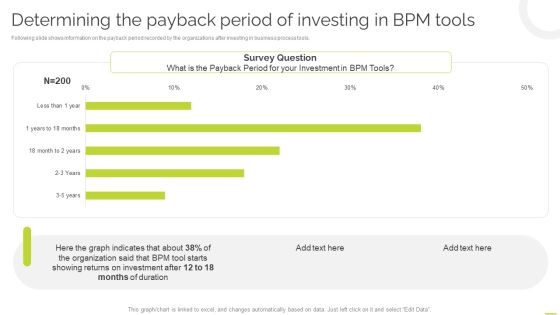
Effective BPM Tool For Business Process Management Determining The Payback Period Of Investing In BPM Tools Brochure PDF
Following slide shows information on the payback period recorded by the organizations after investing in business process tools. Find highly impressive Effective BPM Tool For Business Process Management Determining The Payback Period Of Investing In BPM Tools Brochure PDF on Slidegeeks to deliver a meaningful presentation. You can save an ample amount of time using these presentation templates. No need to worry to prepare everything from scratch because Slidegeeks experts have already done a huge research and work for you. You need to download Effective BPM Tool For Business Process Management Determining The Payback Period Of Investing In BPM Tools Brochure PDF for your upcoming presentation. All the presentation templates are 100 percent editable and you can change the color and personalize the content accordingly. Download now.

Effective BPM Tool For Business Process Management Determining Total Number Of Risks Encountered And Resolved Inspiration PDF
This slide portrays status of risk encountered and resolved by the organization till date. It includes information about the issues by status, by priority and their resolved status. If you are looking for a format to display your unique thoughts, then the professionally designed Effective BPM Tool For Business Process Management Determining Total Number Of Risks Encountered And Resolved Inspiration PDF is the one for you. You can use it as a Google Slides template or a PowerPoint template. Incorporate impressive visuals, symbols, images, and other charts. Modify or reorganize the text boxes as you desire. Experiment with shade schemes and font pairings. Alter, share or cooperate with other people on your work. Download Effective BPM Tool For Business Process Management Determining Total Number Of Risks Encountered And Resolved Inspiration PDF and find out how to give a successful presentation. Present a perfect display to your team and make your presentation unforgettable.

Effective BPM Tool For Business Process Management Operational Risk Events Estimation Post BPM Implementation Portrait PDF
This slide covers information about the estimated operational risk events for the year 2021. Events covered are clients and business practices, internal and external frauds. This modern and well arranged Effective BPM Tool For Business Process Management Operational Risk Events Estimation Post BPM Implementation Portrait PDF provides lots of creative possibilities. It is very simple to customize and edit with the Powerpoint Software. Just drag and drop your pictures into the shapes. All facets of this template can be edited with Powerpoint no extra software is necessary. Add your own material, put your images in the places assigned for them, adjust the colors, and then you can show your slides to the world, with an animated slide included.
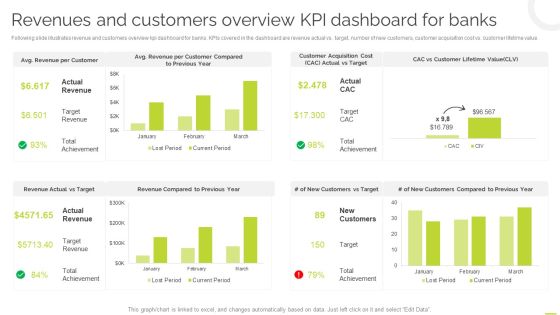
Effective BPM Tool For Business Process Management Revenues And Customers Overview KPI Dashboard For Banks Elements PDF
Following slide illustrates revenue and customers overview kpi dashboard for banks. KPIs covered in the dashboard are revenue actual vs target, number of new customers, customer acquisition cost vs. customer lifetime value. This Effective BPM Tool For Business Process Management Revenues And Customers Overview KPI Dashboard For Banks Elements PDF is perfect for any presentation, be it in front of clients or colleagues. It is a versatile and stylish solution for organizing your meetings. The Effective BPM Tool For Business Process Management Revenues And Customers Overview KPI Dashboard For Banks Elements PDF features a modern design for your presentation meetings. The adjustable and customizable slides provide unlimited possibilities for acing up your presentation. Slidegeeks has done all the homework before launching the product for you. So, do not wait, grab the presentation templates today.
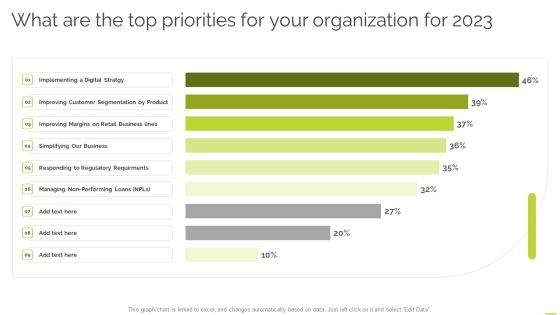
Effective BPM Tool For Business Process Management What Are The Top Priorities For Your Organization For 2023 Template PDF
The best PPT templates are a great way to save time, energy, and resources. Slidegeeks have 100 percent editable powerpoint slides making them incredibly versatile. With these quality presentation templates, you can create a captivating and memorable presentation by combining visually appealing slides and effectively communicating your message. Download Effective BPM Tool For Business Process Management What Are The Top Priorities For Your Organization For 2023 Template PDF from Slidegeeks and deliver a wonderful presentation.

Interoperability Software Testing Dashboard For Interoperability Testing Information PDF
This slide depicts the interoperability testing dashboard, based on features like test case analysis, tests linked to requirements, test case breakdown, and tests per requirement, among others. Do you have an important presentation coming up Are you looking for something that will make your presentation stand out from the rest Look no further than Interoperability Software Testing Dashboard For Interoperability Testing Information PDF. With our professional designs, you can trust that your presentation will pop and make delivering it a smooth process. And with Slidegeeks, you can trust that your presentation will be unique and memorable. So why wait Grab Interoperability Software Testing Dashboard For Interoperability Testing Information PDF today and make your presentation stand out from the rest.
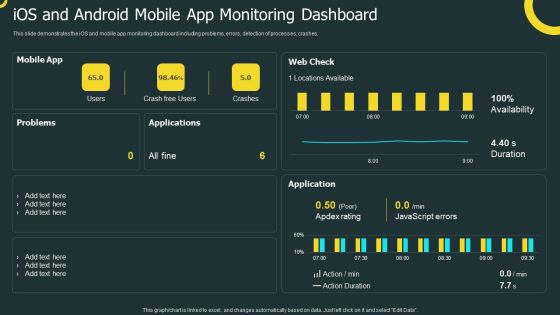
IOS Application Development Ios And Android Mobile App Monitoring Dashboard Pictures PDF
This slide demonstrates the iOS and mobile app monitoring dashboard including problems, errors, detection of processes, crashes. Crafting an eye catching presentation has never been more straightforward. Let your presentation shine with this tasteful yet straightforward IOS Application Development Ios And Android Mobile App Monitoring Dashboard Pictures PDF template. It offers a minimalistic and classy look that is great for making a statement. The colors have been employed intelligently to add a bit of playfulness while still remaining professional. Construct the ideal IOS Application Development Ios And Android Mobile App Monitoring Dashboard Pictures PDF that effortlessly grabs the attention of your audience Begin now and be certain to wow your customers.
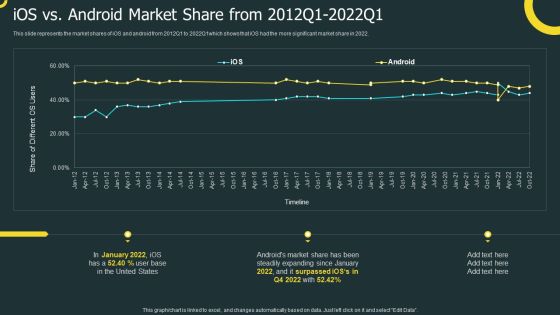
IOS Application Development Ios Vs Android Market Share From 2012Q1 2022Q1 Clipart PDF
This slide represents the market shares of iOS and android from 2012Q1 to 2022Q1which shows that iOS had the more significant market share in 2022. Formulating a presentation can take up a lot of effort and time, so the content and message should always be the primary focus. The visuals of the PowerPoint can enhance the presenters message, so our IOS Application Development Ios Vs Android Market Share From 2012Q1 2022Q1 Clipart PDF was created to help save time. Instead of worrying about the design, the presenter can concentrate on the message while our designers work on creating the ideal templates for whatever situation is needed. Slidegeeks has experts for everything from amazing designs to valuable content, we have put everything into IOS Application Development Ios Vs Android Market Share From 2012Q1 2022Q1 Clipart PDF.

IOS Application Development Revenue Generated Through Developed Apps In 2022 Diagrams PDF
This slide demonstrates the profit generated by our developed apps for the clients in 2021, which is in billion US dollars. Slidegeeks has constructed IOS Application Development Revenue Generated Through Developed Apps In 2022 Diagrams PDF after conducting extensive research and examination. These presentation templates are constantly being generated and modified based on user preferences and critiques from editors. Here, you will find the most attractive templates for a range of purposes while taking into account ratings and remarks from users regarding the content. This is an excellent jumping off point to explore our content and will give new users an insight into our top notch PowerPoint Templates.
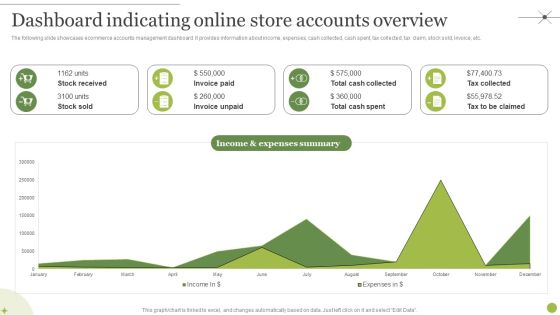
Managing E Commerce Business Accounting Dashboard Indicating Online Store Accounts Overview Inspiration PDF
The following slide showcases ecommerce accounts management dashboard. It provides information about income, expenses, cash collected, cash spent, tax collected, tax claim, stock sold, invoice, etc. There are so many reasons you need a Managing E Commerce Business Accounting Dashboard Indicating Online Store Accounts Overview Inspiration PDF. The first reason is you can not spend time making everything from scratch, Thus, Slidegeeks has made presentation templates for you too. You can easily download these templates from our website easily.
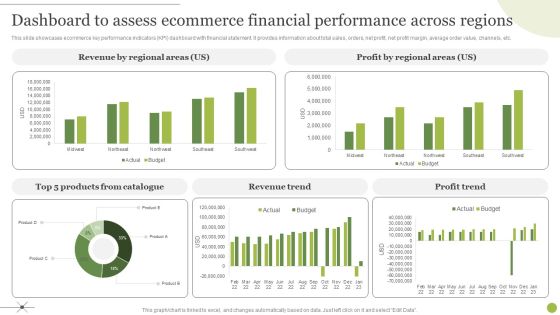
Managing E Commerce Business Accounting Dashboard To Assess Ecommerce Financial Performance Across Regions Graphics PDF
This slide showcases ecommerce key performance indicators KPI dashboard with financial statement. It provides information about total sales, orders, net profit, net profit margin, average order value, channels, etc. Do you have to make sure that everyone on your team knows about any specific topic I yes, then you should give Managing E Commerce Business Accounting Dashboard To Assess Ecommerce Financial Performance Across Regions Graphics PDF a try. Our experts have put a lot of knowledge and effort into creating this impeccable Managing E Commerce Business Accounting Dashboard To Assess Ecommerce Financial Performance Across Regions Graphics PDF. You can use this template for your upcoming presentations, as the slides are perfect to represent even the tiniest detail. You can download these templates from the Slidegeeks website and these are easy to edit. So grab these today.
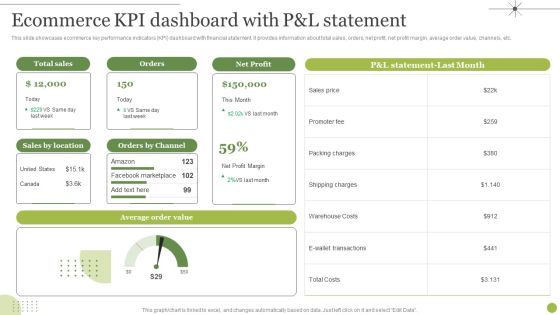
Managing E Commerce Business Accounting Ecommerce KPI Dashboard With P And L Statement Diagrams PDF
This slide showcases ecommerce key performance indicators KPI dashboard with financial statement. It provides information about total sales, orders, net profit, net profit margin, average order value, channels, etc. Present like a pro with Managing E Commerce Business Accounting Ecommerce KPI Dashboard With P And L Statement Diagrams PDF Create beautiful presentations together with your team, using our easy to use presentation slides. Share your ideas in real time and make changes on the fly by downloading our templates. So whether you are in the office, on the go, or in a remote location, you can stay in sync with your team and present your ideas with confidence. With Slidegeeks presentation got a whole lot easier. Grab these presentations today.

Managing E Commerce Business Accounting Improving Average Order Value Rate Graphics PDF
The following slide showcases improvement of average order value rate. It provides information about product recommendations, customer loyalty program, product bundling, discount minimums, etc. If you are looking for a format to display your unique thoughts, then the professionally designed Managing E Commerce Business Accounting Improving Average Order Value Rate Graphics PDF is the one for you. You can use it as a Google Slides template or a PowerPoint template. Incorporate impressive visuals, symbols, images, and other charts. Modify or reorganize the text boxes as you desire. Experiment with shade schemes and font pairings. Alter, share or cooperate with other people on your work. Download Managing E Commerce Business Accounting Improving Average Order Value Rate Graphics PDF and find out how to give a successful presentation. Present a perfect display to your team and make your presentation unforgettable.

Managing E Commerce Business Accounting Increasing Gross Profit Margin Of Online Store Introduction PDF
The following slide showcases increasing gross profit margin of online store. It provides information about discounts, sales, cost of goods sold COGS, accounting accuracy, inventory visibility, etc. Are you in need of a template that can accommodate all of your creative concepts This one is crafted professionally and can be altered to fit any style. Use it with Google Slides or PowerPoint. Include striking photographs, symbols, depictions, and other visuals. Fill, move around, or remove text boxes as desired. Test out color palettes and font mixtures. Edit and save your work, or work with colleagues. Download Managing E Commerce Business Accounting Increasing Gross Profit Margin Of Online Store Introduction PDF and observe how to make your presentation outstanding. Give an impeccable presentation to your group and make your presentation unforgettable.

Managing E Commerce Business Accounting P And L Statement To Analyze Net Profits Elements PDF
The following slide depicts P and L statement to assess net profits. It provides information about cost of sales, gross margin, payroll, sales, marketing, depreciation, rent, payroll, interest, taxes, net sales, etc. Explore a selection of the finest Managing E Commerce Business Accounting P And L Statement To Analyze Net Profits Elements PDF here. With a plethora of professionally designed and pre made slide templates, you can quickly and easily find the right one for your upcoming presentation. You can use our Managing E Commerce Business Accounting P And L Statement To Analyze Net Profits Elements PDF to effectively convey your message to a wider audience. Slidegeeks has done a lot of research before preparing these presentation templates. The content can be personalized and the slides are highly editable. Grab templates today from Slidegeeks.
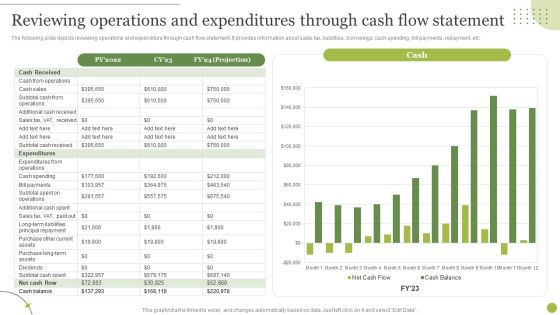
Managing E Commerce Business Accounting Reviewing Operations And Expenditures Through Cash Flow Statement Ideas PDF
The following slide depicts reviewing operations and expenditure through cash flow statement. It provides information about sales tax, liabilities, borrowings, cash spending, bill payments, repayment, etc. Slidegeeks has constructed Managing E Commerce Business Accounting Reviewing Operations And Expenditures Through Cash Flow Statement Ideas PDF after conducting extensive research and examination. These presentation templates are constantly being generated and modified based on user preferences and critiques from editors. Here, you will find the most attractive templates for a range of purposes while taking into account ratings and remarks from users regarding the content. This is an excellent jumping off point to explore our content and will give new users an insight into our top notch PowerPoint Templates.

Managing E Commerce Business Accounting Strategies To Reduce Customer Acquisition Cost Background PDF
The following slide showcases strategies to reduce customer acquisition cost. It provides information about marketing channels, customer base, prioritization, upselling, etc. There are so many reasons you need a Managing E Commerce Business Accounting Strategies To Reduce Customer Acquisition Cost Background PDF. The first reason is you can not spend time making everything from scratch, Thus, Slidegeeks has made presentation templates for you too. You can easily download these templates from our website easily.
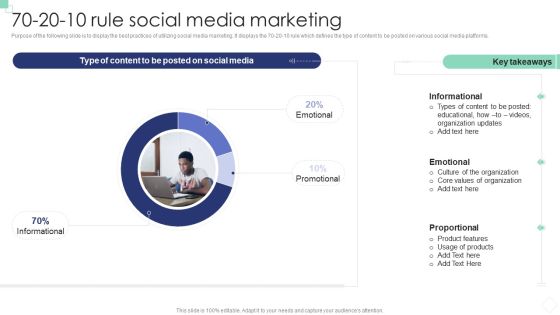
Implementing B2B And B2C Marketing 70 20 10 Rule Social Media Marketing Brochure PDF
Purpose of the following slide is to display the best practices of utilizing social media marketing. It displays the 70-20-10 rule which defines the type of content to be posted on various social media platforms. Crafting an eye-catching presentation has never been more straightforward. Let your presentation shine with this tasteful yet straightforward Implementing B2B And B2C Marketing 70 20 10 Rule Social Media Marketing Brochure PDF template. It offers a minimalistic and classy look that is great for making a statement. The colors have been employed intelligently to add a bit of playfulness while still remaining professional. Construct the ideal Implementing B2B And B2C Marketing 70 20 10 Rule Social Media Marketing Brochure PDF that effortlessly grabs the attention of your audience Begin now and be certain to wow your customers.

Implementing B2B And B2C Marketing Impact Of Social Media Marketing On Organization Background PDF
The following slide helps the organization in analyzing how social media marketing can impact the organization. It analysis impact on various parameter such as exposure to brand, no of leads, SEO etc. Coming up with a presentation necessitates that the majority of the effort goes into the content and the message you intend to convey. The visuals of a PowerPoint presentation can only be effective if it supplements and supports the story that is being told. Keeping this in mind our experts created Implementing B2B And B2C Marketing Impact Of Social Media Marketing On Organization Background PDF to reduce the time that goes into designing the presentation. This way, you can concentrate on the message while our designers take care of providing you with the right template for the situation.

Implementing B2B And B2C Marketing Social Media Marketing Budget Mockup PDF
The following slide displays social media marketing budget which helps in analyzing and understanding the total expenditure done by the organization in the marketing campaign. Key elements of the budget are content creating, social advertisement etc. Explore a selection of the finest Implementing B2B And B2C Marketing Social Media Marketing Budget Mockup PDF here. With a plethora of professionally designed and pre-made slide templates, you can quickly and easily find the right one for your upcoming presentation. You can use our Implementing B2B And B2C Marketing Social Media Marketing Budget Mockup PDF to effectively convey your message to a wider audience. Slidegeeks has done a lot of research before preparing these presentation templates. The content can be personalized and the slides are highly editable. Grab templates today from Slidegeeks.
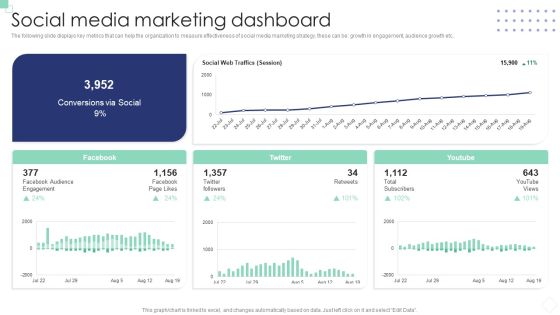
Implementing B2B And B2C Marketing Social Media Marketing Dashboard Designs PDF
The following slide displays key metrics that can help the organization to measure effectiveness of social media marketing strategy, these can be growth in engagement, audience growth etc. The best PPT templates are a great way to save time, energy, and resources. Slidegeeks have 100 percent editable powerpoint slides making them incredibly versatile. With these quality presentation templates, you can create a captivating and memorable presentation by combining visually appealing slides and effectively communicating your message. Download Implementing B2B And B2C Marketing Social Media Marketing Dashboard Designs PDF from Slidegeeks and deliver a wonderful presentation.
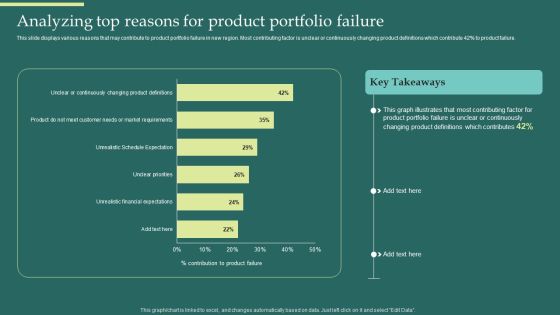
Product Portfolios And Strategic Analyzing Top Reasons For Product Portfolio Failure Summary PDF
This slide displays various reasons that may contribute to product portfolio failure in new region. Most contributing factor is unclear or continuously changing product definitions which contribute 42 percent to product failure. Want to ace your presentation in front of a live audience Our Product Portfolios And Strategic Analyzing Top Reasons For Product Portfolio Failure Summary PDF can help you do that by engaging all the users towards you.. Slidegeeks experts have put their efforts and expertise into creating these impeccable powerpoint presentations so that you can communicate your ideas clearly. Moreover, all the templates are customizable, and easy-to-edit and downloadable. Use these for both personal and commercial use.
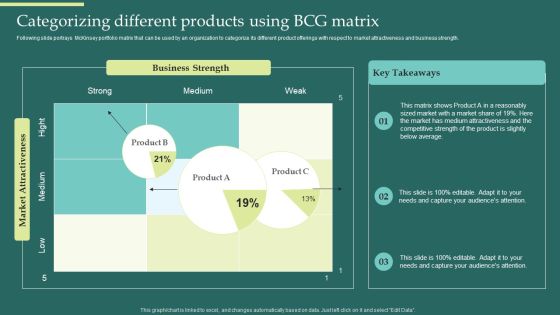
Product Portfolios And Strategic Categorizing Different Products Using Bcg Matrix Formats PDF
Following slide portrays McKinsey portfolio matrix that can be used by an organization to categorize its different product offerings with respect to market attractiveness and business strength. Get a simple yet stunning designed Product Portfolios And Strategic Categorizing Different Products Using Bcg Matrix Formats PDF. It is the best one to establish the tone in your meetings. It is an excellent way to make your presentations highly effective. So, download this PPT today from Slidegeeks and see the positive impacts. Our easy-to-edit Product Portfolios And Strategic Categorizing Different Products Using Bcg Matrix Formats PDF can be your go-to option for all upcoming conferences and meetings. So, what are you waiting for Grab this template today.

Product Portfolios And Strategic Current Standardization Of Product Portfolio Process Rules PDF
Following slide shows details about current standardization of organizations product portfolio process. Here the standardization process includes stages namely select and maximize portfolio, resource and enable pipeline and determineand monitor product value. Present like a pro with Product Portfolios And Strategic Current Standardization Of Product Portfolio Process Rules PDF Create beautiful presentations together with your team, using our easy-to-use presentation slides. Share your ideas in real-time and make changes on the fly by downloading our templates. So whether youre in the office, on the go, or in a remote location, you can stay in sync with your team and present your ideas with confidence. With Slidegeeks presentation got a whole lot easier. Grab these presentations today.
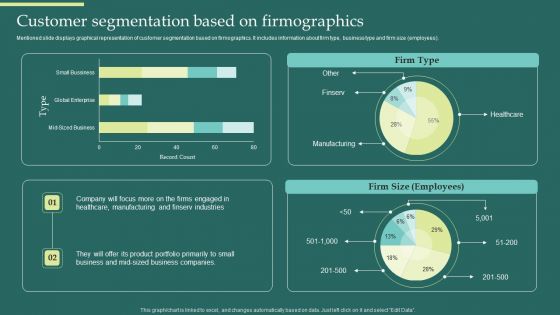
Product Portfolios And Strategic Customer Segmentation Based On Firmographics Brochure PDF
Mentioned slide displays graphical representation of customer segmentation based on firmographics. It includes information about firm type, business type and firm size employees. Slidegeeks is here to make your presentations a breeze with Product Portfolios And Strategic Customer Segmentation Based On Firmographics Brochure PDF With our easy-to-use and customizable templates, you can focus on delivering your ideas rather than worrying about formatting. With a variety of designs to choose from, youre sure to find one that suits your needs. And with animations and unique photos, illustrations, and fonts, you can make your presentation pop. So whether youre giving a sales pitch or presenting to the board, make sure to check out Slidegeeks first.

Product Portfolios And Strategic Dashboard To Measure Business Performance Portrait PDF
This slide illustrates a dashboard that can be used by a product manager to measure the business performance. Metrics covered in the dashboard are revenue, launches, cash flow, EPS, average revenue by product and average cost by phase. Do you have an important presentation coming up Are you looking for something that will make your presentation stand out from the rest Look no further than Product Portfolios And Strategic Dashboard To Measure Business Performance Portrait PDF. With our professional designs, you can trust that your presentation will pop and make delivering it a smooth process. And with Slidegeeks, you can trust that your presentation will be unique and memorable. So why wait Grab Product Portfolios And Strategic Dashboard To Measure Business Performance Portrait PDF today and make your presentation stand out from the rest.
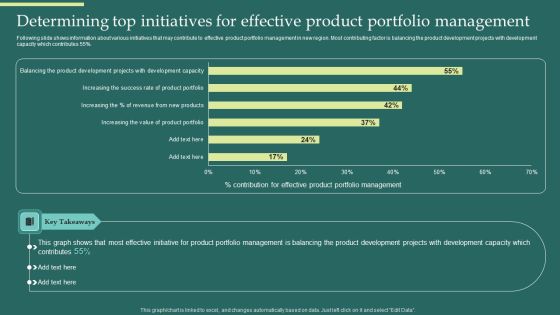
Product Portfolios And Strategic Determining Top Initiatives For Effective Product Formats PDF
Following slide shows information about various initiatives that may contribute to effective product portfolio management in new region. Most contributing factor is balancing the product development projects with development capacity which contributes 55 percent. If your project calls for a presentation, then Slidegeeks is your go-to partner because we have professionally designed, easy-to-edit templates that are perfect for any presentation. After downloading, you can easily edit Product Portfolios And Strategic Determining Top Initiatives For Effective Product Formats PDF and make the changes accordingly. You can rearrange slides or fill them with different images. Check out all the handy templates.
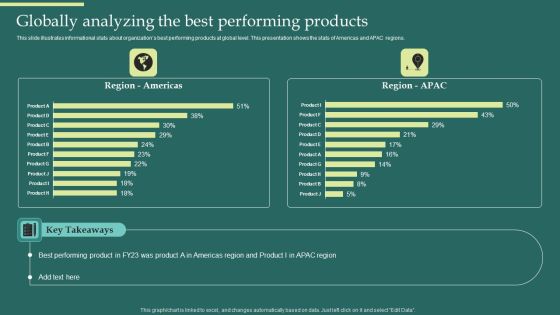
Product Portfolios And Strategic Globally Analyzing The Best Performing Products Rules PDF
This slide illustrates informational stats about organizations best performing products at global level. This presentation shows the stats of Americas and APAC regions. Crafting an eye-catching presentation has never been more straightforward. Let your presentation shine with this tasteful yet straightforward Product Portfolios And Strategic Globally Analyzing The Best Performing Products Rules PDF template. It offers a minimalistic and classy look that is great for making a statement. The colors have been employed intelligently to add a bit of playfulness while still remaining professional. Construct the ideal Product Portfolios And Strategic Globally Analyzing The Best Performing Products Rules PDF that effortlessly grabs the attention of your audience Begin now and be certain to wow your customers.
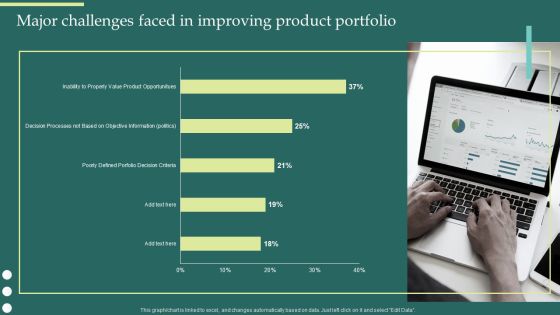
Product Portfolios And Strategic Major Challenges Faced In Improving Product Portfolio Ideas PDF
This modern and well-arranged Product Portfolios And Strategic Major Challenges Faced In Improving Product Portfolio Ideas PDF provides lots of creative possibilities. It is very simple to customize and edit with the Powerpoint Software. Just drag and drop your pictures into the shapes. All facets of this template can be edited with Powerpoint, no extra software is necessary. Add your own material, put your images in the places assigned for them, adjust the colors, and then you can show your slides to the world, with an animated slide included.
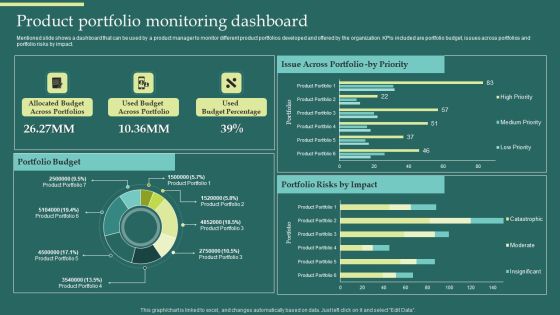
Product Portfolios And Strategic Product Portfolio Monitoring Dashboard Introduction PDF
Mentioned slide shows a dashboard that can be used by a product manager to monitor different product portfolios developed and offered by the organization. KPIs included are portfolio budget, issues across portfolios and portfolio risks by impact. Explore a selection of the finest Product Portfolios And Strategic Product Portfolio Monitoring Dashboard Introduction PDF here. With a plethora of professionally designed and pre-made slide templates, you can quickly and easily find the right one for your upcoming presentation. You can use our Product Portfolios And Strategic Product Portfolio Monitoring Dashboard Introduction PDF to effectively convey your message to a wider audience. Slidegeeks has done a lot of research before preparing these presentation templates. The content can be personalized and the slides are highly editable. Grab templates today from Slidegeeks.
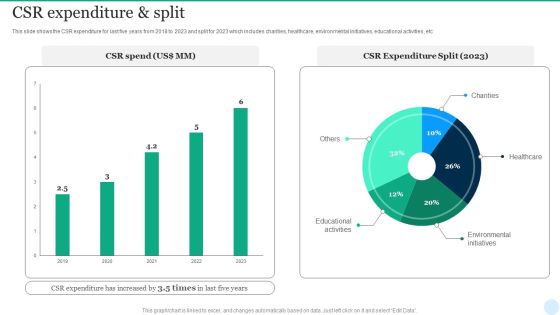
Web Interface Development Services Company Summary CSR Expenditure And Split Topics PDF
This slide shows the CSR expenditure for last five years from 2018 to 2023 and split for 2023 which includes charities, healthcare, environmental initiatives, educational activities, etc. From laying roadmaps to briefing everything in detail, our templates are perfect for you. You can set the stage with your presentation slides. All you have to do is download these easy-to-edit and customizable templates. Web Interface Development Services Company Summary CSR Expenditure And Split Topics PDF will help you deliver an outstanding performance that everyone would remember and praise you for. Do download this presentation today.
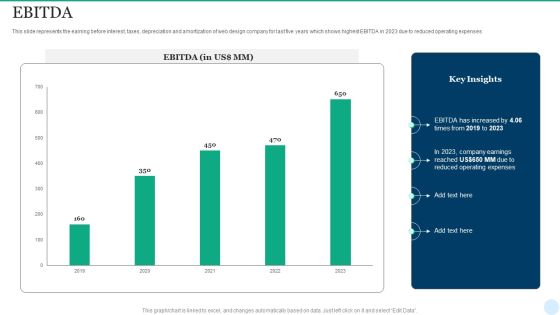
Web Interface Development Services Company Summary EBITDA Structure PDF
This slide represents the earning before interest, taxes, depreciation and amortization of web design company for last five years which shows highest EBITDA in 2023 due to reduced operating expenses. Present like a pro with Web Interface Development Services Company Summary EBITDA Structure PDF Create beautiful presentations together with your team, using our easy-to-use presentation slides. Share your ideas in real-time and make changes on the fly by downloading our templates. So whether youre in the office, on the go, or in a remote location, you can stay in sync with your team and present your ideas with confidence. With Slidegeeks presentation got a whole lot easier. Grab these presentations today.
Web Interface Development Services Company Summary Employee Count And Breakdown Icons PDF
This slide represents the employee count for last five years from 2019 to 2023. It also includes employee split by geography and gender Slidegeeks is here to make your presentations a breeze with Web Interface Development Services Company Summary Employee Count And Breakdown Icons PDF With our easy-to-use and customizable templates, you can focus on delivering your ideas rather than worrying about formatting. With a variety of designs to choose from, youre sure to find one that suits your needs. And with animations and unique photos, illustrations, and fonts, you can make your presentation pop. So whether youre giving a sales pitch or presenting to the board, make sure to check out Slidegeeks first.

Web Interface Development Services Company Summary Market Share Comparison Slides PDF
This slide represents the web design company comparison with competitors based on market share which shows our leading company with greatest share in US market due to increased demand for web design services. Crafting an eye-catching presentation has never been more straightforward. Let your presentation shine with this tasteful yet straightforward Web Interface Development Services Company Summary Market Share Comparison Slides PDF template. It offers a minimalistic and classy look that is great for making a statement. The colors have been employed intelligently to add a bit of playfulness while still remaining professional. Construct the ideal Web Interface Development Services Company Summary Market Share Comparison Slides PDF that effortlessly grabs the attention of your audience Begin now and be certain to wow your customers.

Web Interface Development Services Company Summary Operating Profits From 2019 To 2023 Microsoft PDF
This slide covers the operating profit of web design company for last five years from 2019 to 2023 which shows changes in operating profits year after year. Formulating a presentation can take up a lot of effort and time, so the content and message should always be the primary focus. The visuals of the PowerPoint can enhance the presenters message, so our Web Interface Development Services Company Summary Operating Profits From 2019 To 2023 Microsoft PDF was created to help save time. Instead of worrying about the design, the presenter can concentrate on the message while our designers work on creating the ideal templates for whatever situation is needed. Slidegeeks has experts for everything from amazing designs to valuable content, we have put everything into Web Interface Development Services Company Summary Operating Profits From 2019 To 2023 Microsoft PDF.

Web Interface Development Services Company Summary Revenue And Net Profit Analysis Slides PDF
This slide focuses on financial highlights of Web design company which represents revenue and net profit for last five years from 2019 to 2023. The Web Interface Development Services Company Summary Revenue And Net Profit Analysis Slides PDF is a compilation of the most recent design trends as a series of slides. It is suitable for any subject or industry presentation, containing attractive visuals and photo spots for businesses to clearly express their messages. This template contains a variety of slides for the user to input data, such as structures to contrast two elements, bullet points, and slides for written information. Slidegeeks is prepared to create an impression.
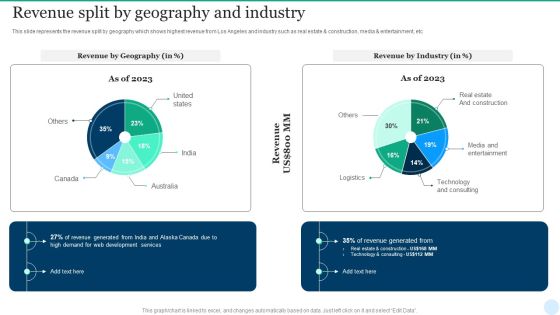
Web Interface Development Services Company Summary Revenue Split By Geography And Industry Brochure PDF
This slide represents the revenue split by geography which shows highest revenue from Los Angeles and industry such as real estate and construction, media and entertainment, etc. Are you searching for a Web Interface Development Services Company Summary Revenue Split By Geography And Industry Brochure PDF that is uncluttered, straightforward, and original Its easy to edit, and you can change the colors to suit your personal or business branding. For a presentation that expresses how much effort youve put in, this template is ideal With all of its features, including tables, diagrams, statistics, and lists, its perfect for a business plan presentation. Make your ideas more appealing with these professional slides. Download Web Interface Development Services Company Summary Revenue Split By Geography And Industry Brochure PDF from Slidegeeks today.

Website Design And Branding Studio Company Profile CSR Expenditure And Split Template PDF
This slide shows the CSR expenditure for last five years from 2018 to 2023 and split for 2023 which includes charities, healthcare, environmental initiatives, educational activities, etc. Get a simple yet stunning designed Website Design And Branding Studio Company Profile CSR Expenditure And Split Template PDF. It is the best one to establish the tone in your meetings. It is an excellent way to make your presentations highly effective. So, download this PPT today from Slidegeeks and see the positive impacts. Our easy-to-edit Website Design And Branding Studio Company Profile CSR Expenditure And Split Template PDF can be your go-to option for all upcoming conferences and meetings. So, what are you waiting for Grab this template today.
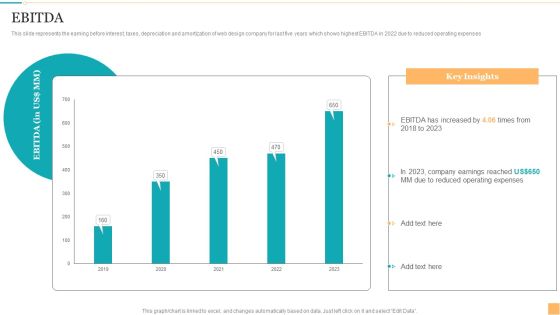
Website Design And Branding Studio Company Profile EBIDTA Microsoft PDF
This slide represents the earning before interest, taxes, depreciation and amortization of web design company for last five years which shows highest EBITDA in 2022 due to reduced operating expenses. From laying roadmaps to briefing everything in detail, our templates are perfect for you. You can set the stage with your presentation slides. All you have to do is download these easy-to-edit and customizable templates. Website Design And Branding Studio Company Profile EBIDTA Microsoft PDF will help you deliver an outstanding performance that everyone would remember and praise you for. Do download this presentation today.

Website Design And Branding Studio Company Profile Employee Count And Breakdown Structure PDF
This slide represents the employee count for last five years from 2018 to 2023. It also includes employee split by geography and gender. Present like a pro with Website Design And Branding Studio Company Profile Employee Count And Breakdown Structure PDF Create beautiful presentations together with your team, using our easy-to-use presentation slides. Share your ideas in real-time and make changes on the fly by downloading our templates. So whether youre in the office, on the go, or in a remote location, you can stay in sync with your team and present your ideas with confidence. With Slidegeeks presentation got a whole lot easier. Grab these presentations today.

Website Design And Branding Studio Company Profile Operating Profits From 2018 To 2023 Graphics PDF
This slide covers the operating profit of web design company for last five years from 2018 to 2023 which shows changes in operating profits year after year. Formulating a presentation can take up a lot of effort and time, so the content and message should always be the primary focus. The visuals of the PowerPoint can enhance the presenters message, so our Website Design And Branding Studio Company Profile Operating Profits From 2018 To 2023 Graphics PDF was created to help save time. Instead of worrying about the design, the presenter can concentrate on the message while our designers work on creating the ideal templates for whatever situation is needed. Slidegeeks has experts for everything from amazing designs to valuable content, we have put everything into Website Design And Branding Studio Company Profile Operating Profits From 2018 To 2023 Graphics PDF.
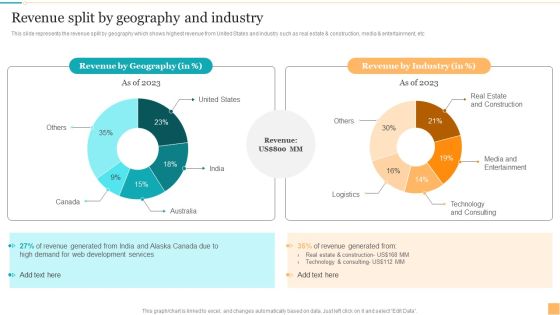
Website Design And Branding Studio Company Profile Revenue Split By Geography And Industry Guidelines PDF
This slide represents the revenue split by geography which shows highest revenue from United States and industry such as real estate and construction, media and entertainment, etc. The Website Design And Branding Studio Company Profile Revenue Split By Geography And Industry Guidelines PDF is a compilation of the most recent design trends as a series of slides. It is suitable for any subject or industry presentation, containing attractive visuals and photo spots for businesses to clearly express their messages. This template contains a variety of slides for the user to input data, such as structures to contrast two elements, bullet points, and slides for written information. Slidegeeks is prepared to create an impression.
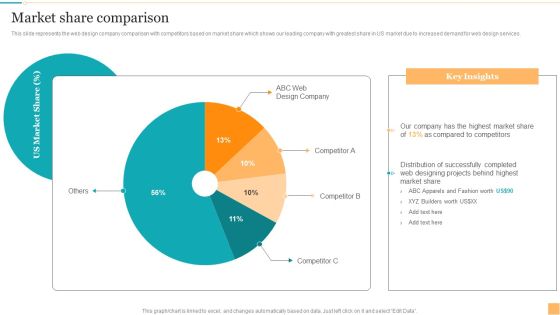
Website Design And Branding Studio Company Profile Market Share Comparison Diagrams PDF
This slide represents the web design company comparison with competitors based on market share which shows our leading company with greatest share in US market due to increased demand for web design services. Here you can discover an assortment of the finest PowerPoint and Google Slides templates. With these templates, you can create presentations for a variety of purposes while simultaneously providing your audience with an eye-catching visual experience. Download Website Design And Branding Studio Company Profile Market Share Comparison Diagrams PDF to deliver an impeccable presentation. These templates will make your job of preparing presentations much quicker, yet still, maintain a high level of quality. Slidegeeks has experienced researchers who prepare these templates and write high-quality content for you. Later on, you can personalize the content by editing the Website Design And Branding Studio Company Profile Market Share Comparison Diagrams PDF.

Content Promotional Activities By B2B Marketers Ppt PowerPoint Presentation File Pictures PDF
The slide illustrates survey of B2B marketers regarding content marketing initiatives taken in last year. Various initiatives included are case studies, audio content, video content, online books, etc. Showcasing this set of slides titled Content Promotional Activities By B2B Marketers Ppt PowerPoint Presentation File Pictures PDF. The topics addressed in these templates are Increasing Brand Recognition, Boosting Customer, Engagement Activities. All the content presented in this PPT design is completely editable. Download it and make adjustments in color, background, font etc. as per your unique business setting.

Business Services Revenue Generated By Categories Engineering Company Financial Analysis Report Graphics PDF
The following slide highlights the business revenue generated by the engineering company in a given year. It shows revenue share from cities, players and geography, Cities include Tier I, Tier II, and Tier III, Players include government and private builders, geography includes north America, Europe and Asia pacific.If you are looking for a format to display your unique thoughts, then the professionally designed Business Services Revenue Generated By Categories Engineering Company Financial Analysis Report Graphics PDF is the one for you. You can use it as a Google Slides template or a PowerPoint template. Incorporate impressive visuals, symbols, images, and other charts. Modify or reorganize the text boxes as you desire. Experiment with shade schemes and font pairings. Alter, share or cooperate with other people on your work. Download Business Services Revenue Generated By Categories Engineering Company Financial Analysis Report Graphics PDF and find out how to give a successful presentation. Present a perfect display to your team and make your presentation unforgettable.
