AI PPT Maker
Templates
PPT Bundles
Design Services
Business PPTs
Business Plan
Management
Strategy
Introduction PPT
Roadmap
Self Introduction
Timelines
Process
Marketing
Agenda
Technology
Medical
Startup Business Plan
Cyber Security
Dashboards
SWOT
Proposals
Education
Pitch Deck
Digital Marketing
KPIs
Project Management
Product Management
Artificial Intelligence
Target Market
Communication
Supply Chain
Google Slides
Research Services
 One Pagers
All Categories
-
Home
- Customer Favorites
- Errc Graph
Errc Graph

Brand Awareness Measuring Kpi Dashboard Brand Value Estimation Guide Formats PDF
Following slide illustrates KPI dashboard that can be used to track the awareness level of a specific brand. KPIs covered in the slide are traffic, attention, authority, inbound channel performance etc.There are so many reasons you need a Brand Awareness Measuring Kpi Dashboard Brand Value Estimation Guide Formats PDF. The first reason is you can not spend time making everything from scratch, Thus, Slidegeeks has made presentation templates for you too. You can easily download these templates from our website easily.

Brand Health Definition And Metrics To Track Brand Value Estimation Guide Mockup PDF
Following slide provides an overview about brand equity by covering its definition and key components such as brand loyalty, awareness, quality, association and experience.Present like a pro with Brand Health Definition And Metrics To Track Brand Value Estimation Guide Mockup PDF Create beautiful presentations together with your team, using our easy-to-use presentation slides. Share your ideas in real-time and make changes on the fly by downloading our templates. So whether you are in the office, on the go, or in a remote location, you can stay in sync with your team and present your ideas with confidence. With Slidegeeks presentation got a whole lot easier. Grab these presentations today.

Brand Value Definition And Its Importance Brand Value Estimation Guide Summary PDF
Purpose of this slide is to provide an overview about brand value. It include brand value definition as well as its important statistics and elements such as brand awareness, perception, association and loyalty.Whether you have daily or monthly meetings, a brilliant presentation is necessary. Brand Value Definition And Its Importance Brand Value Estimation Guide Summary PDF can be your best option for delivering a presentation. Represent everything in detail using Brand Value Definition And Its Importance Brand Value Estimation Guide Summary PDF and make yourself stand out in meetings. The template is versatile and follows a structure that will cater to your requirements. All the templates prepared by Slidegeeks are easy to download and edit. Our research experts have taken care of the corporate themes as well. So, give it a try and see the results.

Financial Kpi Dashboard To Measure Brand Performance Brand Value Estimation Guide Inspiration PDF
Mentioned slide showcases KPI dashboard that can be used to check the financial performance of a brand. Metrics covered in the dashboard are return on assets, working capital ratio, return on equity etc.Are you in need of a template that can accommodate all of your creative concepts This one is crafted professionally and can be altered to fit any style. Use it with Google Slides or PowerPoint. Include striking photographs, symbols, depictions, and other visuals. Fill, move around, or remove text boxes as desired. Test out color palettes and font mixtures. Edit and save your work, or work with colleagues. Download Financial Kpi Dashboard To Measure Brand Performance Brand Value Estimation Guide Inspiration PDF and observe how to make your presentation outstanding. Give an impeccable presentation to your group and make your presentation unforgettable.
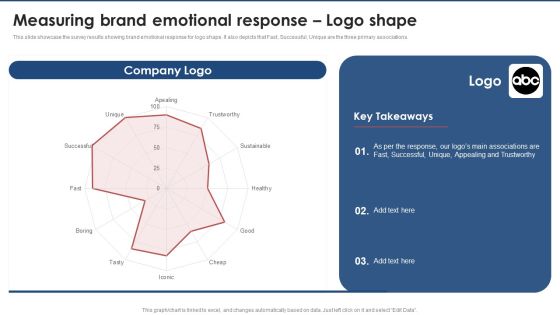
Measuring Brand Emotional Response Logo Shape Brand Value Estimation Guide Sample PDF
This slide showcase the survey results showing brand emotional response for logo shape. It also depicts that Fast, Successful, Unique are the three primary associations. The Measuring Brand Emotional Response Logo Shape Brand Value Estimation Guide Sample PDF is a compilation of the most recent design trends as a series of slides. It is suitable for any subject or industry presentation, containing attractive visuals and photo spots for businesses to clearly express their messages. This template contains a variety of slides for the user to input data, such as structures to contrast two elements, bullet points, and slides for written information. Slidegeeks is prepared to create an impression.

Test Conclusion Emotional Index Value Brand Value Estimation Guide Structure PDF
Mentioned slide displays the results of brand asset test. It shows that logo having black background is having the highest emotional index value score.Do you have an important presentation coming up Are you looking for something that will make your presentation stand out from the rest Look no further than Test Conclusion Emotional Index Value Brand Value Estimation Guide Structure PDF. With our professional designs, you can trust that your presentation will pop and make delivering it a smooth process. And with Slidegeeks, you can trust that your presentation will be unique and memorable. So why wait Grab Test Conclusion Emotional Index Value Brand Value Estimation Guide Structure PDF today and make your presentation stand out from the rest.
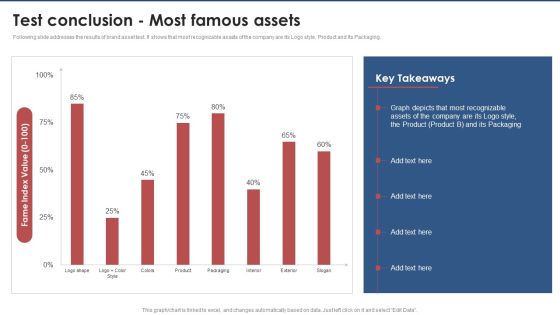
Test Conclusion Most Famous Assets Brand Value Estimation Guide Themes PDF
Following slide addresses the results of brand asset test. It shows that most recognizable assets of the company are its Logo style, Product and its Packaging.Whether you have daily or monthly meetings, a brilliant presentation is necessary. Test Conclusion Most Famous Assets Brand Value Estimation Guide Themes PDF can be your best option for delivering a presentation. Represent everything in detail using Test Conclusion Most Famous Assets Brand Value Estimation Guide Themes PDF and make yourself stand out in meetings. The template is versatile and follows a structure that will cater to your requirements. All the templates prepared by Slidegeeks are easy to download and edit. Our research experts have taken care of the corporate themes as well. So, give it a try and see the results.
Young And Rubicam Brand Asset Valuator Model Brand Value Estimation Guide Icons PDF
Mentioned slide illustrates information about Young Rubicam brand asset valuator model. It also covers sample model along with key benefits and brand health performance.Boost your pitch with our creative Young And Rubicam Brand Asset Valuator Model Brand Value Estimation Guide Icons PDF. Deliver an awe-inspiring pitch that will mesmerize everyone. Using these presentation templates you will surely catch everyones attention. You can browse the ppts collection on our website. We have researchers who are experts at creating the right content for the templates. So you do not have to invest time in any additional work. Just grab the template now and use them.
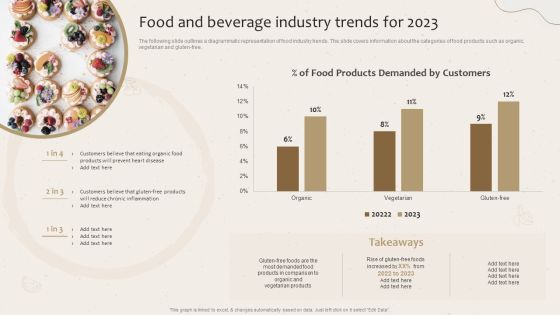
Food And Beverage Industry Trends For 2023 Launching New Beverage Product Information PDF
The following slide outlines a diagrammatic representation of food industry trends. The slide covers information about the categories of food products such as organic, vegetarian and gluten-free. Are you searching for a Food And Beverage Industry Trends For 2023 Launching New Beverage Product Information PDF that is uncluttered, straightforward, and original Its easy to edit, and you can change the colors to suit your personal or business branding. For a presentation that expresses how much effort you ve put in, this template is ideal With all of its features, including tables, diagrams, statistics, and lists, its perfect for a business plan presentation. Make your ideas more appealing with these professional slides. Download Food And Beverage Industry Trends For 2023 Launching New Beverage Product Information PDF from Slidegeeks today.
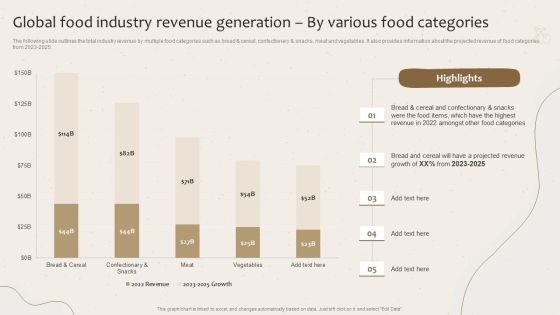
Global Food Industry Revenue Generation By Various Food Categories Launching New Beverage Product Information PDF
The following slide outlines the total industry revenue by multiple food categories such as bread cereal, confectionery snacks, meat and vegetables. It also provides information about the projected revenue of food categories from 2023-2025. Retrieve professionally designed Global Food Industry Revenue Generation By Various Food Categories Launching New Beverage Product Information PDF to effectively convey your message and captivate your listeners. Save time by selecting pre-made slideshows that are appropriate for various topics, from business to educational purposes. These themes come in many different styles, from creative to corporate, and all of them are easily adjustable and can be edited quickly. Access them as PowerPoint templates or as Google Slides themes. You do not have to go on a hunt for the perfect presentation because Slidegeeks got you covered from everywhere.

Global Food Industry Revenue Generation Year Over Year Growth Launching New Beverage Product Themes PDF
The following slide outlines the total market revenue and growth of food beverage industry. The revenue of the food industry is covered from 2015-2022. Slidegeeks has constructed Global Food Industry Revenue Generation Year Over Year Growth Launching New Beverage Product Themes PDF after conducting extensive research and examination. These presentation templates are constantly being generated and modified based on user preferences and critiques from editors. Here, you will find the most attractive templates for a range of purposes while taking into account ratings and remarks from users regarding the content. This is an excellent jumping-off point to explore our content and will give new users an insight into our top-notch PowerPoint Templates.
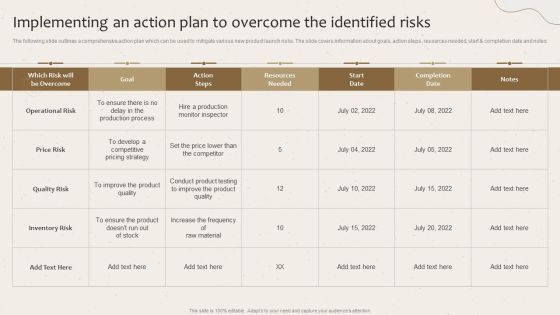
Implementing An Action Plan To Overcome The Identified Risks Launching New Beverage Product Slides PDF
The following slide outlines the key demographics of target audience. The slide covers information about major attributes such as gender composition, age, household income, education level etc. Do you know about Slidesgeeks Implementing An Action Plan To Overcome The Identified Risks Launching New Beverage Product Slides PDF These are perfect for delivering any kind od presentation. Using it, create PowerPoint presentations that communicate your ideas and engage audiences. Save time and effort by using our pre-designed presentation templates that are perfect for a wide range of topic. Our vast selection of designs covers a range of styles, from creative to business, and are all highly customizable and easy to edit. Download as a PowerPoint template or use them as Google Slides themes.

Kpi Metrics Dashboard To Analyze The Effectiveness Of New Product Launch Launching New Beverage Product Diagrams PDF
The following slide outlines key performance indicator KPI dashboard which can be used to measure the success of product launch. The kpis are total units, revenue, average selling price ASP, number of penetrated planned customers etc. Create an editable Kpi Metrics Dashboard To Analyze The Effectiveness Of New Product Launch Launching New Beverage Product Diagrams PDF that communicates your idea and engages your audience. Whether you are presenting a business or an educational presentation, pre-designed presentation templates help save time. Kpi Metrics Dashboard To Analyze The Effectiveness Of New Product Launch Launching New Beverage Product Diagrams PDF is highly customizable and very easy to edit, covering many different styles from creative to business presentations. Slidegeeks has creative team members who have crafted amazing templates. So, go and get them without any delay.

Measuring Revenue From New Product Launch Launching New Beverage Product Slides PDF
The following slide outlines a graphical representation of revenue from new product launch. The revenue is covered from Q1-Q4 2022. Want to ace your presentation in front of a live audience Our Measuring Revenue From New Product Launch Launching New Beverage Product Slides PDF can help you do that by engaging all the users towards you.. Slidegeeks experts have put their efforts and expertise into creating these impeccable powerpoint presentations so that you can communicate your ideas clearly. Moreover, all the templates are customizable, and easy-to-edit and downloadable. Use these for both personal and commercial use.

Quarterly Budget For Offline Marketing Strategies Launching New Beverage Product Formats PDF
The following slide outlines a comprehensible budget sheet for offline marketing strategies. The strategies covered in the slide are guerilla marketing, rewards program and other offline marketing strategies.Present like a pro with Quarterly Budget For Offline Marketing Strategies Launching New Beverage Product Formats PDF Create beautiful presentations together with your team, using our easy-to-use presentation slides. Share your ideas in real-time and make changes on the fly by downloading our templates. So whether you are in the office, on the go, or in a remote location, you can stay in sync with your team and present your ideas with confidence. With Slidegeeks presentation got a whole lot easier. Grab these presentations today.
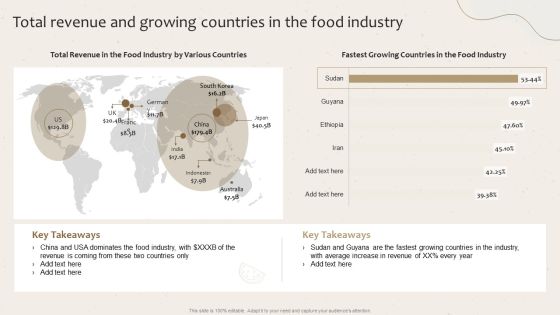
Total Revenue And Growing Countries In The Food Industry Launching New Beverage Product Information PDF
Formulating a presentation can take up a lot of effort and time, so the content and message should always be the primary focus. The visuals of the PowerPoint can enhance the presenters message, so our Total Revenue And Growing Countries In The Food Industry Launching New Beverage Product Information PDF was created to help save time. Instead of worrying about the design, the presenter can concentrate on the message while our designers work on creating the ideal templates for whatever situation is needed. Slidegeeks has experts for everything from amazing designs to valuable content, we have put everything into Total Revenue And Growing Countries In The Food Industry Launching New Beverage Product Information PDF.

Total Revenue From Food And Beverage Stores In The Usa Launching New Beverage Product Mockup PDF
The following slide outlines the industry sales generated from various type of food and beverage stores in the USA. It covers information about the grocery, liquor and specialty food stores. Coming up with a presentation necessitates that the majority of the effort goes into the content and the message you intend to convey. The visuals of a PowerPoint presentation can only be effective if it supplements and supports the story that is being told. Keeping this in mind our experts created Total Revenue From Food And Beverage Stores In The Usa Launching New Beverage Product Mockup PDF to reduce the time that goes into designing the presentation. This way, you can concentrate on the message while our designers take care of providing you with the right template for the situation.

Working Of Food Manufacturing Process Launching New Beverage Product Elements PDF
The following slide outlines a comprehensive flowchart showing the working of food manufacturing process. Information covered in this slide is related to meat, cultivation, concentrate, flour etc. The best PPT templates are a great way to save time, energy, and resources. Slidegeeks have 100 precent editable powerpoint slides making them incredibly versatile. With these quality presentation templates, you can create a captivating and memorable presentation by combining visually appealing slides and effectively communicating your message. Download Working Of Food Manufacturing Process Launching New Beverage Product Elements PDF from Slidegeeks and deliver a wonderful presentation.
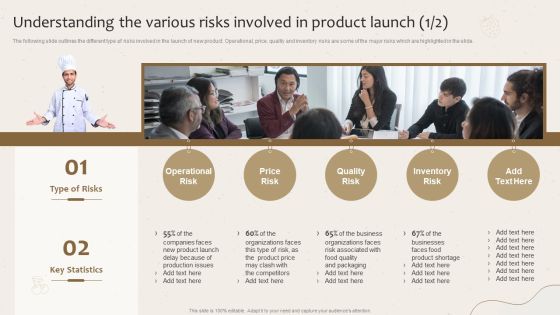
Understanding The Various Risks Involved In Product Launch Launching New Beverage Product Download PDF
Retrieve professionally designed Understanding The Various Risks Involved In Product Launch Launching New Beverage Product Download PDF to effectively convey your message and captivate your listeners. Save time by selecting pre-made slideshows that are appropriate for various topics, from business to educational purposes. These themes come in many different styles, from creative to corporate, and all of them are easily adjustable and can be edited quickly. Access them as PowerPoint templates or as Google Slides themes. You do not have to go on a hunt for the perfect presentation because Slidegeeks got you covered from everywhere.

Brand Performance Overview Market Share And Strategic Promotion Plan To Improve Product Brand Image Structure PDF
Purpose of this slide is to address information about brand performance. Information covered are of competitors, product market share and performance status.Slidegeeks is one of the best resources for PowerPoint templates. You can download easily and regulate Brand Performance Overview Market Share And Strategic Promotion Plan To Improve Product Brand Image Structure PDF for your personal presentations from our wonderful collection. A few clicks is all it takes to discover and get the most relevant and appropriate templates. Use our Templates to add a unique zing and appeal to your presentation and meetings. All the slides are easy to edit and you can use them even for advertisement purposes.

Campaign Sessions And Conversion Performance Dashboard Strategic Promotion Plan To Improve Inspiration PDF
Following slide illustrates campaign session and conversion performance dashboard. It covers details such as revenues, cost per click, transactions, impressions, sessions and conversion performance.Do you have to make sure that everyone on your team knows about any specific topic I yes, then you should give Campaign Sessions And Conversion Performance Dashboard Strategic Promotion Plan To Improve Inspiration PDF a try. Our experts have put a lot of knowledge and effort into creating this impeccable Campaign Sessions And Conversion Performance Dashboard Strategic Promotion Plan To Improve Inspiration PDF. You can use this template for your upcoming presentations, as the slides are perfect to represent even the tiniest detail. You can download these templates from the Slidegeeks website and these are easy to edit. So grab these today.

Competitive Landscape Analysis Based On Market Share Strategic Promotion Plan To Improve Infographics PDF
Mentioned pie chart illustrates companys global and domestic market share. Company A has a larger market share in both the global and domestic markets.Do you have an important presentation coming up Are you looking for something that will make your presentation stand out from the rest Look no further than Competitive Landscape Analysis Based On Market Share Strategic Promotion Plan To Improve Infographics PDF. With our professional designs, you can trust that your presentation will pop and make delivering it a smooth process. And with Slidegeeks, you can trust that your presentation will be unique and memorable. So why wait Grab Competitive Landscape Analysis Based On Market Share Strategic Promotion Plan To Improve Infographics PDF today and make your presentation stand out from the rest.

Determining The Likelihood Of Loosing Sales Deals Strategic Promotion Plan To Improve Product Brand Image Pictures PDF
Purpose of this slide is to address the impact of improved marketing efforts on the likelihood of loosing sales deals. It also demonstrates a 26 precent increase in lead conversion rate.Crafting an eye-catching presentation has never been more straightforward. Let your presentation shine with this tasteful yet straightforward Determining The Likelihood Of Loosing Sales Deals Strategic Promotion Plan To Improve Product Brand Image Pictures PDF template. It offers a minimalistic and classy look that is great for making a statement. The colors have been employed intelligently to add a bit of playfulness while still remaining professional. Construct the ideal Determining The Likelihood Of Loosing Sales Deals Strategic Promotion Plan To Improve Product Brand Image Pictures PDF that effortlessly grabs the attention of your audience Begin now and be certain to wow your customers.

Kpi Dashboard To Monitor Sales Opportunities Strategic Promotion Plan To Improve Product Diagrams PDF
Mentioned slide shows the KPI dashboard that can be used to track win and lost sales opportunities. It includes metrics namely won opportunities, lost opportunities, pipeline by territory, total opportunities.Explore a selection of the finest Kpi Dashboard To Monitor Sales Opportunities Strategic Promotion Plan To Improve Product Diagrams PDF here. With a plethora of professionally designed and pre-made slide templates, you can quickly and easily find the right one for your upcoming presentation. You can use our Kpi Dashboard To Monitor Sales Opportunities Strategic Promotion Plan To Improve Product Diagrams PDF to effectively convey your message to a wider audience. Slidegeeks has done a lot of research before preparing these presentation templates. The content can be personalized and the slides are highly editable. Grab templates today from Slidegeeks.
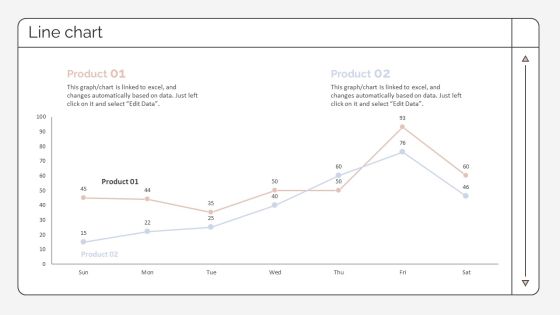
Line Chart Strategic Promotion Plan To Improve Product Brand Image Rules PDF
The best PPT templates are a great way to save time, energy, and resources. Slidegeeks have 100 precent editable powerpoint slides making them incredibly versatile. With these quality presentation templates, you can create a captivating and memorable presentation by combining visually appealing slides and effectively communicating your message. Download Line Chart Strategic Promotion Plan To Improve Product Brand Image Rules PDF from Slidegeeks and deliver a wonderful presentation.
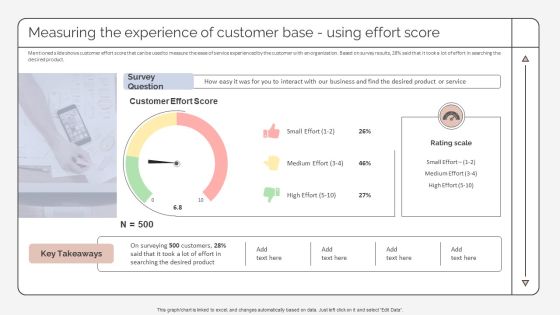
Measuring The Experience Of Customer Base Using Effort Score Strategic Promotion Plan To Improve Microsoft PDF
Mentioned slide shows customer effort score that can be used to measure the ease of service experienced by the customer with an organization. Based on survey results, 28precent said that it took a lot of effort in searching the desired product.Retrieve professionally designed Measuring The Experience Of Customer Base Using Effort Score Strategic Promotion Plan To Improve Microsoft PDF to effectively convey your message and captivate your listeners. Save time by selecting pre-made slideshows that are appropriate for various topics, from business to educational purposes. These themes come in many different styles, from creative to corporate, and all of them are easily adjustable and can be edited quickly. Access them as PowerPoint templates or as Google Slides themes. You do not have to go on a hunt for the perfect presentation because Slidegeeks got you covered from everywhere.
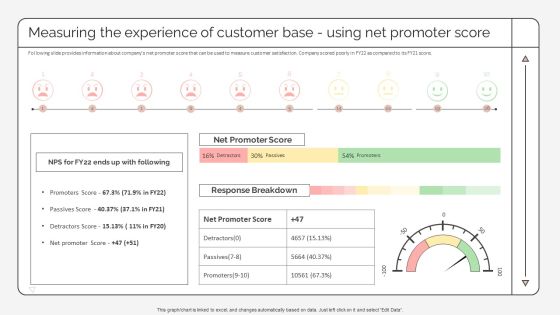
Measuring The Experience Of Customer Base Using Net Promoter Score Strategic Promotion Plan Information PDF
Following slide provides information about companys net promoter score that can be used to measure customer satisfaction. Company scored poorly in FY22 as compared to its FY21 score. Slidegeeks has constructed Measuring The Experience Of Customer Base Using Net Promoter Score Strategic Promotion Plan Information PDF after conducting extensive research and examination. These presentation templates are constantly being generated and modified based on user preferences and critiques from editors. Here, you will find the most attractive templates for a range of purposes while taking into account ratings and remarks from users regarding the content. This is an excellent jumping-off point to explore our content and will give new users an insight into our top-notch PowerPoint Templates.

Measuring The Experience Of Customer Base Using Satisfaction Score Strategic Promotion Plan Rules PDF
This slide illustrates customer satisfaction score that can be used to track how satisfied customers are with companys products or services. It includes the statistics of customer satisfaction based on the survey done by the firm. Presenting this PowerPoint presentation, titled Measuring The Experience Of Customer Base Using Satisfaction Score Strategic Promotion Plan Rules PDF, with topics curated by our researchers after extensive research. This editable presentation is available for immediate download and provides attractive features when used. Download now and captivate your audience. Presenting this Measuring The Experience Of Customer Base Using Satisfaction Score Strategic Promotion Plan Rules PDF. Our researchers have carefully researched and created these slides with all aspects taken into consideration. This is a completely customizable Measuring The Experience Of Customer Base Using Satisfaction Score Strategic Promotion Plan Rules PDF that is available for immediate downloading. Download now and make an impact on your audience. Highlight the attractive features available with our PPTs.

Revenue Generation Statistics By Business Verticals Strategic Promotion Plan To Improve Product Brand Image Sample PDF
This slide shows companys revenue generation statistics by different verticals. Verticals covered are processed food, beverages, personal care, hair care and baby care.Create an editable Revenue Generation Statistics By Business Verticals Strategic Promotion Plan To Improve Product Brand Image Sample PDF that communicates your idea and engages your audience. Whether you are presenting a business or an educational presentation, pre-designed presentation templates help save time. Revenue Generation Statistics By Business Verticals Strategic Promotion Plan To Improve Product Brand Image Sample PDF is highly customizable and very easy to edit, covering many different styles from creative to business presentations. Slidegeeks has creative team members who have crafted amazing templates. So, go and get them without any delay.

Year Over Year Business Performance Comparison Strategic Promotion Plan Pictures PDF
Mentioned slide provides informational statistics showcasing annual business growth. It includes details about revenues, operating profit as well as net profit. Are you in need of a template that can accommodate all of your creative concepts This one is crafted professionally and can be altered to fit any style. Use it with Google Slides or PowerPoint. Include striking photographs, symbols, depictions, and other visuals. Fill, move around, or remove text boxes as desired. Test out color palettes and font mixtures. Edit and save your work, or work with colleagues. Download Year Over Year Business Performance Comparison Strategic Promotion Plan Pictures PDF and observe how to make your presentation outstanding. Give an impeccable presentation to your group and make your presentation unforgettable.

Biyearly Gantt Chart For Multiple Task Project Structure PDF
Pitch your topic with ease and precision using this Biyearly Gantt Chart For Multiple Task Project Structure PDF. This layout presents information on Biyearly Gantt Chart, Multiple Task Project. It is also available for immediate download and adjustment. So, changes can be made in the color, design, graphics or any other component to create a unique layout.

Biyearly Gantt Chart For Project Management Elements PDF
Pitch your topic with ease and precision using this Biyearly Gantt Chart For Project Management Elements PDF. This layout presents information on Designing, Planning, Implementation. It is also available for immediate download and adjustment. So, changes can be made in the color, design, graphics or any other component to create a unique layout.

IP Strategic Management Dashboard Ppt PowerPoint Presentation File Example PDF
This slide provides glimpse about facts and figures related to IP strategic management that can help an organization to ensure IP enforcement. It includes global patent coverage, active patients, etc. Showcasing this set of slides titled IP Strategic Management Dashboard Ppt PowerPoint Presentation File Example PDF. The topics addressed in these templates are Quarterly Annuities, Workload Distribution Firm, Active Patents. All the content presented in this PPT design is completely editable. Download it and make adjustments in color, background, font etc. as per your unique business setting.

Monthly Gantt Bar Chart Wit Department Involvement Inspiration PDF
Pitch your topic with ease and precision using this Monthly Gantt Bar Chart Wit Department Involvement Inspiration PDF. This layout presents information on Product Strategy, Business, Marketing. It is also available for immediate download and adjustment. So, changes can be made in the color, design, graphics or any other component to create a unique layout.

Multiphase Monthly Gantt Bar Chart With Budget Clipart PDF
Pitch your topic with ease and precision using this Multiphase Monthly Gantt Bar Chart With Budget Clipart PDF. This layout presents information on Gantt Bar Chart, Budget. It is also available for immediate download and adjustment. So, changes can be made in the color, design, graphics or any other component to create a unique layout.

Project Monthly Gantt Bar Chart With Completion Status Infographics PDF
Pitch your topic with ease and precision using this Project Monthly Gantt Bar Chart With Completion Status Infographics PDF. This layout presents information on Project, Monthly Gantt Bar Chart. It is also available for immediate download and adjustment. So, changes can be made in the color, design, graphics or any other component to create a unique layout.
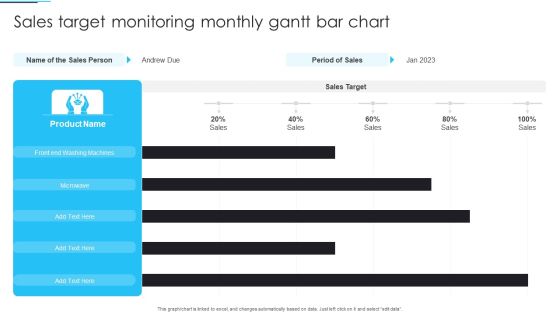
Sales Target Monitoring Monthly Gantt Bar Chart Ideas PDF
Pitch your topic with ease and precision using this Sales Target Monitoring Monthly Gantt Bar Chart Ideas PDF. This layout presents information on Sales Target Monitoring, Monthly Gantt Bar Chart. It is also available for immediate download and adjustment. So, changes can be made in the color, design, graphics or any other component to create a unique layout.

Plastic Waste Recycling Statistics Based On Compound Annual Growth Rate Inspiration PDF
This slide covers statistics based on top countries contribution in plastic recycling and waste management. It includes report from period 2019-2025 with insights based on CAGR. Pitch your topic with ease and precision using this Plastic Waste Recycling Statistics Based On Compound Annual Growth Rate Inspiration PDF. This layout presents information on Contributes Maximum, 2015 To 2025. It is also available for immediate download and adjustment. So, changes can be made in the color, design, graphics or any other component to create a unique layout.

Post Consumer Recycled Plastic Waste Market Statistics With Growth Rate Elements PDF
This slide covers a report on plastic recycling based on future projections. It includes CAGR rate, incremental growth from 2019-2023, annual growth rate, etc. Showcasing this set of slides titled Post Consumer Recycled Plastic Waste Market Statistics With Growth Rate Elements PDF. The topics addressed in these templates are Market Acceleration, Growth CAGR, Incremental Growth, 2021 To 2023. All the content presented in this PPT design is completely editable. Download it and make adjustments in color, background, font etc. as per your unique business setting.
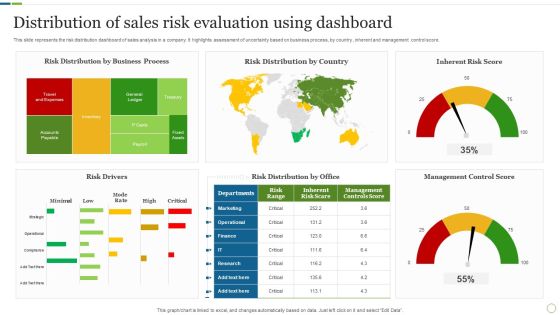
Distribution Of Sales Risk Evaluation Using Dashboard Brochure PDF
This slide represents the risk distribution dashboard of sales analysis in a company. It highlights assessment of uncertainty based on business process, by country , inherent and management control score. Showcasing this set of slides titled Distribution Of Sales Risk Evaluation Using Dashboard Brochure PDF. The topics addressed in these templates are Risk Drivers, Management Control Score, Inherent Risk Score. All the content presented in this PPT design is completely editable. Download it and make adjustments in color, background, font etc. as per your unique business setting.

Evaluation Of Risk Factor Influencing Sales Performance Inspiration PDF
This slide depicts the major factors that influences the sales performance of a company. It includes pie chart with weightage showing initial risks like shortage of raw material, increase in price. Pitch your topic with ease and precision using this Evaluation Of Risk Factor Influencing Sales Performance Inspiration PDF. This layout presents information on Production Cost, Customer Shift, Risk Influencing. It is also available for immediate download and adjustment. So, changes can be made in the color, design, graphics or any other component to create a unique layout.
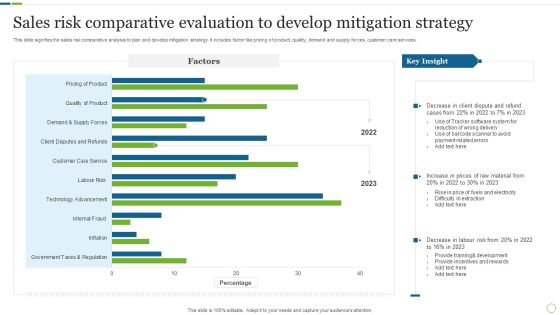
Sales Risk Comparative Evaluation To Develop Mitigation Strategy Rules PDF
This slide signifies the sales risk comparative analysis to plan and develop mitigation strategy. It includes factor like pricing of product, quality, demand and supply forces, customer care services. Showcasing this set of slides titled Sales Risk Comparative Evaluation To Develop Mitigation Strategy Rules PDF. The topics addressed in these templates are Raw Material, Labour Risk, Development. All the content presented in this PPT design is completely editable. Download it and make adjustments in color, background, font etc. as per your unique business setting.

Customer Needs Survey Analysis Dashboard Of Company Inspiration PDF
This slide shows the insights of the survey conducted by an organization to identify the needs of their customers through the help of a dashboard. It shows no. of respondents, types of browser, location, operating system etc. Showcasing this set of slides titled Customer Needs Survey Analysis Dashboard Of Company Inspiration PDF. The topics addressed in these templates are Operating System, Location, Device. All the content presented in this PPT design is completely editable. Download it and make adjustments in color, background, font etc. as per your unique business setting.

Customer Satisfaction Survey Analysis Of It Company Dashboard Themes PDF
This slide shows the insights of survey conducted by an IT company to know whether their customers are satisfied with their services or not and also includes questions related to their services, and suggestions for their improvements. Pitch your topic with ease and precision using this Customer Satisfaction Survey Analysis Of It Company Dashboard Themes PDF. This layout presents information on Organization, Business, Service. It is also available for immediate download and adjustment. So, changes can be made in the color, design, graphics or any other component to create a unique layout.
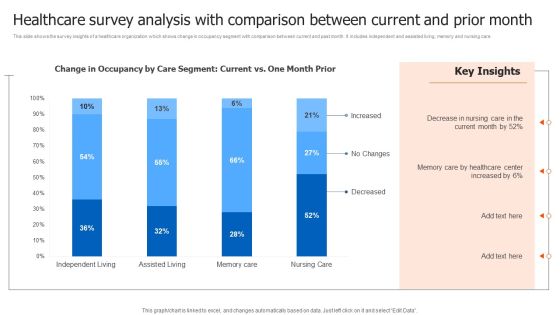
Healthcare Survey Analysis With Comparison Between Current And Prior Month Infographics PDF
This slide shows the survey insights of a healthcare organization which shows change in occupancy segment with comparison between current and past month. It includes independent and assisted living, memory and nursing care. Showcasing this set of slides titled Healthcare Survey Analysis With Comparison Between Current And Prior Month Infographics PDF. The topics addressed in these templates are Healthcare Survey Analysis, Comparison Between Current. All the content presented in this PPT design is completely editable. Download it and make adjustments in color, background, font etc. as per your unique business setting.

Tactical Personnel Planning Model Dashboard Pictures PDF
This slide displays the overall report of the organization workforce. It includes demand and supply , skill analysis , gap analysis and headcount plan. Showcasing this set of slides titled Tactical Personnel Planning Model Dashboard Pictures PDF. The topics addressed in these templates are Tactical Personnel Planning, Model Dashboard. All the content presented in this PPT design is completely editable. Download it and make adjustments in color, background, font etc. as per your unique business setting.

VR Technology Adoption Barriers Ppt PowerPoint Presentation File Portfolio PDF
The following slide highlights adoption barriers for virtual reality technology. It includes components such as barriers in virtual adoption, virtual reality usage in industries, benefits of workforce development in virtual reality such as, give information in real time, develop training in real-life experience etc. Showcasing this set of slides titled VR Technology Adoption Barriers Ppt PowerPoint Presentation File Portfolio PDF. The topics addressed in these templates are Barriers Virtual, Reality Adoption, Benefits Workforce Development, Virtual Reality. All the content presented in this PPT design is completely editable. Download it and make adjustments in color, background, font etc. as per your unique business setting.
VR Technology Market Overview Ppt PowerPoint Presentation Icon Example PDF
The following slide highlights VR technology market overview, including its growth drivers such as increase in smartphone penetration, post COVID-19 growth of virtual reality market and boost in gaming industry. Pitch your topic with ease and precision using this VR Technology Market Overview Ppt PowerPoint Presentation Icon Example PDF. This layout presents information on Growth Drivers, Key Takeaways, Exponential Virtual Reality. It is also available for immediate download and adjustment. So, changes can be made in the color, design, graphics or any other component to create a unique layout.

CRM Team Dashboard Highlighting Major Web Based Platform Kpis Template PDF
This slide showcases customer relationship management CRM team dashboard indicating web portal KPIs. It provides information about cost per acquisition CPA, signups, channel, spend, etc. Pitch your topic with ease and precision using this CRM Team Dashboard Highlighting Major Web Based Platform Kpis Template PDF. This layout presents information on CRM Team Dashboard Highlighting, Web Based Platform Kpis. It is also available for immediate download and adjustment. So, changes can be made in the color, design, graphics or any other component to create a unique layout.

Customer Support Team Web Based Platform Dashboard Demonstration PDF
This slide showcases consumer service team web panel dashboard. It provides information about average customer health, churn rate, lifetime value, net promoter score, first call resolution FCR, etc. Pitch your topic with ease and precision using this Customer Support Team Web Based Platform Dashboard Demonstration PDF. This layout presents information on Churn Rate, Lifetime Value, Customer Health Score. It is also available for immediate download and adjustment. So, changes can be made in the color, design, graphics or any other component to create a unique layout.
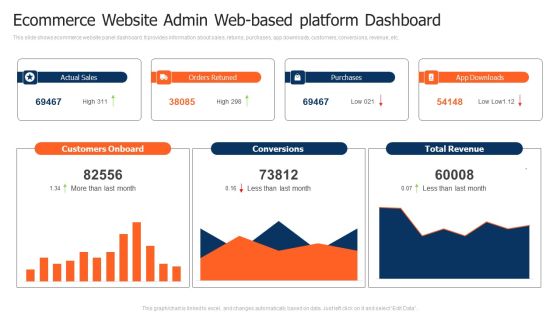
Ecommerce Website Admin Web Based Platform Dashboard Pictures PDF
This slide shows ecommerce website panel dashboard. It provides information about sales, returns, purchases, app downloads, customers, conversions, revenue, etc. Pitch your topic with ease and precision using this Ecommerce Website Admin Web Based Platform Dashboard Pictures PDF. This layout presents information on Customers Onboard, Purchases, Total Revenue. It is also available for immediate download and adjustment. So, changes can be made in the color, design, graphics or any other component to create a unique layout.

Project Management Company Web Based Platform Dashboard Clipart PDF
This slide shows project management firm web panel dashboard. It provides information about active, completed, timeline, current phase, design, intranet, print, etc. Showcasing this set of slides titled Project Management Company Web Based Platform Dashboard Clipart PDF. The topics addressed in these templates are Secured Intranet, Section Design, Timeline. All the content presented in this PPT design is completely editable. Download it and make adjustments in color, background, font etc. as per your unique business setting.

Real Estate Firm Web Based Platform Dashboard Background PDF
This slide shows realtor service web panel dashboard. It provides information about properties for sale, sites for rent, total customers, cities, revenue, sites viewed, listings, reviews, etc. Pitch your topic with ease and precision using this Real Estate Firm Web Based Platform Dashboard Background PDF. This layout presents information on Total Revenue, Rental Locations, Properties For Sale. It is also available for immediate download and adjustment. So, changes can be made in the color, design, graphics or any other component to create a unique layout.
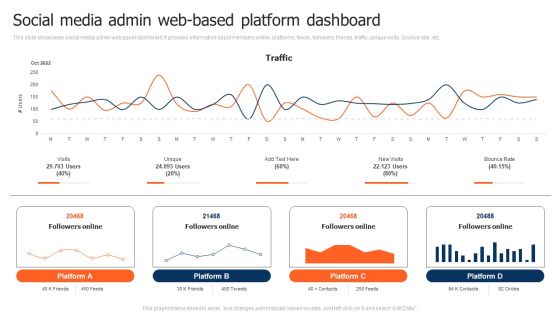
Social Media Admin Web Based Platform Dashboard Demonstration PDF
This slide showcases social media admin web panel dashboard. It provides information about members online, platforms, feeds, followers, friends, traffic, unique visits, bounce rate, etc. Showcasing this set of slides titled Social Media Admin Web Based Platform Dashboard Demonstration PDF. The topics addressed in these templates are Social Media Admin, Web Based Platform Dashboard. All the content presented in this PPT design is completely editable. Download it and make adjustments in color, background, font etc. as per your unique business setting.

Candidate Job Search Web Based Platform Dashboard With Vacancy Status Infographics PDF
This slide candidate job search portal dashboard with vacancy status. It provides information about interviews schedule, application sent, profile viewed, unread message, vacancy stats, etc. Showcasing this set of slides titled Candidate Job Search Web Based Platform Dashboard With Vacancy Status Infographics PDF. The topics addressed in these templates are Candidate Job Search Web Based, Platform Dashboard. All the content presented in this PPT design is completely editable. Download it and make adjustments in color, background, font etc. as per your unique business setting.

Financial Highlights For Construction Company Yearly Report Template PDF
This slide showcases report for construction company annual financial highlights that can help in analyzing the financial health of organization and help investors to make informed decisions. It outlines information about turnover, profit before tax, profit after, equity capital and reserves. Pitch your topic with ease and precision using this Financial Highlights For Construction Company Yearly Report Template PDF. This layout presents information on Reserve And Surplus, Profit, Turnover. It is also available for immediate download and adjustment. So, changes can be made in the color, design, graphics or any other component to create a unique layout.
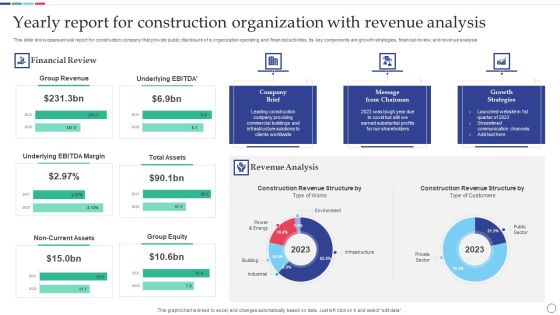
Yearly Report For Construction Organization With Revenue Analysis Topics PDF
This slide showcases annual report for construction company that provide public disclosure of a organization operating and financial activities. Its key components are growth strategies, financial review, and revenue analysis. Showcasing this set of slides titled Yearly Report For Construction Organization With Revenue Analysis Topics PDF. The topics addressed in these templates are Revenue Analysis, Growth Strategies, Customers. All the content presented in this PPT design is completely editable. Download it and make adjustments in color, background, font etc. as per your unique business setting.

Kpi Dashboard To Track Applicant Selection Process Ppt PowerPoint Presentation File Graphics Template PDF
This slide shows dashboard which can be used to monitor the progress of recruitment process. It includes metrics such as applications received, shortlisted applicant, selected candidates, etc. Pitch your topic with ease and precision using this Kpi Dashboard To Track Applicant Selection Process Ppt PowerPoint Presentation File Graphics Template PDF. This layout presents information on Applications Received, Shortlisted Candidates, Selected Candidates. It is also available for immediate download and adjustment. So, changes can be made in the color, design, graphics or any other component to create a unique layout.

Applicant Selection Dashboard To Monitor Recruitment Process Sample PDF
This slide shows dashboard which can be used to track recruitment procedure status. It includes key performance indicators such as total open positions, total roles, selected applicant, application sources, etc. Pitch your topic with ease and precision using this Applicant Selection Dashboard To Monitor Recruitment Process Sample PDF. This layout presents information on Selection Rate, Recruitment Funnel, Application Sources. It is also available for immediate download and adjustment. So, changes can be made in the color, design, graphics or any other component to create a unique layout.

Business Unit Valuation And Development Dashboard Ppt Professional Graphic Tips PDF
This slide shows key performance indicators dashboard which represents number of assets along with their stages of development. It also includes estimated development cost and production index comparison. Pitch your topic with ease and precision using this Business Unit Valuation And Development Dashboard Ppt Professional Graphic Tips PDF. This layout presents information on Estimated Development Cost, Production Index, Development Stage. It is also available for immediate download and adjustment. So, changes can be made in the color, design, graphics or any other component to create a unique layout.
