AI PPT Maker
Templates
PPT Bundles
Design Services
Business PPTs
Business Plan
Management
Strategy
Introduction PPT
Roadmap
Self Introduction
Timelines
Process
Marketing
Agenda
Technology
Medical
Startup Business Plan
Cyber Security
Dashboards
SWOT
Proposals
Education
Pitch Deck
Digital Marketing
KPIs
Project Management
Product Management
Artificial Intelligence
Target Market
Communication
Supply Chain
Google Slides
Research Services
 One Pagers
All Categories
-
Home
- Customer Favorites
- Errc Graph
Errc Graph

Financial Summary Report Showcasing Organization Performance Ppt Show Skills PDF
This slide represents financial statement snapshot depicting organization performance. It covers revenue, cash, expenditure breakdown, cash flow, MRR breakdown etc. Showcasing this set of slides titled Financial Summary Report Showcasing Organization Performance Ppt Show Skills PDF. The topics addressed in these templates are Revenue, Cash, Expenditure Breakdown. All the content presented in this PPT design is completely editable. Download it and make adjustments in color, background, font etc. as per your unique business setting.
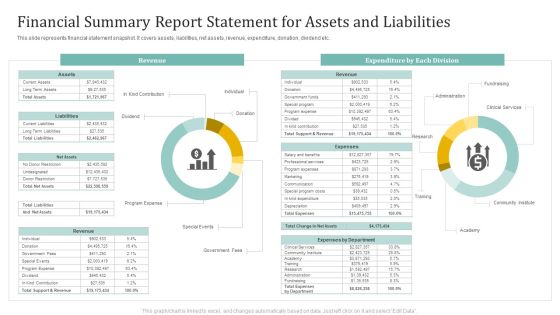
Financial Summary Report Statement For Assets And Liabilities Ppt Slides Guide PDF
This slide represents financial statement snapshot. It covers assets, liabilities, net assets, revenue, expenditure, donation, dividend etc. Pitch your topic with ease and precision using this Financial Summary Report Statement For Assets And Liabilities Ppt Slides Guide PDF. This layout presents information on Revenue, Expenditure Each Division, Fundraising. It is also available for immediate download and adjustment. So, changes can be made in the color, design, graphics or any other component to create a unique layout.
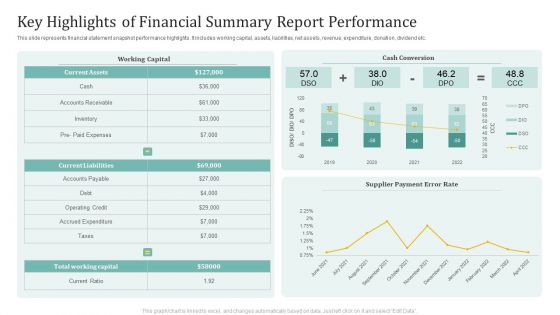
Key Highlights Of Financial Summary Report Performance Ppt Outline Slides PDF
This slide represents financial statement snapshot performance highlights. It includes working capital, assets, liabilities, net assets, revenue, expenditure, donation, dividend etc. Showcasing this set of slides titled Key Highlights Of Financial Summary Report Performance Ppt Outline Slides PDF. The topics addressed in these templates are Working Capital, Cash Conversion, Supplier Payment, Error Rate. All the content presented in this PPT design is completely editable. Download it and make adjustments in color, background, font etc. as per your unique business setting.

Dashboard Highlighting Internal Hiring Sources And Costs Ppt Show Templates PDF
This slide illustrates dashboard for recruiting employees internally. It provides information about sourcing status, yield ratio, hiring pipeline, positions filled, recruitment costs, hire cost per team, etc. Showcasing this set of slides titled Dashboard Highlighting Internal Hiring Sources And Costs Ppt Show Templates PDF. The topics addressed in these templates are Hiring Pipeline, Sourcing Status, Recruitment Costs. All the content presented in this PPT design is completely editable. Download it and make adjustments in color, background, font etc. as per your unique business setting.
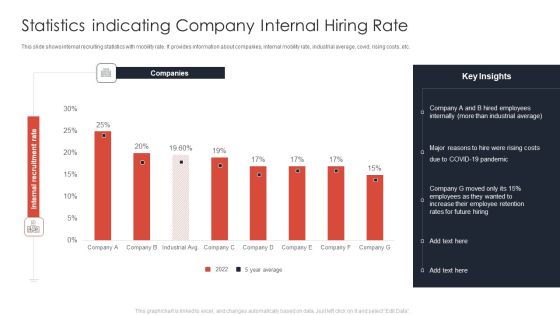
Statistics Indicating Company Internal Hiring Rate Ppt Ideas Templates PDF
This slide shows internal recruiting statistics with mobility rate. It provides information about companies, internal mobility rate, industrial average, covid, rising costs, etc. Showcasing this set of slides titled Statistics Indicating Company Internal Hiring Rate Ppt Ideas Templates PDF. The topics addressed in these templates are Companies, Employees Internally, COVID 19 Pandemic. All the content presented in this PPT design is completely editable. Download it and make adjustments in color, background, font etc. as per your unique business setting.

Creating New Product Launch Campaign Strategy Analyzing Sales Performance Over Last Three Years Structure PDF
Following slide illustrates sales performance highlights of the firm in FY18, FY19 and FY20. Category 4 is the most selling product category over the three years. If your project calls for a presentation, then Slidegeeks is your go to partner because we have professionally designed, easy to edit templates that are perfect for any presentation. After downloading, you can easily edit Creating New Product Launch Campaign Strategy Analyzing Sales Performance Over Last Three Years Structure PDF and make the changes accordingly. You can rearrange slides or fill them with different images. Check out all the handy templates.

Creating New Product Launch Campaign Strategy Annual Sales Highlights Of Us Region Microsoft PDF
Mentioned slide displays annual sales performance highlight of the firm in US region. It also portrays sales performance stats of that firm in FY2020 recorded low sales in South and Northeast America. If you are looking for a format to display your unique thoughts, then the professionally designed Creating New Product Launch Campaign Strategy Annual Sales Highlights Of Us Region Microsoft PDF is the one for you. You can use it as a Google Slides template or a PowerPoint template. Incorporate impressive visuals, symbols, images, and other charts. Modify or reorganize the text boxes as you desire. Experiment with shade schemes and font pairings. Alter, share or cooperate with other people on your work. Download Creating New Product Launch Campaign Strategy Annual Sales Highlights Of Us Region Microsoft PDF and find out how to give a successful presentation. Present a perfect display to your team and make your presentation unforgettable.

Creating New Product Launch Campaign Strategy Dashboard To Measure Sales Rep Performance Introduction PDF
This slide illustrates sales representative performance measurement dashboard with key metrics such as average first contact resolution rate, occupancy rate, NPS and top agents by solved tickets. Make sure to capture your audiences attention in your business displays with our gratis customizable Creating New Product Launch Campaign Strategy Dashboard To Measure Sales Rep Performance Introduction PDF. These are great for business strategies, office conferences, capital raising or task suggestions. If you desire to acquire more customers for your tech business and ensure they stay satisfied, create your own sales presentation with these plain slides.

Creating New Product Launch Campaign Strategy Dashboard To Track Sales Opportunities Professional PDF
Mentioned slide shows dashboard that can be used by an organization to track win and lost sales opportunities. It includes metrics namely won opportunities, lost opportunities, pipeline by territory, total opportunities. Formulating a presentation can take up a lot of effort and time, so the content and message should always be the primary focus. The visuals of the PowerPoint can enhance the presenters message, so our Creating New Product Launch Campaign Strategy Dashboard To Track Sales Opportunities Professional PDF was created to help save time. Instead of worrying about the design, the presenter can concentrate on the message while our designers work on creating the ideal templates for whatever situation is needed. Slidegeeks has experts for everything from amazing designs to valuable content, we have put everything into Creating New Product Launch Campaign Strategy Dashboard To Track Sales Opportunities Professional PDF
Creating New Product Launch Campaign Strategy Defining The Journey Map For Target Customer Icons PDF
This slide shows customer journey map covering stages namely awareness, consideration, decision, delivery and use and loyalty and advocacy. Coming up with a presentation necessitates that the majority of the effort goes into the content and the message you intend to convey. The visuals of a PowerPoint presentation can only be effective if it supplements and supports the story that is being told. Keeping this in mind our experts created Creating New Product Launch Campaign Strategy Defining The Journey Map For Target Customer Icons PDF to reduce the time that goes into designing the presentation. This way, you can concentrate on the message while our designers take care of providing you with the right template for the situation.

Creating New Product Launch Campaign Strategy Kpi Dashboard To Monitor Sales Performance Introduction PDF
This slide shows sales performance monitoring dashboard. Metrics included in the dashboard are sales revenue, sales growth, average revenue per unit, customer lifetime value and customer acquisition cost. This modern and well arranged Creating New Product Launch Campaign Strategy Kpi Dashboard To Monitor Sales Performance Introduction PDF provides lots of creative possibilities. It is very simple to customize and edit with the Powerpoint Software. Just drag and drop your pictures into the shapes. All facets of this template can be edited with Powerpoint no extra software is necessary. Add your own material, put your images in the places assigned for them, adjust the colors, and then you can show your slides to the world, with an animated slide included.
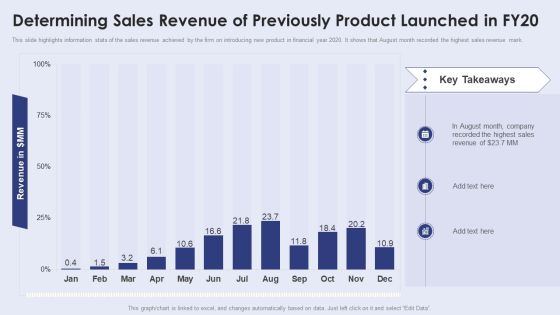
Determining Sales Revenue Of Previously Product Launched In Fy20 Rules PDF
This slide highlights information stats of the sales revenue achieved by the firm on introducing new product in financial year 2020. It shows that August month recorded the highest sales revenue mark. The best PPT templates are a great way to save time, energy, and resources. Slidegeeks have 100 percent editable powerpoint slides making them incredibly versatile. With these quality presentation templates, you can create a captivating and memorable presentation by combining visually appealing slides and effectively communicating your message. Download Determining Sales Revenue Of Previously Product Launched In Fy20 Rules PDF from Slidegeeks and deliver a wonderful presentation.

Data Monetization Approach To Drive Business Growth Impact Of Data Monetization On Firm Growth Sample PDF
This slide depicts information regarding the impact of organic growth in terms of increase in revenues and market share. Are you in need of a template that can accommodate all of your creative concepts. This one is crafted professionally and can be altered to fit any style. Use it with Google Slides or PowerPoint. Include striking photographs, symbols, depictions, and other visuals. Fill, move around, or remove text boxes as desired. Test out color palettes and font mixtures. Edit and save your work, or work with colleagues. Download Data Monetization Approach To Drive Business Growth Impact Of Data Monetization On Firm Growth Sample PDF and observe how to make your presentation outstanding. Give an impeccable presentation to your group and make your presentation unforgettable.

Data Monetization Approach To Drive Business Growth Problem Understanding Through Machine Learning Process Infographics PDF
The customer churn prediction through machine learning is initiated through understanding the insights through two methods classification and regression. Crafting an eye catching presentation has never been more straightforward. Let your presentation shine with this tasteful yet straightforward Data Monetization Approach To Drive Business Growth Problem Understanding Through Machine Learning Process Infographics PDF template. It offers a minimalistic and classy look that is great for making a statement. The colors have been employed intelligently to add a bit of playfulness while still remaining professional. Construct the ideal Data Monetization Approach To Drive Business Growth Problem Understanding Through Machine Learning Process Infographics PDF that effortlessly grabs the attention of your audience. Begin now and be certain to wow your customers.
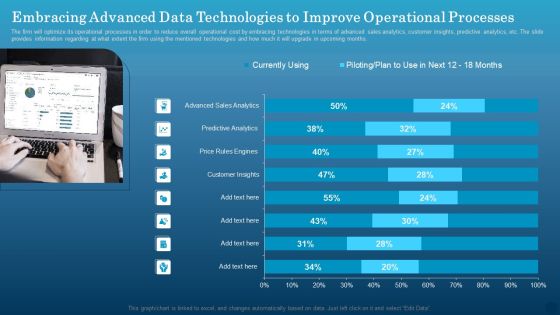
Embracing Advanced Data Technologies To Improve Operational Processes Infographics PDF
The firm will optimize its operational processes in order to reduce overall operational cost by embracing technologies in terms of advanced sales analytics, customer insights, predictive analytics, etc. The slide provides information regarding at what extent the firm using the mentioned technologies and how much it will upgrade in upcoming months. Formulating a presentation can take up a lot of effort and time, so the content and message should always be the primary focus. The visuals of the PowerPoint can enhance the presenters message, so our Embracing Advanced Data Technologies To Improve Operational Processes Infographics PDF was created to help save time. Instead of worrying about the design, the presenter can concentrate on the message while our designers work on creating the ideal templates for whatever situation is needed. Slidegeeks has experts for everything from amazing designs to valuable content, we have put everything into Embracing Advanced Data Technologies To Improve Operational Processes Infographics PDF.

Increase Sales By Lead Generation Lead Distribution Dashboard Information PDF
Crafting an eye catching presentation has never been more straightforward. Let your presentation shine with this tasteful yet straightforward Increase Sales By Lead Generation Lead Distribution Dashboard Information PDF template. It offers a minimalistic and classy look that is great for making a statement. The colors have been employed intelligently to add a bit of playfulness while still remaining professional. Construct the ideal Increase Sales By Lead Generation Lead Distribution Dashboard Information PDF that effortlessly grabs the attention of your audience Begin now and be certain to wow your customers.

Increase Sales By Lead Generation Less Contribution Of Converted Leads Sample PDF
This slide shows the contribution of converted leads and non converted leads from past few months. Coming up with a presentation necessitates that the majority of the effort goes into the content and the message you intend to convey. The visuals of a PowerPoint presentation can only be effective if it supplements and supports the story that is being told. Keeping this in mind our experts created Increase Sales By Lead Generation Less Contribution Of Converted Leads Sample PDF to reduce the time that goes into designing the presentation. This way, you can concentrate on the message while our designers take care of providing you with the right template for the situation.

Increase Sales By Lead Generation Negative Effects On Companys Financials Mockup PDF
This slide shows the negative effects on companys financials such as decrease in total sales and total incomes of the company from last three years. This modern and well arranged Increase Sales By Lead Generation Negative Effects On Companys Financials Mockup PDF provides lots of creative possibilities. It is very simple to customize and edit with the Powerpoint Software. Just drag and drop your pictures into the shapes. All facets of this template can be edited with Powerpoint no extra software is necessary. Add your own material, put your images in the places assigned for them, adjust the colors, and then you can show your slides to the world, with an animated slide included.
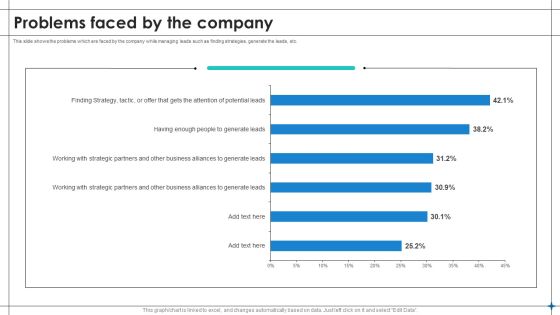
Increase Sales By Lead Generation Problems Faced By The Company Pictures PDF
This slide shows the problems which are faced by the company while managing leads such as finding strategies, generate the leads, etc. This Increase Sales By Lead Generation Problems Faced By The Company Pictures PDF is perfect for any presentation, be it in front of clients or colleagues. It is a versatile and stylish solution for organizing your meetings. The product features a modern design for your presentation meetings. The adjustable and customizable slides provide unlimited possibilities for acing up your presentation. Slidegeeks has done all the homework before launching the product for you. So, dont wait, grab the presentation templates today.

Increase Sales By Lead Generation Sales Dashboard Formats PDF
Explore a selection of the finest Increase Sales By Lead Generation Sales Dashboard Formats PDF here. With a plethora of professionally designed and pre made slide templates, you can quickly and easily find the right one for your upcoming presentation. You can use our Increase Sales By Lead Generation Sales Dashboard Formats PDF to effectively convey your message to a wider audience. Slidegeeks has done a lot of research before preparing these presentation templates. The content can be personalized and the slides are highly editable. Grab templates today from Slidegeeks.

Increase Sales By Lead Generation Total Lead Capture Automation In Percentage Pictures PDF
This slide shows the total lead capture automation in percentage through various channels include Ads. Phone, chat, social, etc. The Increase Sales By Lead Generation Total Lead Capture Automation In Percentage Pictures PDF is a compilation of the most recent design trends as a series of slides. It is suitable for any subject or industry presentation, containing attractive visuals and photo spots for businesses to clearly express their messages. This template contains a variety of slides for the user to input data, such as structures to contrast two elements, bullet points, and slides for written information. Slidegeeks is prepared to create an impression.
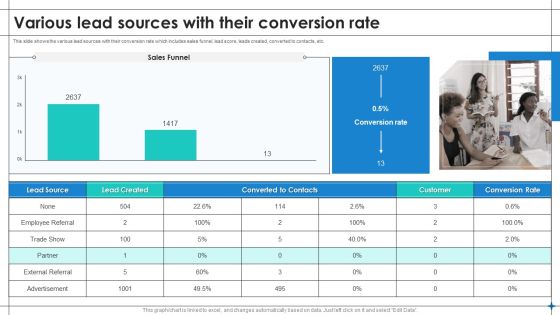
Increase Sales By Lead Generation Various Lead Sources With Their Conversion Rate Microsoft PDF
This slide shows the various lead sources with their conversion rate which includes sales funnel, lead score, leads created, converted to contacts, etc. Are you searching for a Increase Sales By Lead Generation Various Lead Sources With Their Conversion Rate Microsoft PDF that is uncluttered, straightforward, and original Its easy to edit, and you can change the colors to suit your personal or business branding. For a presentation that expresses how much effort youve put in, this template is ideal. With all of its features, including tables, diagrams, statistics, and lists, its perfect for a business plan presentation. Make your ideas more appealing with these professional slides. Download Increase Sales By Lead Generation Various Lead Sources With Their Conversion Rate Microsoft PDF from Slidegeeks today.

Positive Effects On Companys Financials With Lead Management Software Inspiration PDF
This slide shows the positive effects on companys financials with lead management software such as increase in total sales, increase in total income, etc. Retrieve professionally designed Positive Effects On Companys Financials With Lead Management Software Inspiration PDF to effectively convey your message and captivate your listeners. Save time by selecting pre-made slideshows that are appropriate for various topics, from business to educational purposes. These themes come in many different styles, from creative to corporate, and all of them are easily adjustable and can be edited quickly. Access them as PowerPoint templates or as Google Slides themes. You dont have to go on a hunt for the perfect presentation because Slidegeeks got you covered from everywhere.
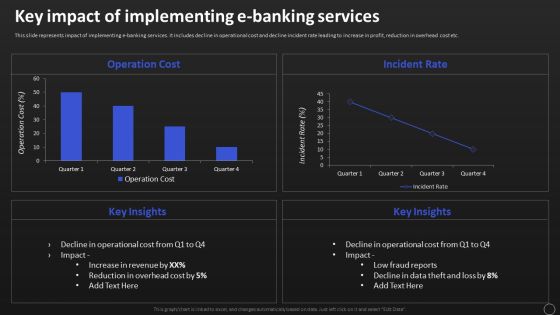
Net Banking Channel And Service Management Key Impact Of Implementing E Banking Services Clipart PDF
This slide represents impact of implementing e banking services. It includes decline in operational cost and decline incident rate leading to increase in profit, reduction in overhead cost etc. Find a pre designed and impeccable Net Banking Channel And Service Management Key Impact Of Implementing E Banking Services Clipart PDF. The templates can ace your presentation without additional effort. You can download these easy to edit presentation templates to make your presentation stand out from others. So, what are you waiting for Download the template from Slidegeeks today and give a unique touch to your presentation.

Net Banking Channel And Service Management Online Banking Dashboard To Track Transactions Professional PDF
This slide represents online banking dashboard for tracking financial transactions. It includes account balance, saving account, current account, income, expenses etc. Boost your pitch with our creative Net Banking Channel And Service Management Online Banking Dashboard To Track Transactions Professional PDF. Deliver an awe inspiring pitch that will mesmerize everyone. Using these presentation templates you will surely catch everyones attention. You can browse the ppts collection on our website. We have researchers who are experts at creating the right content for the templates. So you dont have to invest time in any additional work. Just grab the template now and use them.
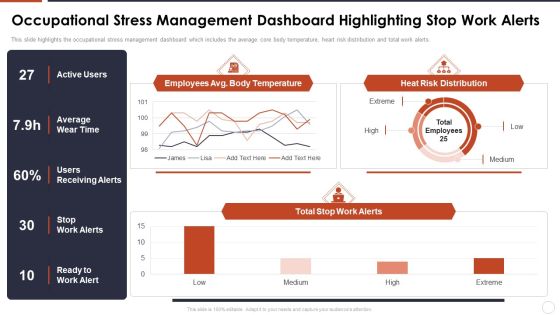
Occupational Stress Management Dashboard Highlighting Stop Work Alerts Background PDF
This slide highlights the occupational stress management dashboard which includes the average core body temperature, heart risk distribution and total work alerts. If you are looking for a format to display your unique thoughts, then the professionally designed Occupational Stress Management Dashboard Highlighting Stop Work Alerts Background PDF is the one for you. You can use it as a Google Slides template or a PowerPoint template. Incorporate impressive visuals, symbols, images, and other charts. Modify or reorganize the text boxes as you desire. Experiment with shade schemes and font pairings. Alter, share or cooperate with other people on your work. Download Occupational Stress Management Dashboard Highlighting Stop Work Alerts Background PDF and find out how to give a successful presentation. Present a perfect display to your team and make your presentation unforgettable.
Stress Management Dashboard With Wellness Tracking And Heart Rate Variability Ideas PDF
This slide highlights the stress management dashboard which showcases the perceived stress scale, heart rate, blood pressure, sleep quality and employee wellness. This Stress Management Dashboard With Wellness Tracking And Heart Rate Variability Ideas PDF is perfect for any presentation, be it in front of clients or colleagues. It is a versatile and stylish solution for organizing your meetings. The product features a modern design for your presentation meetings. The adjustable and customizable slides provide unlimited possibilities for acing up your presentation. Slidegeeks has done all the homework before launching the product for you. So, dont wait, grab the presentation templates today.

KPI Dashboard To Monitor Beauty Care Products Sales Performance Ppt Outline Example Topics PDF
This slide shows the key performance indicators dashboard which can be used to analyze current financial position of cosmetic business. It includes metrics such as sales, expenses, profit, cash in hand, etc. Showcasing this set of slides titled KPI Dashboard To Monitor Beauty Care Products Sales Performance Ppt Outline Example Topics PDF. The topics addressed in these templates are Accounts Receivable, Profit Margin, Expense. All the content presented in this PPT design is completely editable. Download it and make adjustments in color, background, font etc. as per your unique business setting.

KPI Dashboard To Track Beauty Care Products Sales Performance Ppt Outline Pictures PDF
This slide shows the key performance indicators dashboard which can be used to analyze current financial position of cosmetic business. It includes metrics such as sales, expenses, profit, cash in hand, etc. Showcasing this set of slides titled KPI Dashboard To Track Beauty Care Products Sales Performance Ppt Outline Pictures PDF. The topics addressed in these templates are Sales Number, Total Sales, Total Profit, Cost. All the content presented in this PPT design is completely editable. Download it and make adjustments in color, background, font etc. as per your unique business setting.

Call Center Communication Kpis Performance Dashboard With First Call Resolution Rate Graphics PDF
This slide showcases dashboard that can help organization to analyze the performance of call center agents communication KPIs and take necessary actions in case of high abandonment rate. Its key components are average response time, first call resolution and top performing call agents. Showcasing this set of slides titled Call Center Communication Kpis Performance Dashboard With First Call Resolution Rate Graphics PDF. The topics addressed in these templates are Overall Average, Response Time, First Call Resolution, Daily Abandonment Rate. All the content presented in this PPT design is completely editable. Download it and make adjustments in color, background, font etc. as per your unique business setting.

Communication Kpis Performance Dashboard Of Social Media Channels Mockup PDF
This slide showcases dashboard that can help organization to analyze the effectiveness of communication KPIs campaign by studying channel views and number of likes. Its key components are youtube channel views, linkedin shares, linked in clicks and facebook daily reach. Pitch your topic with ease and precision using this Communication Kpis Performance Dashboard Of Social Media Channels Mockup PDF. This layout presents information on Linkedin Shares, Facebook Page likes, Facebook Daily Reach. It is also available for immediate download and adjustment. So, changes can be made in the color, design, graphics or any other component to create a unique layout.

Dashboard For Email Communication Kpis Metrics Topics PDF
This slide showcases email communication KPIs and dashboard that can help to keep track of performance of email marketing campaign. Its key elements are number of campaign, total recipients, average open percent and average click percent. Showcasing this set of slides titled Dashboard For Email Communication Kpis Metrics Topics PDF. The topics addressed in these templates are Number Campaigns, Total Recipients, Engagement Distribution. All the content presented in this PPT design is completely editable. Download it and make adjustments in color, background, font etc. as per your unique business setting.
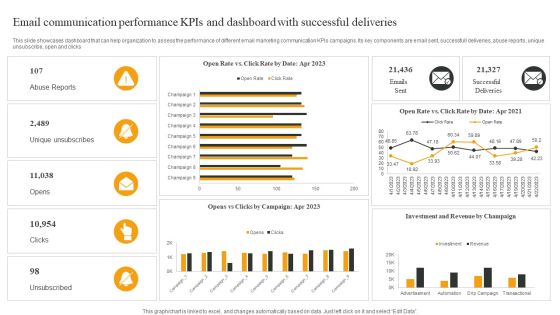
Email Communication Performance Kpis And Dashboard With Successful Deliveries Elements PDF
This slide showcases dashboard that can help organization to assess the performance of different email marketing communication KPIs campaigns. Its key components are email sent, successfull deliveries, abuse reports, unique unsubscribe, open and clicks. Showcasing this set of slides titled Email Communication Performance Kpis And Dashboard With Successful Deliveries Elements PDF. The topics addressed in these templates are Abuse Reports, Unique Unsubscribes, Opens. All the content presented in this PPT design is completely editable. Download it and make adjustments in color, background, font etc. as per your unique business setting.

Internal Organizational Communication Kpis And Dashboard With Channels Infographics PDF
This slide showcases dashboard that can help organization to assess the performance of internal communication and analyzing the user participation. Its key components are message success, channels and user engagement. Pitch your topic with ease and precision using this Internal Organizational Communication Kpis And Dashboard With Channels Infographics PDF. This layout presents information on User Participation, User Engagement, Message Success. It is also available for immediate download and adjustment. So, changes can be made in the color, design, graphics or any other component to create a unique layout.

Internal Organizational Communication Kpis And Dashboard With Delivered Results Designs PDF
This slide showcases internal communication KPIs and dashboard that can help organization to identify the reach of messages and most discussed topics in company. Its key components are delivered results and message type. Showcasing this set of slides titled Internal Organizational Communication Kpis And Dashboard With Delivered Results Designs PDF. The topics addressed in these templates are Most Discussed Topics, All Time, Last Week. All the content presented in this PPT design is completely editable. Download it and make adjustments in color, background, font etc. as per your unique business setting.

Monthly Email Communication Kpis And Dashboard Download PDF
This slide showcases dashboard for email communication KPIs that can help organization to analyze the reach and average response time of customers. Its key elements are send messages, recipients, received messages, senders and monthly email distribution. Pitch your topic with ease and precision using this Monthly Email Communication Kpis And Dashboard Download PDF. This layout presents information on Sent Messages, Recipients, Average Response Time, Received Message. It is also available for immediate download and adjustment. So, changes can be made in the color, design, graphics or any other component to create a unique layout.
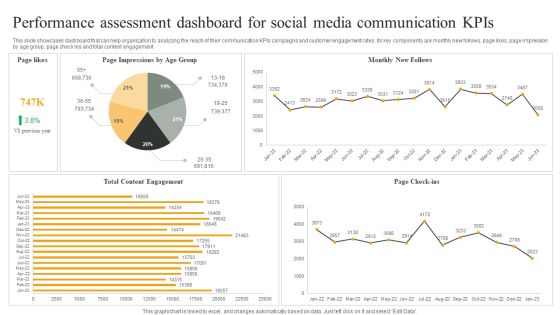
Performance Assessment Dashboard For Social Media Communication Kpis Graphics PDF
This slide showcases dashboard that can help organization to analyzing the reach of their communication KPIs campaigns and customer engagement rates. Its key components are monthly new follows, page likes, page impression by age group, page check ins and total content engagement. Pitch your topic with ease and precision using this Performance Assessment Dashboard For Social Media Communication Kpis Graphics PDF. This layout presents information on Monthly New Follows, Page Check ins, Total Content Engagement. It is also available for immediate download and adjustment. So, changes can be made in the color, design, graphics or any other component to create a unique layout.

Business Disaster Threat Cause Pie Chart Ppt Pictures Gallery PDF
The given below slide showcases the major causes of business disasters to assess and formulate recovery plan accordingly. It mainly includes software failure, data sabotage, ransomware, human error, hardware failure etc. Showcasing this set of slides titled Business Disaster Threat Cause Pie Chart Ppt Pictures Gallery PDF. The topics addressed in these templates are Key Insights, Few Possible Solutions, Implement Data Backup. All the content presented in this PPT design is completely editable. Download it and make adjustments in color, background, font etc. as per your unique business setting.

Five Element Disaster Threat Recovery Status Ppt Outline Inspiration PDF
The below slide presents the disaster risk recovery plan status to have quick insight of vulnerabilities. It includes elements such as systems, services, staff, supplier, sites along with the disruptions and corrective actions. Pitch your topic with ease and precision using this Five Element Disaster Threat Recovery Status Ppt Outline Inspiration PDF. This layout presents information on Health Status, Disruptions, Gaps. It is also available for immediate download and adjustment. So, changes can be made in the color, design, graphics or any other component to create a unique layout.
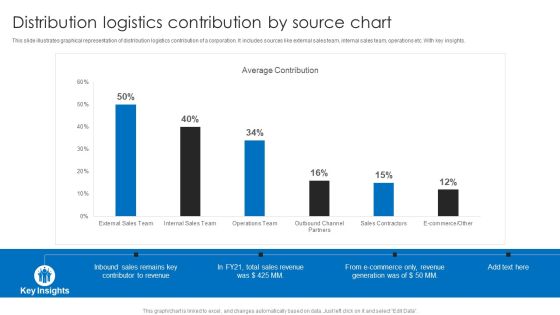
Distribution Logistics Contribution By Source Chart Ppt Model Guidelines PDF
This slide illustrates graphical representation of distribution logistics contribution of a corporation. It includes sources like external sales team, internal sales team, operations etc. With key insights. Showcasing this set of slides titled Distribution Logistics Contribution By Source Chart Ppt Model Guidelines PDF. The topics addressed in these templates are Average Contribution, Total Sales Revenue, E Commerce. All the content presented in this PPT design is completely editable. Download it and make adjustments in color, background, font etc. as per your unique business setting.
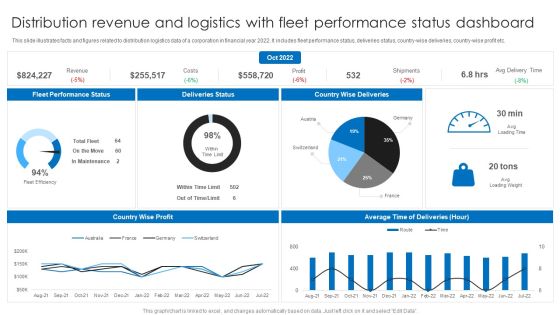
Distribution Revenue And Logistics With Fleet Performance Status Dashboard Ppt Layouts Background PDF
This slide illustrates facts and figures related to distribution logistics data of a corporation in financial year 2022. It includes fleet performance status, deliveries status, country-wise deliveries, country-wise profit etc. Pitch your topic with ease and precision using this Distribution Revenue And Logistics With Fleet Performance Status Dashboard Ppt Layouts Background PDF. This layout presents information on Deliveries Status, Country Wise Deliveries, Fleet Performance Status. It is also available for immediate download and adjustment. So, changes can be made in the color, design, graphics or any other component to create a unique layout.

Performance Strategic Analysis Dashboard For Tactical Management Rules PDF
This slide defines the dashboard for analyzing the sales key performance indicators KPIs. It includes information related to the number of sales, revenue, profit, and cost. Showcasing this set of slides titled Performance Strategic Analysis Dashboard For Tactical Management Rules PDF. The topics addressed in these templates are Revenue, New Customers, Average Revenue, Per Customer. All the content presented in this PPT design is completely editable. Download it and make adjustments in color, background, font etc. as per your unique business setting.

Tactical Planning And Analyzing Organizational Goals Icon Infographics PDF
This slide defines the dashboard for analyzing the sales key performance indicators KPIs. It includes information related to the number of sales, revenue, profit, and cost. Showcasing this set of slides titled Tactical Planning And Analyzing Organizational Goals Icon Infographics PDF. The topics addressed in these templates are Cost Breakdown, Sales Revenue, Accumulated Revenue. All the content presented in this PPT design is completely editable. Download it and make adjustments in color, background, font etc. as per your unique business setting.

Young And Rubicam Brand Asset Valuator Model Guide To Brand Value Themes PDF
Make sure to capture your audiences attention in your business displays with our gratis customizable Young And Rubicam Brand Asset Valuator Model Guide To Brand Value Themes PDF. These are great for business strategies, office conferences, capital raising or task suggestions. If you desire to acquire more customers for your tech business and ensure they stay satisfied, create your own sales presentation with these plain slides.

Brand Health Definition And Metrics To Track Background PDF
Mentioned slide displays overview about brand health covering its definition along with key performance metrics such as net promoter score, customer satisfaction score and share of voice.Presenting this PowerPoint presentation, titled Brand Health Definition And Metrics To Track Background PDF, with topics curated by our researchers after extensive research. This editable presentation is available for immediate download and provides attractive features when used. Download now and captivate your audience. Presenting this Brand Health Definition And Metrics To Track Background PDF. Our researchers have carefully researched and created these slides with all aspects taken into consideration. This is a completely customizable Brand Health Definition And Metrics To Track Background PDF that is available for immediate downloading. Download now and make an impact on your audience. Highlight the attractive features available with our PPTs.

Brand Value By Sector And Economy Guide To Understand Evaluate Mockup PDF
Purpose of this slide is to address the global brand value statistics in 2022. Statistics presented in the slide are by sector and economy. It also shows that technology sector has the highest brand value.Here you can discover an assortment of the finest PowerPoint and Google Slides templates. With these templates, you can create presentations for a variety of purposes while simultaneously providing your audience with an eye catching visual experience. Download Brand Value By Sector And Economy Guide To Understand Evaluate Mockup PDF to deliver an impeccable presentation. These templates will make your job of preparing presentations much quicker, yet still, maintain a high level of quality. Slidegeeks has experienced researchers who prepare these templates and write high quality content for you. Later on, you can personalize the content by editing the Brand Value By Sector And Economy Guide To Understand Evaluate Mockup PDF.

Brand Value Definition And Its Importance Guide To Understand Evaluate And Enhance Structure PDF
Purpose of this slide is to provide an overview about brand value. It include brand value definition as well as its important statistics and elements such as brand awareness, perception, association and loyalty.This Brand Value Definition And Its Importance Guide To Understand Evaluate And Enhance Structure PDF from Slidegeeks makes it easy to present information on your topic with precision. It provides customization options, so you can make changes to the colors, design, graphics, or any other component to create a unique layout. It is also available for immediate download, so you can begin using it right away. Slidegeeks has done good research to ensure that you have everything you need to make your presentation stand out. Make a name out there for a brilliant performance.

Brand Value Measuring KPI Dashboard Guide To Understand Evaluate And Enhance Brand Value Slides PDF
Following slide illustrates KPI dashboard to measure brand value. KPIs covered are brand value and percentage change, brand value over time, most followed brands on social media.Take your projects to the next level with our ultimate collection of Brand Value Measuring KPI Dashboard Guide To Understand Evaluate And Enhance Brand Value Slides PDF. Slidegeeks has designed a range of layouts that are perfect for representing task or activity duration, keeping track of all your deadlines at a glance. Tailor these designs to your exact needs and give them a truly corporate look with your own brand colors they all make your projects stand out from the rest
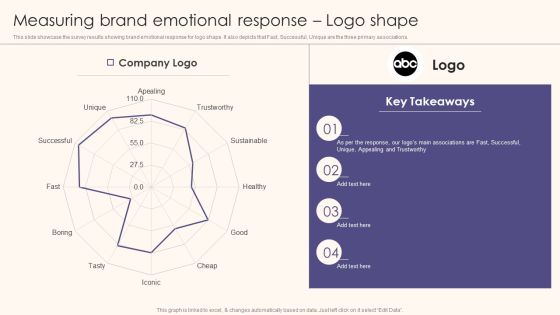
Measuring Brand Emotional Response Logo Shape Guide To Understand Evaluate And Enhance Portrait PDF
This slide showcase the survey results showing brand emotional response for logo shape. It also depicts that Fast, Successful, Unique are the three primary associations. Create an editable Measuring Brand Emotional Response Logo Shape Guide To Understand Evaluate And Enhance Portrait PDF that communicates your idea and engages your audience. Whether you are presenting a business or an educational presentation, pre designed presentation templates help save time. Measuring Brand Emotional Response Logo Shape Guide To Understand Evaluate And Enhance Portrait PDF is highly customizable and very easy to edit, covering many different styles from creative to business presentations. Slidegeeks has creative team members who have crafted amazing templates. So, go and get them without any delay.

Test Conclusion Emotional Index Value Guide To Understand Evaluate And Enhance Brand Value Topics PDF
Present like a pro with Test Conclusion Emotional Index Value Guide To Understand Evaluate And Enhance Brand Value Topics PDF Create beautiful presentations together with your team, using our easy-to-use presentation slides. Share your ideas in real-time and make changes on the fly by downloading our templates. So whether you are in the office, on the go, or in a remote location, you can stay in sync with your team and present your ideas with confidence. With Slidegeeks presentation got a whole lot easier. Grab these presentations today.
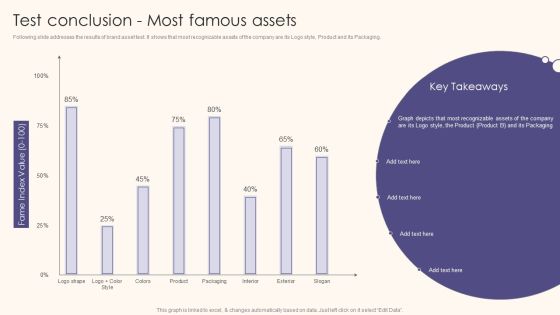
Test Conclusion Most Famous Assets Guide To Understand Evaluate And Enhance Brand Value Slides PDF
Mentioned slide displays the results of brand asset test. It shows that logo having black background is having the highest emotional index value score.Slidegeeks is here to make your presentations a breeze with Test Conclusion Most Famous Assets Guide To Understand Evaluate And Enhance Brand Value Slides PDF With our easy-to-use and customizable templates, you can focus on delivering your ideas rather than worrying about formatting. With a variety of designs to choose from, you are sure to find one that suits your needs. And with animations and unique photos, illustrations, and fonts, you can make your presentation pop. So whether you are giving a sales pitch or presenting to the board, make sure to check out Slidegeeks first.

Construction Site Safety Measure Dashboard To Monitor Construction Site Injuries Clipart PDF
This slide showcase the dashboard to monitor workers injuries at the construction site. It includes details regarding the injuries type, severity. It also covers details of the monthly accident rate, working hours, and the count of injuries by body part.This Construction Site Safety Measure Dashboard To Monitor Construction Site Injuries Clipart PDF is perfect for any presentation, be it in front of clients or colleagues. It is a versatile and stylish solution for organizing your meetings. The product features a modern design for your presentation meetings. The adjustable and customizable slides provide unlimited possibilities for acing up your presentation. Slidegeeks has done all the homework before launching the product for you. So, do not wait, grab the presentation templates today.

Construction Site Safety Measure Key Causes Of Hazards Occurrence On Construction Site Ideas PDF
This slide provides information regarding the major causes of hazards occurrence on worksites such as falls from roofs and ladders, being struck by heavy equipment, electrocutions by loose wiring, and being caught between due to trench cave ins.Are you searching for a Construction Site Safety Measure Key Causes Of Hazards Occurrence On Construction Site Ideas PDF that is uncluttered, straightforward, and original Its easy to edit, and you can change the colors to suit your personal or business branding. For a presentation that expresses how much effort you ve put in, this template is ideal With all of its features, including tables, diagrams, statistics, and lists, its perfect for a business plan presentation. Make your ideas more appealing with these professional slides. Download Construction Site Safety Measure Key Causes Of Hazards Occurrence On Construction Site Ideas PDF from Slidegeeks today.

Construction Site Safety Measure KPI Dashboard To Track Safety Program Performance Slides PDF
This slide reflects the key performance indicator dashboard to track the performance of safety program. It includes information regarding the total manpower, manhours, unsafe conditions, lost time injuries frequency, injuries severity rate, along with the training hours.Slidegeeks has constructed Construction Site Safety Measure KPI Dashboard To Track Safety Program Performance Slides PDF after conducting extensive research and examination. These presentation templates are constantly being generated and modified based on user preferences and critiques from editors. Here, you will find the most attractive templates for a range of purposes while taking into account ratings and remarks from users regarding the content. This is an excellent jumping-off point to explore our content and will give new users an insight into our top-notch PowerPoint Templates.

Construction Site Safety Measure Major Identified Safety Hazards On Construction Site Elements PDF
The purpose of this slide is to visually provide information regarding the major identified safety hazards on construction sites. The key fatal hazards are falls, being struck by objects, electrocutions, caught between objects.Presenting this PowerPoint presentation, titled Construction Site Safety Measure Major Identified Safety Hazards On Construction Site Elements PDF, with topics curated by our researchers after extensive research. This editable presentation is available for immediate download and provides attractive features when used. Download now and captivate your audience. Presenting this Construction Site Safety Measure Major Identified Safety Hazards On Construction Site Elements PDF. Our researchers have carefully researched and created these slides with all aspects taken into consideration. This is a completely customizable Construction Site Safety Measure Major Identified Safety Hazards On Construction Site Elements PDF that is available for immediate downloading. Download now and make an impact on your audience. Highlight the attractive features available with our PPTs.

Construction Site Safety Measure Performance Of Projects Undertaken By The Company Slides PDF
This slide highlights the dashboard to showcase the performance of multiple projects undertaken by the construction company based on KPIs schedule performance index SPI and cost performance index CPI. It also includes details regarding the number of projects undertaken and contracted value.Take your projects to the next level with our ultimate collection of Construction Site Safety Measure Performance Of Projects Undertaken By The Company Slides PDF. Slidegeeks has designed a range of layouts that are perfect for representing task or activity duration, keeping track of all your deadlines at a glance. Tailor these designs to your exact needs and give them a truly corporate look with your own brand colors they all make your projects stand out from the rest.

Construction Site Safety Measure Workers Injuries Incurred At Construction Site Elements PDF
This slide showcase the training plan for the construction site safety program. It includes information regarding the trainer profile, attendees details, safety training type, duration, and expected completion date. It also covers details of learning outcomes and training methods to use.Slidegeeks is one of the best resources for PowerPoint templates. You can download easily and regulate Construction Site Safety Measure Workers Injuries Incurred At Construction Site Elements PDF for your personal presentations from our wonderful collection. A few clicks is all it takes to discover and get the most relevant and appropriate templates. Use our Templates to add a unique zing and appeal to your presentation and meetings. All the slides are easy to edit and you can use them even for advertisement purposes.

Current Cost Incurred By IT Company Information Tech System Maintenance Topics PDF
From laying roadmaps to briefing everything in detail, our templates are perfect for you. You can set the stage with your presentation slides. All you have to do is download these easy-to-edit and customizable templates. Current Cost Incurred By IT Company Information Tech System Maintenance Topics PDF will help you deliver an outstanding performance that everyone would remember and praise you for. Do download this presentation today.
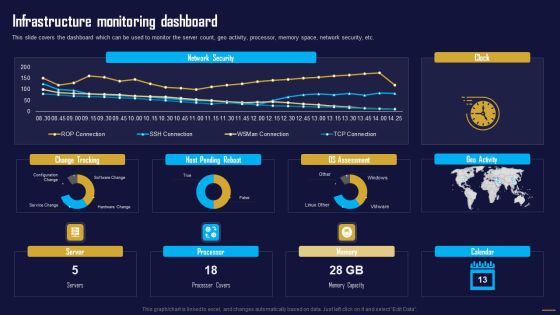
Infrastructure Monitoring Dashboard Information Tech System Maintenance Pictures PDF
This slide covers the dashboard which can be used to monitor the server count, geo activity, processor, memory space, network security, etc.Crafting an eye-catching presentation has never been more straightforward. Let your presentation shine with this tasteful yet straightforward Infrastructure Monitoring Dashboard Information Tech System Maintenance Pictures PDF template. It offers a minimalistic and classy look that is great for making a statement. The colors have been employed intelligently to add a bit of playfulness while still remaining professional. Construct the ideal Infrastructure Monitoring Dashboard Information Tech System Maintenance Pictures PDF that effortlessly grabs the attention of your audience Begin now and be certain to wow your customers.

Current Issues Faced By IT Department Information Tech System Maintenance Ideas PDF
This slide provides the details of the current concerns faced by IT departments based on infrastructure cost, service delay and customer attrition rate.Do you know about Slidesgeeks Current Issues Faced By IT Department Information Tech System Maintenance Ideas PDF These are perfect for delivering any kind od presentation. Using it, create PowerPoint presentations that communicate your ideas and engage audiences. Save time and effort by using our pre-designed presentation templates that are perfect for a wide range of topic. Our vast selection of designs covers a range of styles, from creative to business, and are all highly customizable and easy to edit. Download as a PowerPoint template or use them as Google Slides themes.
