Errc Graph

Coin Graph Finance PowerPoint Presentation Slides R
Microsoft PowerPoint Slides and Backgrounds with bar graph made of gold coins

Coin Graph Finance PowerPoint Presentation Slides S
Microsoft PowerPoint Slides and Backgrounds with bar graph made of gold coins
Business Graph Finance PowerPoint Presentation Slides C
Microsoft Powerpoint Slides and Backgrounds with graph with arrow showing profits and gains

Business Graph Finance PowerPoint Presentation Slides Cc
Microsoft Powerpoint Slides and Backgrounds with graph with arrow showing profits and gains
Business Graph Finance PowerPoint Presentation Slides F
Microsoft Powerpoint Slides and Backgrounds with graph with arrow showing profits and gains
Business Graph Finance PowerPoint Presentation Slides R
Microsoft Powerpoint Slides and Backgrounds with graph with arrow showing profits and gains

Business Graph Finance PowerPoint Presentation Slides S
Microsoft Powerpoint Slides and Backgrounds with graph with arrow showing profits and gains

Profit Graph Business PowerPoint Presentation Slides C
Microsoft PowerPoint Slides and Background with colorful upward profit graph with blue background
Profit Graph Business PowerPoint Presentation Slides Cc
Microsoft PowerPoint Slides and Background with colorful upward profit graph with blue background

Profit Graph Business PowerPoint Presentation Slides F
Microsoft PowerPoint Slides and Background with colorful upward profit graph with blue background
Profit Graph Business PowerPoint Presentation Slides R
Microsoft PowerPoint Slides and Background with colorful upward profit graph with blue background
Profit Graph Business PowerPoint Presentation Slides S
Microsoft PowerPoint Slides and Background with colorful upward profit graph with blue background
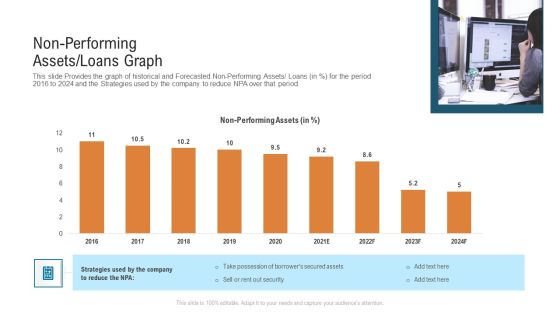
Non Performing Assets Loans Graph Structure PDF
This slide Provides the graph of historical and Forecasted Non Performing Assets or Loans in percentagefor the period 2016 to 2024 and the Strategies used by the company to reduce NPA over that period. Deliver and pitch your topic in the best possible manner with this non performing assets loans graph structure pdf. Use them to share invaluable insights on non performing assets loans graph and impress your audience. This template can be altered and modified as per your expectations. So, grab it now.

Performance Analysis Bar Graph Powerpoint Shapes
This is a performance analysis bar graph powerpoint shapes. This is a four stage process. The stages in this process are growth, finance, strategy, management, marketing.

Bar Graph Ppt PowerPoint Presentation Outline Influencers
This is a bar graph ppt powerpoint presentation outline influencers. This is a four stage process. The stages in this process are business, marketing, management, growth.

Bar Graph Ppt PowerPoint Presentation Gallery Outline
This is a bar graph ppt powerpoint presentation gallery outline. This is a five stage process. The stages in this process are business, marketing, strategy, growth, success.

Bar Graph Ppt PowerPoint Presentation Outline Backgrounds
This is a bar graph ppt powerpoint presentation outline backgrounds. This is a five stage process. The stages in this process are planning, marketing, business, management, strategy.

Bar Graph Ppt PowerPoint Presentation Professional Gridlines
This is a bar graph ppt powerpoint presentation professional gridlines. This is a three stage process. The stages in this process are bar, marketing, strategy, planning, growth.

Bar Graph Ppt PowerPoint Presentation Pictures Picture
This is a bar graph ppt powerpoint presentation pictures picture. This is a three stage process. The stages in this process are business, marketing, strategy, planning, finance.

Area Graph Ppt PowerPoint Presentation Slides Ideas
This is a area graph ppt powerpoint presentation slides ideas. This is a two stage process. The stages in this process are sales in percentage, financial year, product.

Bar Graph Ppt PowerPoint Presentation Inspiration Slides
This is a bar graph ppt powerpoint presentation inspiration slides. This is a six stage process. The stages in this process are sales in percentage, financial year, product.

Bar Graph Ppt PowerPoint Presentation Slides Slideshow
This is a bar graph ppt powerpoint presentation slides slideshow. This is a three stage process. The stages in this process are business, finance, marketing, strategy, planning.

Bar Graph Ppt PowerPoint Presentation Infographics Templates
This is a bar graph ppt powerpoint presentation infographics templates. This is a two stage process. The stages in this process are product, financial years, sales in percentage.

Bar Graph Ppt PowerPoint Presentation Diagrams
This is a bar graph ppt powerpoint presentation diagrams. This is a nine stage process. The stages in this process are business, marketing, success, management, growth.

Bar Graph Ppt PowerPoint Presentation Portfolio Background
This is a bar graph ppt powerpoint presentation portfolio background. This is a four stage process. The stages in this process are sale, years, product.

Bar Graph Ppt PowerPoint Presentation File Portfolio
This is a bar graph ppt powerpoint presentation file portfolio. This is a twelve stage process. The stages in this process are financial, marketing, management, business, strategy.

Bar Graph Ppt PowerPoint Presentation File Picture
This is a bar graph ppt powerpoint presentation file picture. This is a six stage process. The stages in this process are management, planning, marketing, business, strategy.

Bar Graph Ppt PowerPoint Presentation Professional Show
This is a bar graph ppt powerpoint presentation professional show. This is a four stage process. The stages in this process are business, strategy, marketing, planning, finance.

Bar Graph Ppt PowerPoint Presentation Layouts Pictures
This is a bar graph ppt powerpoint presentation layouts pictures. This is a four stage process. The stages in this process are fire, earthquake, axis title, in percentage.

PowerPoint Templates Marketing Puzzle Graph Ppt Designs
PowerPoint Templates Marketing Puzzle Graph PPT Designs-This PowerPoint slide shows 3 puzzles diagram. There is a lot of space available for writing your text. You can easily edit the size, position, text, color. \n\n-PowerPoint Templates Marketing Puzzle Graph PPT Designs

Business Diagram Business Puzzle Graph Consulting Diagram
Your Listeners Will Never Doodle. Our Business Diagram Business Puzzle Graph Consulting Diagram Powerpoint Templates Will Hold Their Concentration. Do The One Thing With Your Thoughts. Uphold Custom With Our Business Diagram Business Puzzle Graph Consulting Diagram Powerpoint Templates.

Bar Graph Ppt PowerPoint Presentation Inspiration
This is a bar graph ppt powerpoint presentation inspiration. This is a five stage process. The stages in this process are bar graph, finance, marketing, strategy, investment, analysis, business, success.

Bar Graph Ppt PowerPoint Presentation Infographic Template
This is a bar graph ppt powerpoint presentation infographic template. This is a six stage process. The stages in this process are business, strategy, bar graph, growth, marketing, analysis.

Bar Graph Ppt PowerPoint Presentation Graphics
This is a bar graph ppt powerpoint presentation graphics. This is a five stage process. The stages in this process are business, strategy, marketing, analysis, success, bar graph, growth.

Bar Graph Ppt PowerPoint Presentation Show Topics
This is a bar graph ppt powerpoint presentation show topics. This is a nine stage process. The stages in this process are business, finance, marketing, strategy, bar graph, growth.

Bar Graph Ppt PowerPoint Presentation Portfolio Outline
This is a bar graph ppt powerpoint presentation portfolio outline. This is a three stage process. The stages in this process are bar graph, finance, marketing, strategy, investment, business.

Bar Graph Ppt PowerPoint Presentation Pictures Tips
This is a bar graph ppt powerpoint presentation pictures tips. This is a five stage process. The stages in this process are bar graph, finance, marketing, strategy, analysis, business.
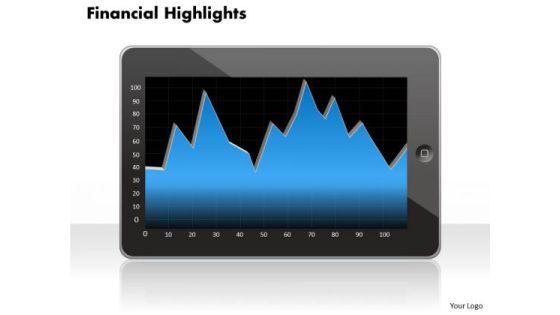
Business Framework Model Financial Graph Consulting Diagram
Document Your Views On Our Business Framework Model Financial Graph Consulting Diagram Powerpoint Templates. They Will Create A Strong Impression.
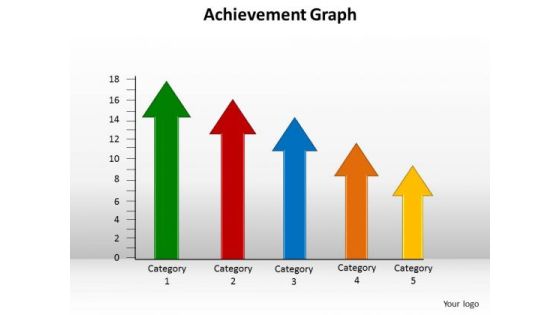
Marketing Diagram Achievement Graph Business Framework Model
Our Marketing Diagram Achievement Graph Business Framework Model Powerpoint Templates Abhor Doodling. They Never Let The Interest Flag.
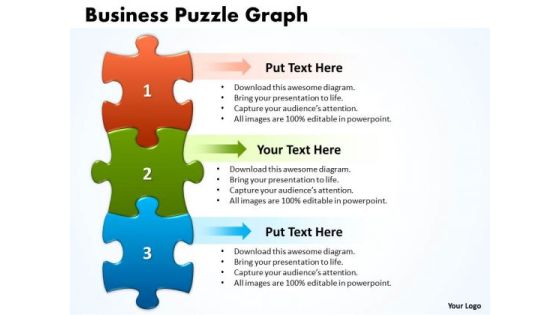
Strategic Management Business Puzzle Graph Business Diagram
Get The Doers Into Action. Activate Them With Our Strategic Management Business Puzzle Graph Business Diagram Powerpoint Templates.

Manufacturing Productivity Analysis Bar Graph Introduction PDF
This slide illustrates the productivity chart of manufacturing of a company. It includes quantity produced in million units against the time period. Pitch your topic with ease and precision using this Manufacturing Productivity Analysis Bar Graph Introduction PDF. This layout presents information on Manufacturing Productivity, Production Decreased, Closure Of Companies. It is also available for immediate download and adjustment. So, changes can be made in the color, design, graphics or any other component to create a unique layout.
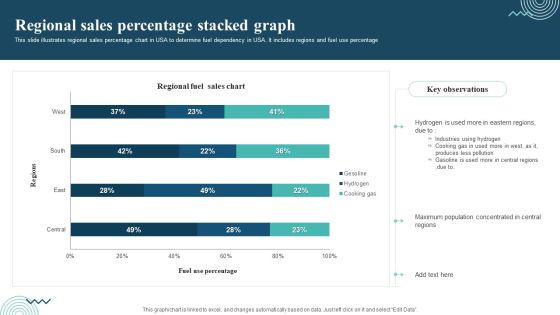
Regional Sales Percentage Stacked Graph Themes PDF
This slide illustrates regional sales percentage chart in USA to determine fuel dependency in USA. It includes regions and fuel use percentage. Pitch your topic with ease and precision using this Regional Sales Percentage Stacked Graph Themes PDF. This layout presents information on Regional Sales, Industries Using Hydrogen, Cooking Gas. It is also available for immediate download and adjustment. So, changes can be made in the color, design, graphics or any other component to create a unique layout.

Graph Down Up Business PowerPoint Template 0510
Business failure and growth graphs and arrows
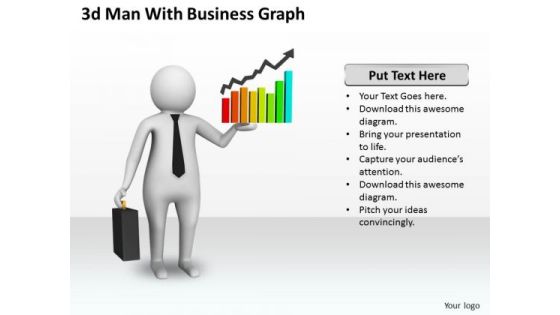
Business Concepts 3d Man With Graph Character
Get Out Of The Dock With Our business concepts 3d man with graph character Powerpoint Templates. Your Mind Will Be Set Free.
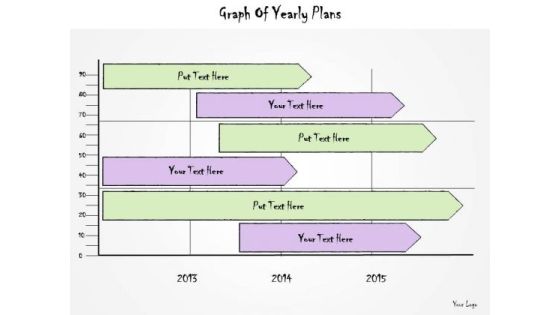
Ppt Slide Graph Of Yearly Plans Sales
Plan For All Contingencies With Our PPT Slide Graph Of Yearly Plans Sales Powerpoint Templates. Douse The Fire Before It Catches.
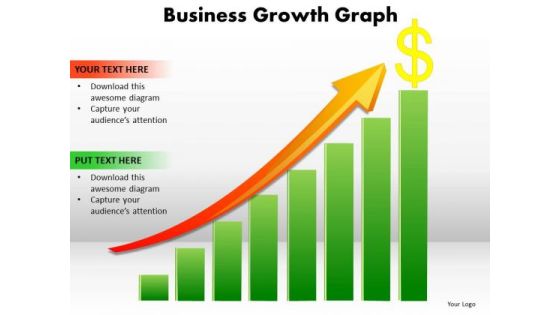
Strategic Management Business Growth Graph Consulting Diagram
Plan For All Contingencies With Our Strategic Management Business Growth Graph Consulting Diagram Powerpoint Templates. Douse The Fire Before It Catches.

Portfolio Evaluation Bar Graph Ppt Slides
This is a portfolio evaluation bar graph ppt slides. This is a five stage process. The stages in this process are business, finance, marketing.
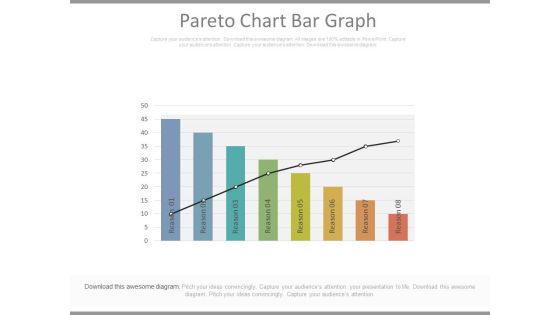
Pareto Chart Bar Graph Ppt Slides
This is a pareto chart bar graph ppt slides. This is a eight stage process. The stages in this process are business, marketing, success.\n
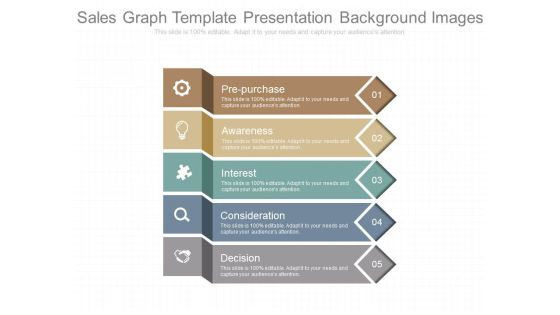
Sales Graph Template Presentation Background Images
This is a sales graph template presentation background images. This is a five stage process. The stages in this process are pre purchase, awareness, interest, consideration, decision.

Business Plan With Bar Graph Powerpoint Guide
This is a business plan with bar graph powerpoint guide. This is a four stage process. The stages in this process are sales, years, net profit, gross profit.

Product Portfolio Graph Diagram Powerpoint Slides
This is a product portfolio graph diagram powerpoint slides. This is a eight stage process. The stages in this process are revenue, launch, growth, maturity, decline.
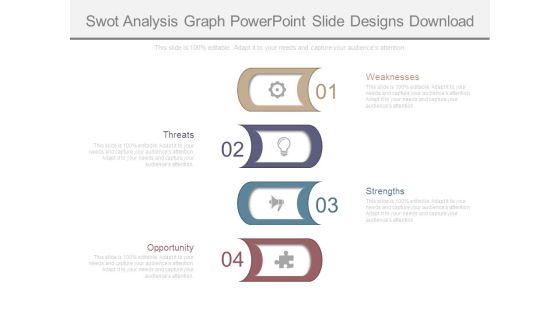
Swot Analysis Graph Powerpoint Slide Designs Download
This is a swot analysis graph powerpoint slide designs download. This is a four stage process. The stages in this process are threats, opportunity, weaknesses, strengths.

Product Development Analysis Bar Graph Powerpoint Themes
This is a product development analysis bar graph powerpoint themes. This is a five stage process. The stages in this process are business, growth, strategy, management, pretention.
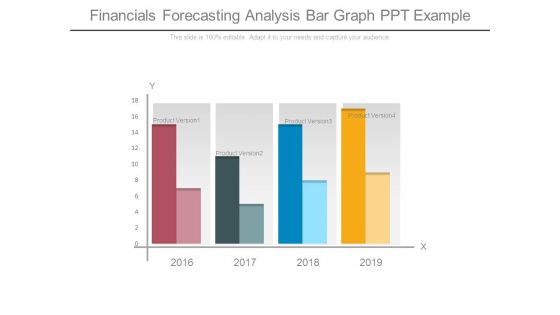
Financials Forecasting Analysis Bar Graph Ppt Example
This is a financials forecasting analysis bar graph ppt example. This is a four stage process. The stages in this process are product version.
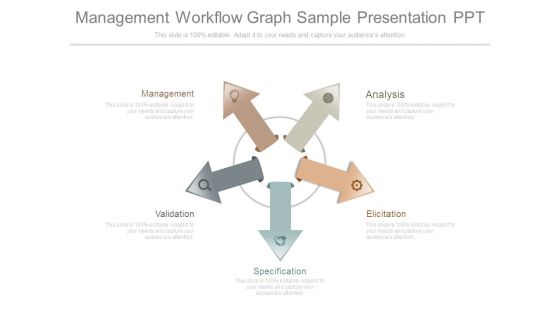
Management Workflow Graph Sample Presentation Ppt
This is a management workflow graph sample presentation ppt. This is a five stage process. The stages in this process are management, analysis, validation, specification, elicitation.

Money Need Assessment Analysis Graph Ppt Examples
This is a money need assessment analysis graph ppt examples. This is a two stage process. The stages in this process are production, marketing, need, money, finance.

Band Engagement Analysis Bar Graph Powerpoint Ideas
This is a band engagement analysis bar graph powerpoint ideas. This is a four stage process. The stages in this process are engagement, brand, monthly, weekly.
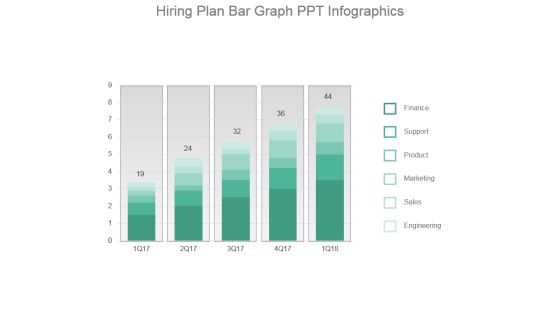
Hiring Plan Bar Graph Ppt Infographics
This is a hiring plan bar graph ppt infographics. This is a five stage process. The stages in this process are finance, support, product, marketing, sales, engineering.

Graph For Referral Marketing Powerpoint Layout
This is a graph for referral marketing powerpoint layout. This is a three stage process. The stages in this process are series.

Bar Graph Ppt PowerPoint Presentation Slide Download
This is a bar graph ppt powerpoint presentation slide download. This is a five stage process. The stages in this process are arrow, business, bargraph, growth, success.

 Home
Home