Errc Graph
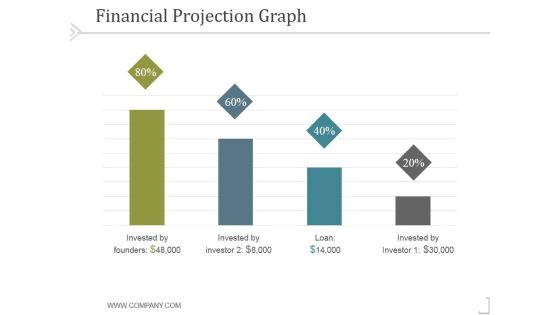
Financial Projection Graph Template 1 Ppt PowerPoint Presentation Model
This is a financial projection graph template 1 ppt powerpoint presentation model. This is a four stage process. The stages in this process are business, strategy, marketing, success, analysis.
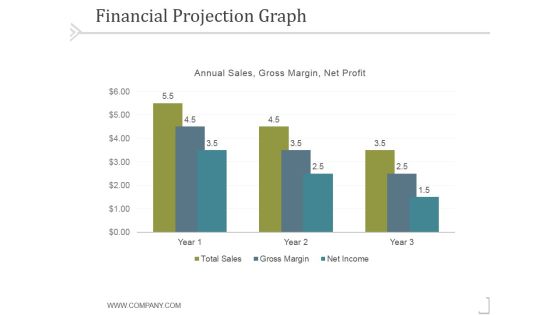
Financial Projection Graph Template 2 Ppt PowerPoint Presentation Template
This is a financial projection graph template 2 ppt powerpoint presentation template. This is a three stage process. The stages in this process are business, strategy, marketing, success, analysis.

Financial Projection Graph Template 1 Ppt PowerPoint Presentation Graphics
This is a financial projection graph template 1 ppt powerpoint presentation graphics. This is a three stage process. The stages in this process are annual sales, business, management, marketing, strategy.

Financial Projection Graph Template 2 Ppt PowerPoint Presentation Ideas
This is a financial projection graph template 2 ppt powerpoint presentation ideas. This is a nine stage process. The stages in this process are annual sales, business, management, marketing, strategy.

Financial Projection Graph Template 1 Ppt PowerPoint Presentation Clipart
This is a financial projection graph template 1 ppt powerpoint presentation clipart. This is a three stage process. The stages in this process are annual, sales, forecast, finance, marketing.
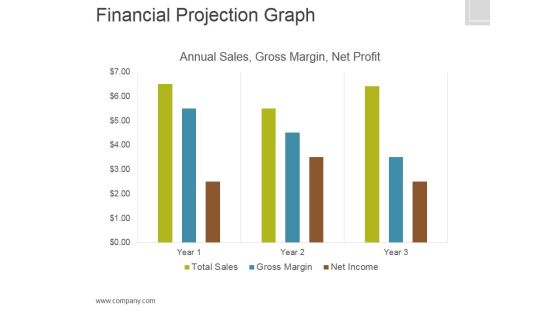
Financial Projection Graph Template 2 Ppt PowerPoint Presentation Graphics
This is a financial projection graph template 2 ppt powerpoint presentation graphics. This is a three stage process. The stages in this process are annual sales, gross margin, net profit, finance.

Gap Analysis Graph Ppt PowerPoint Presentation Portfolio Topics
This is a gap analysis graph ppt powerpoint presentation portfolio topics. This is a four stage process. The stages in this process are potential performance, diversification, product development, market growth, market penetration, actual performance.
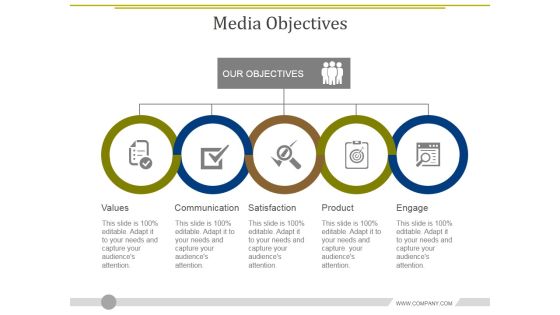
Media Objectives Template 2 Ppt PowerPoint Presentation Diagram Graph Charts
This is a media objectives template 2 ppt powerpoint presentation diagram graph charts. This is a five stage process. The stages in this process are values, communication, satisfaction, product, engage.
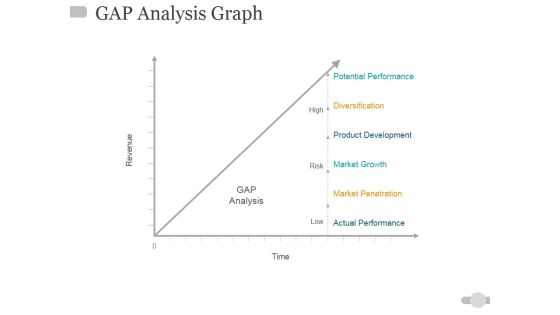
Gap Analysis Graph Ppt PowerPoint Presentation Inspiration Picture
This is a gap analysis graph ppt powerpoint presentation inspiration picture. This is a one stage process. The stages in this process are high, risk, low, time, gap analysis, revenue.

Bar Graph Ppt PowerPoint Presentation Summary Infographic Template
This is a bar graph ppt powerpoint presentation summary infographic template. This is a seven stage process. The stages in this process are business, strategy, marketing, analysis, growth strategy.
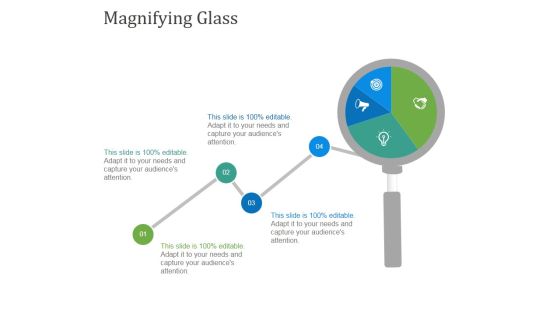
Magnifying Glass Ppt PowerPoint Presentation Diagram Graph Charts
This is a magnifying glass ppt powerpoint presentation diagram graph charts. This is a one stage process. The stages in this process are magnifying glass, planning, marketing, business, management, strategy.

Our Goal Ppt PowerPoint Presentation Diagram Graph Charts
This is a our goal ppt powerpoint presentation diagram graph charts. This is a three stage process. The stages in this process are trust and sincerity, reliability, commitment and dedication.

Gap Analysis Graph Ppt Powerpoint Presentation Gallery Sample
This is a gap analysis graph ppt powerpoint presentation gallery sample. This is a six stage process. The stages in this process are potential performance, diversification, market growth, market penetration.
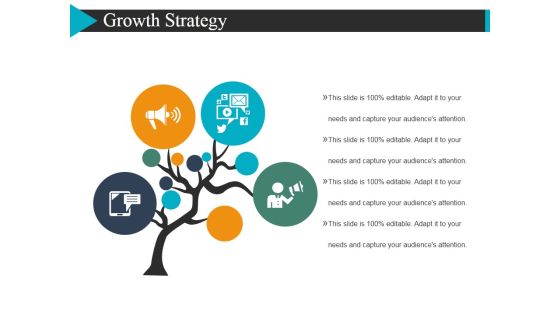
Growth Strategy Template 2 Ppt Powerpoint Presentation Diagram Graph Charts
This is a growth strategy template 2 ppt powerpoint presentation diagram graph charts. This is a four stage process. The stages in this process are tree, marketing, business, icons.

Gap Analysis Graph Ppt PowerPoint Presentation Slides Graphics Pictures
This is a gap analysis graph ppt powerpoint presentation slides graphics pictures. This is a five stage process. The stages in this process are revenue, time, high, low, risk.
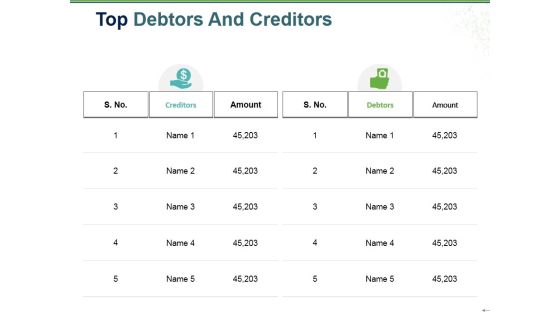
Top Debtors And Creditors Ppt PowerPoint Presentation Diagram Graph Charts
This is a top debtors and creditors ppt powerpoint presentation diagram graph charts. This is a five stage process. The stages in this process are amount, creditors, debtors, icons, strategy.

Knowledge On Our Competitors Ppt PowerPoint Presentation Diagram Graph Charts
This is a knowledge on our competitors ppt powerpoint presentation diagram graph charts. This is a six stage process. The stages in this process are services, strategy, quality, prices, other.
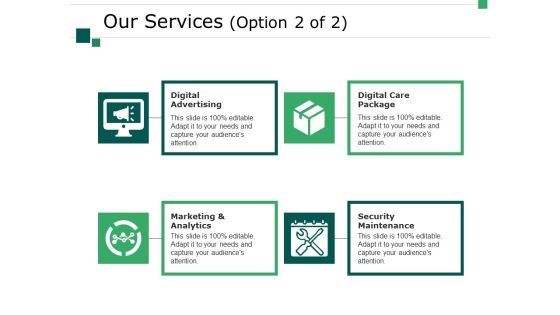
Our Services Template 2 Ppt PowerPoint Presentation Diagram Graph Charts
This is a our services template 2 ppt powerpoint presentation diagram graph charts. This is a four stage process. The stages in this process are business, digital advertising, digital care package, security maintenance, marketing and analytics, marketing, icons.

Machine Learning Main Points Ppt PowerPoint Presentation Diagram Graph Charts
This is a machine learning main points ppt powerpoint presentation diagram graph charts. This is a four stages process. The stages in this process are learning, pattern detection, programming, data, machine learning main points.

Clustered Column Graph Finance Investment Ppt PowerPoint Presentation Outline Icons
This is a clustered column graph finance investment ppt powerpoint presentation outline icons. This is a three stage process. The stages in this process are finance, investment, business, marketing, analysis.

Clustered Bar Graph Ppt PowerPoint Presentation Pictures Example File
This is a clustered bar graph ppt powerpoint presentation pictures example file. This is a two stage process. The stages in this process are finance, marketing, management, investment, analysis.

Bar Graph Financial Sales Product Ppt PowerPoint Presentation Icon Vector
This is a bar graph financial sales product ppt powerpoint presentation icon vector. This is a five stage process. The stages in this process are business, management, financial, marketing, sales.

Price Quality Relationship Graph Ppt PowerPoint Presentation Show Design Templates
This is a price quality relationship graph ppt powerpoint presentation show design templates. This is a two stage process. The stages in this process are cost benefit analysis, cost benefit investigation, cost benefit examination.

Bar Graph Finance Ppt PowerPoint Presentation Infographics Designs Download
This is a bar graph finance ppt powerpoint presentation infographics designs download. This is a three stage process. The stages in this process are finance, marketing, management, investment, analysis.

Successful Employee Referral Programs Ppt PowerPoint Presentation Diagram Graph Charts
This is a successful employee referral programs ppt powerpoint presentation diagram graph charts. This is a three stage process. The stages in this process are successful employee referral programs.

Bar Graph Employee Value Proposition Ppt PowerPoint Presentation File Layout
This is a bar graph employee value proposition ppt powerpoint presentation file layout. This is a three stage process. The stages in this process are business, management, strategy, analysis, marketing.
Growth Trend Arrow Graph Icon Ppt PowerPoint Presentation Summary Model
This is a growth trend arrow graph icon ppt powerpoint presentation summary model. This is a one stage process. The stages in this process are growth, upward trends, uptrends, upward arrow.

Decline Arrow Graph Ppt PowerPoint Presentation Pictures Portfolio
This is a decline arrow graph ppt powerpoint presentation pictures portfolio. This is a four stage process The stages in this process are downward step, downward phases, downward process.

Career Promotion Graph Growth Ppt PowerPoint Presentation Infographics Show
This is a career promotion graph growth ppt powerpoint presentation infographics show. This is a three stage process. The stages in this process are career progression, career aspiration, career promotion powerpoint presentation slides.

Graph With Growth Arrow Vector Ppt Powerpoint Presentation Gallery Show
This is a graph with growth arrow vector ppt powerpoint presentation gallery show. This is a three stage process. The stages in this process are accelerator, seed accelerators, startup accelerator.

Product Comparison Data Bar Graph Ppt Powerpoint Presentation Slides Show
This is a product comparison data bar graph ppt powerpoint presentation slides show. This is a four stage process. The stages in this process are data presentation, content presentation, information presentation.

Commodities Exchange Basics Ppt Powerpoint Presentation Diagram Graph Charts
This is a commodities exchange basics ppt powerpoint presentation diagram graph charts. This is a four stage process. The stages in this process are finance, marketing, management, investment, analysis.

Bar Graph Marketing Process Ppt PowerPoint Presentation Ideas Example Introduction
This is a bar graph marketing process ppt powerpoint presentation ideas example introduction. This is a three stage process. The stages in this process are finance, management, strategy, analysis, marketing.

Column Chart And Graph Ppt PowerPoint Presentation File Introduction
This is a column chart and graph ppt powerpoint presentation file introduction. This is a three stage process. The stages in this process are finance, marketing, management, investment, analysis.

Clustered Column Line Graph Ppt PowerPoint Presentation Ideas Demonstration
This is a clustered column line graph ppt powerpoint presentation ideas demonstration. This is a three stage process. The stages in this process are financial, minimum, maximum, marketing, strategy.
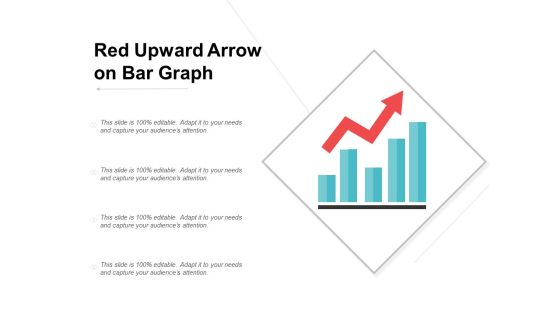
Red Upward Arrow On Bar Graph Ppt Powerpoint Presentation Infographics
This is a red upward arrow on bar graph ppt powerpoint presentation infographics. This is a four stage process. The stages in this process are increasing arrows, improving arrows, growing arrows.

Scatter Bubble Chart Graph Ppt PowerPoint Presentation Infographic Template Maker
This is a scatter bubble chart graph ppt powerpoint presentation infographic template maker. This is a two stage process. The stages in this process are finance, marketing, management, investment, analysis.

Donut Pie Chart Graph Ppt PowerPoint Presentation File Styles
This is a donut pie chart graph ppt powerpoint presentation file styles. This is a three stage process. The stages in this process are finance, marketing, management, investment, analysis.

Stacked Bar Graph Ppt PowerPoint Presentation Portfolio Slide Portrait
This is a stacked bar graph ppt powerpoint presentation portfolio slide portrait. This is a three stage process. The stages in this process are finance, marketing, management, investment, analysis.

Clustered Bar Graph Ppt PowerPoint Presentation Model Background Designs
This is a clustered bar graph ppt powerpoint presentation model background designs. This is a three stage process. The stages in this process are finance, marketing, management, investment, analysis.

Donut Pie Chart Graph Ppt PowerPoint Presentation Ideas Guidelines
This is a donut pie chart graph ppt powerpoint presentation ideas guidelines. This is a three stage process. The stages in this process are finance, marketing, management, investment, analysis.

Clustered Column Line Graph Ppt PowerPoint Presentation File Clipart
This is a clustered column line graph ppt powerpoint presentation file clipart. This is a three stage process. The stages in this process are finance, marketing, management, investment, analysis.

Combo Chart Graph Ppt PowerPoint Presentation Infographic Template Layout Ideas
This is a combo chart graph ppt powerpoint presentation infographic template layout ideas. This is a three stage process. The stages in this process are finance, marketing, analysis, investment, million.

Clustered Column Line Graph Ppt PowerPoint Presentation Inspiration Deck
This is a clustered column line graph ppt powerpoint presentation inspiration deck. This is a three stage process. The stages in this process are finance, marketing, analysis, investment, million.

Bar Graph Finance Ppt PowerPoint Presentation Outline Background Designs
This is a bar graph finance ppt powerpoint presentation outline background designs. This is a three stage process. The stages in this process are financial, maximum, medium, minimum, marketing.
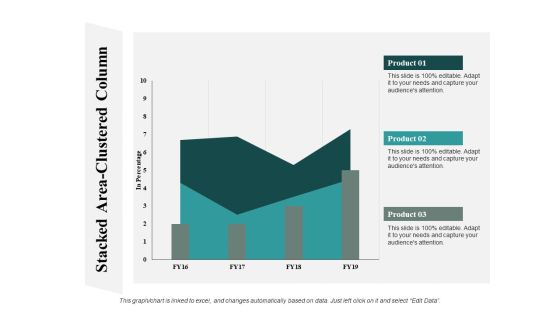
Stacked Area Clustered Column Graph Ppt PowerPoint Presentation Summary Guide
This is a stacked area clustered column graph ppt powerpoint presentation summary guide. This is a three stage process. The stages in this process are finance, marketing, analysis, investment, million.

Bar Graph With Red Progressive Arrow Ppt PowerPoint Presentation Outline
This is a bar graph with red progressive arrow ppt powerpoint presentation outline. This is a three stage process. The stages in this process are rising arrow, growing arrow, increasing arrow.

Combo Chart Graph Ppt PowerPoint Presentation Gallery Designs Download
This is a combo chart graph ppt powerpoint presentation gallery designs download. This is a three stage process. The stages in this process are finance, marketing, analysis, investment, million.

Area Chart Graph Ppt PowerPoint Presentation Professional Format Ideas
This is a column chart graph ppt powerpoint presentation slides file formats. This is a stage three process. The stages in this process are finance, marketing, analysis, investment, million.

Bar Graph Finance Ppt PowerPoint Presentation Pictures Portrait
This is a bar graph finance ppt powerpoint presentation pictures portrait. The topics discussed in this diagram are marketing, business, management, planning, strategy This is a completely editable PowerPoint presentation, and is available for immediate download.

Clustered Bar Graph Ppt PowerPoint Presentation File Design Inspiration
This is a clustered bar graph ppt powerpoint presentation file design inspiration. The topics discussed in this diagram are marketing, business, management, planning, strategy This is a completely editable PowerPoint presentation, and is available for immediate download.

Bubble Chart Graph Ppt PowerPoint Presentation Ideas Outfit
This is a bubble chart graph ppt powerpoint presentation ideas outfit. The topics discussed in this diagram are marketing, business, management, planning, strategy This is a completely editable PowerPoint presentation, and is available for immediate download.

Marketing Management Dashboard Graph Ppt PowerPoint Presentation Infographic Template Portfolio
This is a marketing management dashboard graph ppt powerpoint presentation infographic template portfolio. The topics discussed in this diagram are marketing, business, management, planning, strategy This is a completely editable PowerPoint presentation, and is available for immediate download.

Stacked Bar Graph Ppt PowerPoint Presentation Layouts Inspiration
This is a stacked bar graph ppt powerpoint presentation layouts inspiration. The topics discussed in this diagram are marketing, business, management, planning, strategy This is a completely editable PowerPoint presentation, and is available for immediate download.

Clustered Bar Graph Ppt PowerPoint Presentation Outline Ideas
This is a clustered bar graph ppt powerpoint presentation outline ideas. The topics discussed in this diagram are marketing, business, management, planning, strategy This is a completely editable PowerPoint presentation, and is available for immediate download.

Bar Graph Business PowerPoint Templates And PowerPoint Themes 0512
Bar Graph Business PowerPoint Templates And PowerPoint Themes 0512-Microsoft Powerpoint Templates and Background with graph of business-These high quality PowerPoint templates and PowerPoint images are carefully selected by our team of professionals to convey your ideas in a visually appealing manner. Each download contains a text and print slide. The text and print slides show up automatically when you insert a new slide in the downloaded template
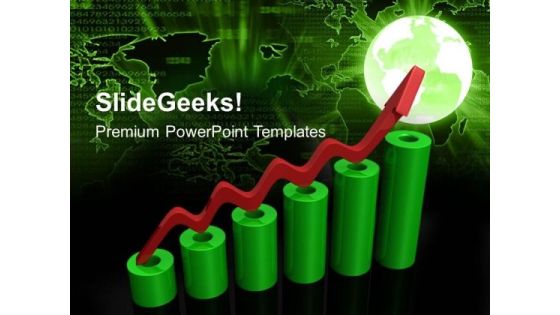
Bar Graph Success PowerPoint Templates And PowerPoint Themes 0512
Bar Graph Success PowerPoint Templates And PowerPoint Themes 0512-Microsoft Powerpoint Templates and Background with graph of business-These high quality PowerPoint templates and PowerPoint images are carefully selected by our team of professionals to convey your ideas in a visually appealing manner. Each download contains a text and print slide. The text and print slides show up automatically when you insert a new slide in the downloaded template

Cylinderical Bar Graph Business PowerPoint Templates And PowerPoint Themes 0512
Cylinderical Bar Graph Business PowerPoint Templates And PowerPoint Themes 0512-Microsoft Powerpoint Templates and Background with bar graph-These high quality PowerPoint templates and PowerPoint images are carefully selected by our team of professionals to convey your ideas in a visually appealing manner. Each download contains a text and print slide. The text and print slides show up automatically when you insert a new slide in the downloaded template
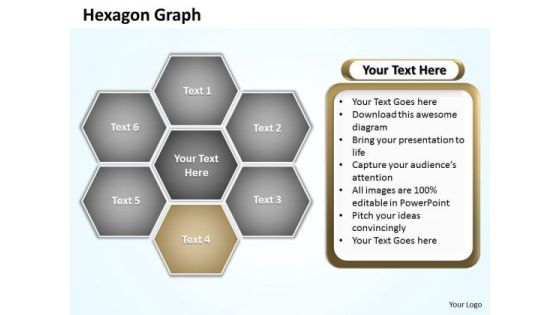
Ppt Hexagon Shapes Graph Editable PowerPoint Templates 2010
PPT hexagon shapes graph editable powerpoint templates 2010-Use this diagram to show the relationship to a central idea. Emphasizes both information in the center hexagon and how information in the outer hexagons contributes to the central idea. Transmit your thoughts via this slide and prod your team to action-PPT hexagon shapes graph editable powerpoint templates 2010-Abstract, Background, Design, Digital, Elements, Graphic, Grey, Hexagon, Illustration, Light, Modern, Perspective, Triangles, Shapes, Shiny, Style, Technology, Template, Vector, Vertical, Virtual, Wallpaper, Web

Ppt Linear Abstraction Arrow Animated Graph PowerPoint 2007 Templates
PPT linear abstraction arrow animated graph powerpoint 2007 Templates-Use this diagram to show a progression or sequential steps in a task, process, or workflow. They help to lay the base of your trend of thought and enhance the essence of your viable ideas. Create captivating presentations to deliver comparative and weighted arguments.-PPT linear abstraction arrow animated graph powerpoint 2007 Templates-analysis, arrow, background, business, chart, communication, concept, construction, delivery, design, development, engineering, fabrication, feasibiliti, generated, growth, idea, industry, making, production, products, science, sequence, shape

 Home
Home