AI PPT Maker
Templates
PPT Bundles
Design Services
Business PPTs
Business Plan
Management
Strategy
Introduction PPT
Roadmap
Self Introduction
Timelines
Process
Marketing
Agenda
Technology
Medical
Startup Business Plan
Cyber Security
Dashboards
SWOT
Proposals
Education
Pitch Deck
Digital Marketing
KPIs
Project Management
Product Management
Artificial Intelligence
Target Market
Communication
Supply Chain
Google Slides
Research Services
 One Pagers
All Categories
-
Home
- Customer Favorites
- Economic Growth
Economic Growth
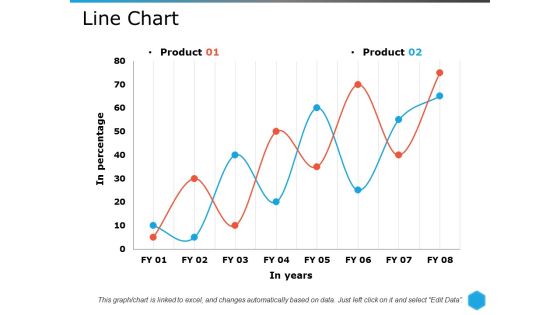
Line Chart Ppt PowerPoint Presentation Pictures Themes
This is a line chart ppt powerpoint presentation pictures themes. This is a two stage process. The stages in this process are line chart, growth, strategy, marketing, strategy, business.
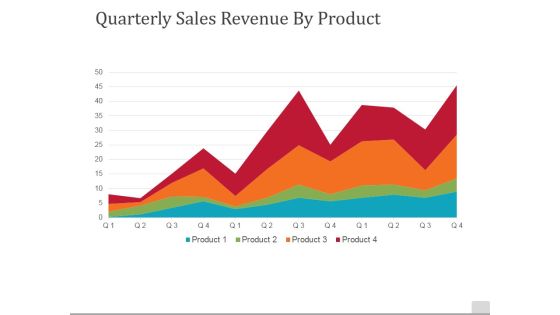
Quarterly Sales Revenue By Product Ppt PowerPoint Presentation File Background
This is a quarterly sales revenue by product ppt powerpoint presentation file background. This is a four stage process. The stages in this process are quarterly, sales revenue by product, business, marketing, success.

Key Financials Ppt PowerPoint Presentation Inspiration
This is a key financials ppt powerpoint presentation inspiration. This is a four stage process. The stages in this process are after effect, 3ds max, photoshop, illustrator.

Column Chart Financial Ppt PowerPoint Presentation Outline Design Templates
This is a column chart financial ppt powerpoint presentation outline design templates. This is a two stage process. The stages in this process are financial, business, marketing, planning, strategy.

Bar Graph With Arrow For Career Planning Ppt PowerPoint Presentation Gallery
This is a bar graph with arrow for career planning ppt powerpoint presentation gallery. This is a six stage process. The stages in this process are business, finance, marketing, strategy, planning, success, arrow.

Production Costs Template 2 Ppt PowerPoint Presentation Influencers
This is a production costs template 2 ppt powerpoint presentation influencers. This is a two stage process. The stages in this process are production, costs, business, marketing, strategy.
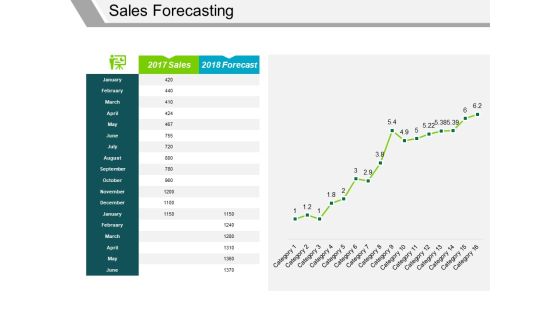
Sales Forecasting Template 1 Ppt PowerPoint Presentation Visual Aids Example 2015
This is a sales forecasting template 1 ppt powerpoint presentation visual aids example 2015. This is a one stage process. The stages in this process are forecast, sales, business, finance, marketing, strategy.

Bar Chart Ppt PowerPoint Presentation Infographic Template Skills
This is a bar chart ppt powerpoint presentation infographic template skills. This is a nine stage process. The stages in this process are sales in percentage, finance, business, marketing, strategy, success.
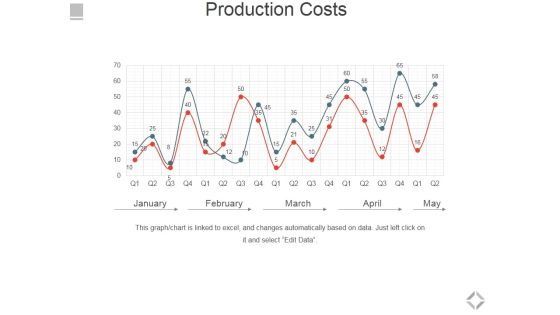
Production Costs Template 2 Ppt PowerPoint Presentation Gallery Picture
This is a production costs template 2 ppt powerpoint presentation gallery picture. This is a two stage process. The stages in this process are january, february, march, april, may.

Hiring Plan Ppt PowerPoint Presentation Pictures Graphic Images
This is a hiring plan ppt powerpoint presentation pictures graphic images. This is a five stage process. The stages in this process are engineering, sales, marketing, product, support, finance.

Competitor Analysis Competitor Revenue And Profit Graph Ppt PowerPoint Presentation Inspiration
This is a competitor analysis competitor revenue and profit graph ppt powerpoint presentation inspiration. This is a five stage process. The stages in this process are business, marketing, management, profit, revenue.

Stacked Column Ppt PowerPoint Presentation Ideas Pictures
This is stacked column ppt powerpoint presentation ideas pictures. This is a two stage process. The stages in this process are product, in million, strategy management, business, finance.
Stacked Line Ppt PowerPoint Presentation Background Image
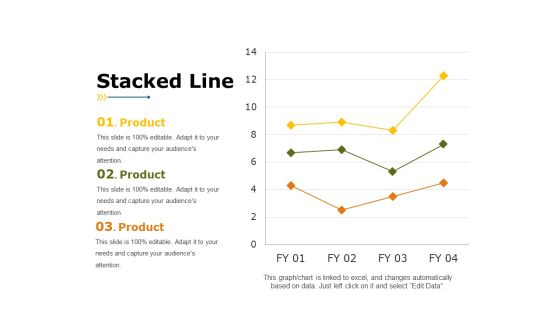
This is a stacked line ppt powerpoint presentation background image. This is a three stage process. The stages in this process are product, stacked line, business, marketing, finance.

Column Chart Ppt PowerPoint Presentation File Graphics
This is a column chart ppt powerpoint presentation file graphics. This is a two stage process. The stages in this process are column chart, finance, analysis, marketing, business.
Profitability Ratios Template 1 Ppt PowerPoint Presentation Icon Example File
This is a profitability ratios template 1 ppt powerpoint presentation icon example file. This is a two stage process. The stages in this process are gross profit ratio, net profit ratio.
Financial Projection Graph Template 1 Ppt PowerPoint Presentation Icon Summary
This is a financial projection graph template 1 ppt powerpoint presentation icon summary. This is a three stage process. The stages in this process are annual sales forecast, years, business, marketing, management.

Area Chart Financial Ppt PowerPoint Presentation Outline Professional
This is a area chart financial ppt powerpoint presentation outline professional. This is a four stage process. The stages in this process are product, sales in percentage, financial year.

Crowdfunding Statistics Template 1 Ppt PowerPoint Presentation Outline Shapes
This is a crowdfunding statistics template 1 ppt powerpoint presentation outline shapes. This is a seven stage process. The stages in this process are business, strategy, analysis, marketing, crowding portals worldwide.

Competitor Analysis Competitor Revenue And Profit Graph Ppt PowerPoint Presentation Gallery Vector
This is a competitor analysis competitor revenue and profit graph ppt powerpoint presentation gallery vector. This is a five stage process. The stages in this process are bar graph, marketing, management, business, presentation.

Change Curve Ppt PowerPoint Presentation Background Designs
This is a change curve ppt powerpoint presentation background designs. This is a five stage process. The stages in this process are satisfaction, denial, exploration, hope, commitment.

Profitability Ratios Template 2 Ppt PowerPoint Presentation Infographics Layouts
This is a profitability ratios template 2 ppt powerpoint presentation infographics layouts. This is a two stage process. The stages in this process are price to earning ratio, earning per share, market value price per share.
Profitability Ratios Template 3 Ppt PowerPoint Presentation Styles Slide Download
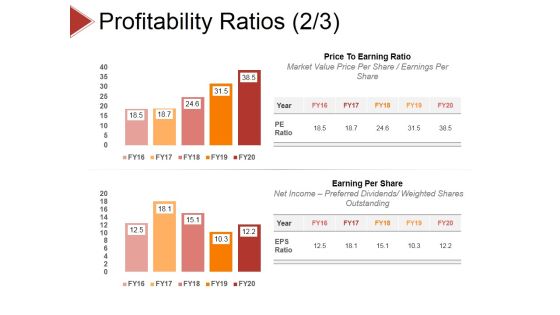
This is a profitability ratios template 3 ppt powerpoint presentation styles slide download. This is a two stage process. The stages in this process are roce, roa, net operating profit, net income.
Solvency Ratios Ppt PowerPoint Presentation Model Show
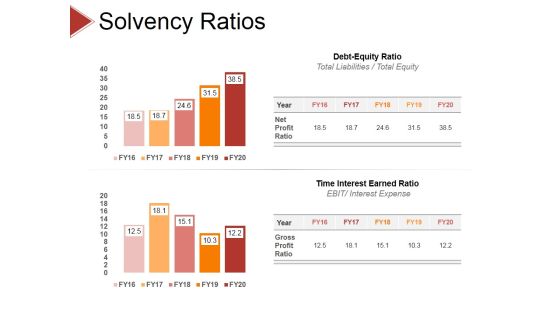
This is a solvency ratios ppt powerpoint presentation model show. This is a two stage process. The stages in this process are debt equity ratio, time interest earned ratio.
Real Estate Sales Comparison Ppt PowerPoint Presentation Good
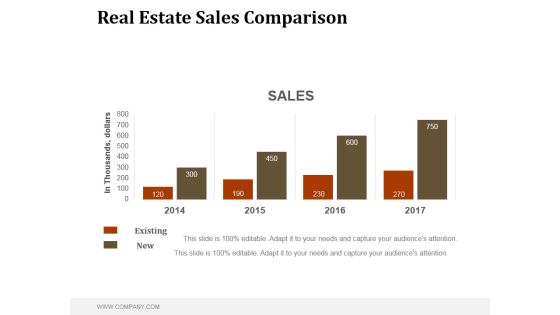
This is a real estate sales comparison ppt powerpoint presentation good. This is a four stage process. The stages in this process are business, marketing, management, sales, comparison.

Financial What Are We Expecting Ppt PowerPoint Presentation Inspiration Infographics
This is a financial what are we expecting ppt powerpoint presentation inspiration infographics. This is a four stage process. The stages in this process are business, marketing, timeline, planning, strategy.

Portfolio Management Process Ppt PowerPoint Presentation Layout
This is a portfolio management process ppt powerpoint presentation layout. This is a five stage process. The stages in this process are define, analyze, control, measure, improve.

Break Even Analysis Ppt PowerPoint Presentation Styles Samples
This is a break even analysis ppt powerpoint presentation styles samples. This is a two stage process. The stages in this process are break even point, break even volume, profit, total revenue, total costs, variable cost.

Risk Return Plot Ppt PowerPoint Presentation Background Images
This is a risk return plot ppt powerpoint presentation background images. This is a nine stage process. The stages in this process are annualized return, annualized standard deviation.

Bar Graph Ppt PowerPoint Presentation Outline File Formats
This is a bar graph ppt powerpoint presentation outline file formats. This is a nine stage process. The stages in this process are bar graph, business, management, success, strategy.

Competitor Analysis 2 X 2 Matrix Ppt PowerPoint Presentation Deck
This is a competitor analysis 2 x 2 matrix ppt powerpoint presentation deck. This is a four stage process. The stages in this process are business, marketing, management, matrix, analysis.

Crowdfunding Statistics Template 2 Ppt PowerPoint Presentation Styles Graphics Design
This is a crowdfunding statistics template 2 ppt powerpoint presentation styles graphics design. This is a seven stage process. The stages in this process are raised worldwide, crowding portals worldwide, no of portals.

Customer Service Bench Marketing Ppt PowerPoint Presentation Professional Summary
This is a customer service bench marketing ppt powerpoint presentation professional summary. This is a five stage process. The stages in this process are very poor, poor, good, excellent.

Bar Graph Ppt PowerPoint Presentation Styles Picture
This is a bar graph ppt powerpoint presentation styles picture. This is a four stage process. The stages in this process are business, strategy, marketing, analysis, chart and graph, bar graph.
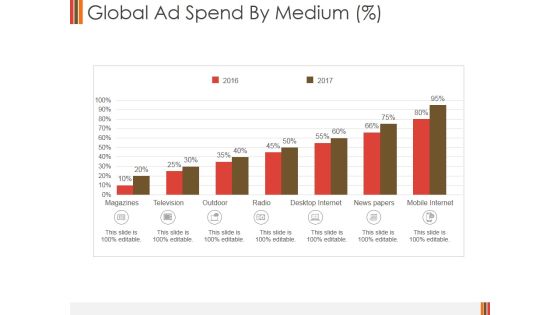
Global Ad Spend By Medium Ppt PowerPoint Presentation Ideas Design Templates
This is a global ad spend by medium ppt powerpoint presentation ideas design templates. This is a seven stage process. The stages in this process are magazines, television, outdoor, radio, desktop internet, news papers, mobile internet.

Web Traffic Insights Ppt PowerPoint Presentation Summary Vector
This is a web traffic insights ppt powerpoint presentation summary vector. This is a five stage process. The stages in this process are website ranks in june, traffic sources, engagement in june, subdomains.

Area Chart Ppt PowerPoint Presentation Styles Designs
This is a area chart ppt powerpoint presentation styles designs. This is a two stage process. The stages in this process are area chart, product.
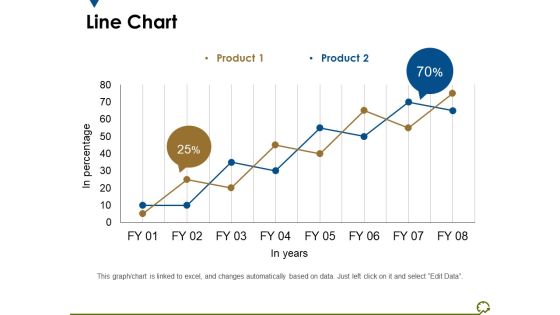
Line Chart Ppt PowerPoint Presentation Outline Diagrams
This is a line chart ppt powerpoint presentation outline diagrams. This is a two stage process. The stages in this process are in percentage, in years, percentage, business, marketing.

Line Chart Ppt PowerPoint Presentation Summary Graphic Tips
This is a line chart ppt powerpoint presentation summary graphic tips. This is a two stage process. The stages in this process are line chart, product, in percentage, analysis, business.

Channel Strategy Ppt PowerPoint Presentation Infographic Template Icon
This is a channel strategy ppt powerpoint presentation infographic template icon. This is a five stage process. The stages in this process are e commerce, direct personal selling, retail on offline, indirect, component or private label.

Clustered Column Line Ppt PowerPoint Presentation Infographic Template Deck
This is a clustered column line ppt powerpoint presentation infographic template deck. This is a three stage process. The stages in this process are business, strategy, analysis, planning, sales in percentage, financial year.
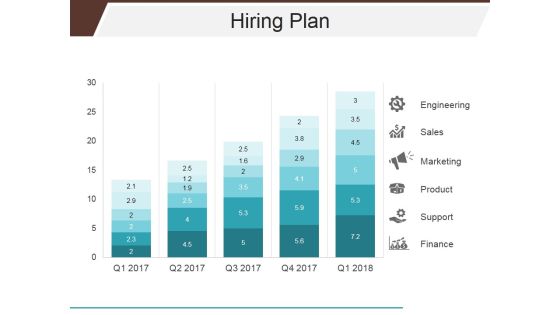
Hiring Plan Ppt PowerPoint Presentation Slide
This is a hiring plan ppt powerpoint presentation slide. This is a five stage process. The stages in this process are engineering, sales, marketing, product, support, finance.
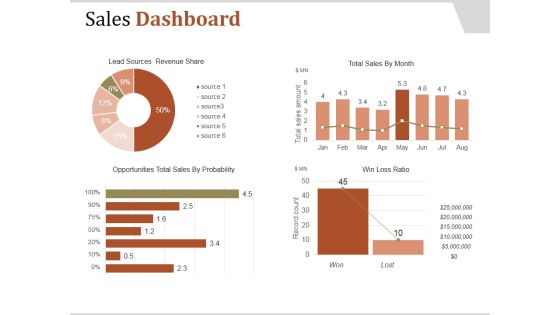
Sales Dashboard Template 2 Ppt PowerPoint Presentation Clipart
This is a sales dashboard template 2 ppt powerpoint presentation clipart. This is a four stage process. The stages in this process are lead sources revenue share, total sales by month, win loss ratio, opportunities total sales by probability.

Area Chart Ppt PowerPoint Presentation Samples
This is a area chart ppt powerpoint presentation samples. This is a two stage process. The stages in this process are financial year, sales in percentage, jan, feb.
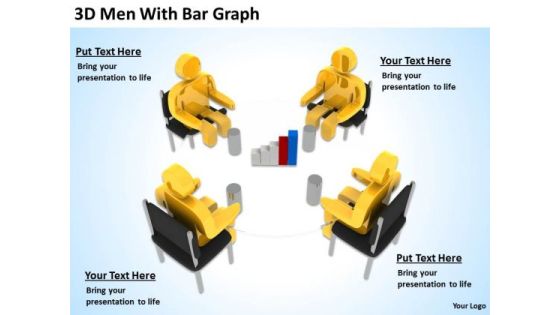
Business People Vector 3d Men With Bar Graph PowerPoint Slides
We present our business people vector 3d men with bar graph PowerPoint Slides.Use our People PowerPoint Templates because Our PowerPoint Templates and Slides are a sure bet. Gauranteed to win against all odds. Download and present our Business PowerPoint Templates because Our PowerPoint Templates and Slides will bullet point your ideas. See them fall into place one by one. Download and present our Flow Charts PowerPoint Templates because Our PowerPoint Templates and Slides are created by a hardworking bunch of busybees. Always flitting around with solutions gauranteed to please. Download our Marketing PowerPoint Templates because It can Bubble and burst with your ideas. Use our Shapes PowerPoint Templates because Our PowerPoint Templates and Slides will let you Leave a lasting impression to your audiences. They possess an inherent longstanding recall factor.Use these PowerPoint slides for presentations relating to 3d, accounting, analysis, bar, business, cartoon,cash, character, chart, clipart, committee, company, concept, corporate,council, directors, display, document, economics, executive, figure, finance,financial, goal, graph, group, growth, guy, human, humanoid, man, management,market, meeting, money, office, percentage, performance, pie, presentation, report,room, statistics, table, team. The prominent colors used in the PowerPoint template are Yellow, Black, Gray. Professionals tell us our business people vector 3d men with bar graph PowerPoint Slides have awesome images to get your point across. Professionals tell us our analysis PowerPoint templates and PPT Slides will help you be quick off the draw. Just enter your specific text and see your points hit home. People tell us our business people vector 3d men with bar graph PowerPoint Slides effectively help you save your valuable time. Customers tell us our bar PowerPoint templates and PPT Slides are effectively colour coded to prioritise your plans They automatically highlight the sequence of events you desire. The feedback we get is that our business people vector 3d men with bar graph PowerPoint Slides will generate and maintain the level of interest you desire. They will create the impression you want to imprint on your audience. Use our business PowerPoint templates and PPT Slides have awesome images to get your point across.
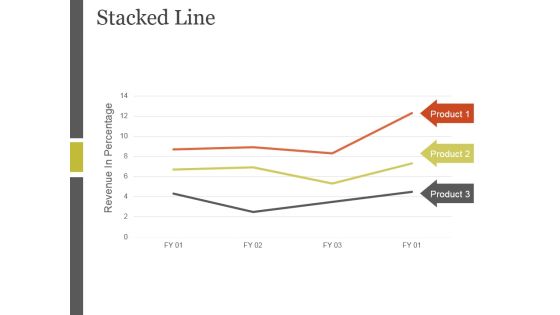
Stacked Line Ppt PowerPoint Presentation Inspiration
This is a stacked line ppt powerpoint presentation inspiration. This is a three stage process. The stages in this process are revenue in percentage, stacked line, product.
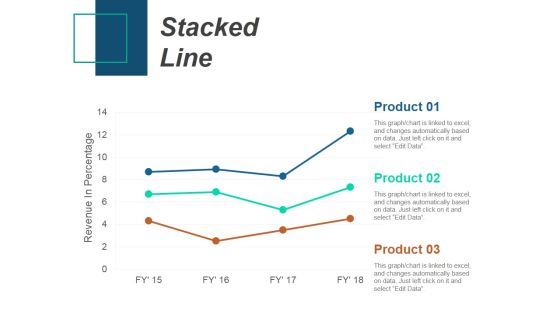
Stacked Line Ppt PowerPoint Presentation Infographics Slideshow
This is a stacked line ppt powerpoint presentation infographics slideshow. This is a three stage process. The stages in this process are stacked line, revenue in percentage, product.

Bar Graph Ppt PowerPoint Presentation Professional Show
This is a bar graph ppt powerpoint presentation professional show. This is a four stage process. The stages in this process are business, strategy, marketing, planning, finance.
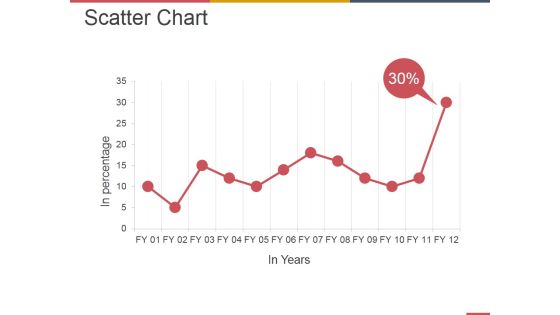
Scatter Chart Ppt PowerPoint Presentation File Example
This is a scatter chart ppt powerpoint presentation file example. This is a twelve stage process. The stages in this process are business, strategy, marketing, analysis, finance.

Column Chart Ppt PowerPoint Presentation Gallery Design Inspiration
This is a column chart ppt powerpoint presentation gallery design inspiration. This is a two stage process. The stages in this process are column chart, product, sales in percentage, financial years.
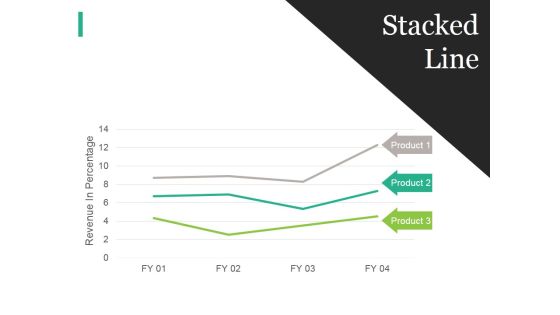
Stacked Line Ppt PowerPoint Presentation File Display
This is a stacked line ppt powerpoint presentation file display. This is a three stage process. The stages in this process are business, strategy, marketing, analysis, revenue in percentage, stacked line.
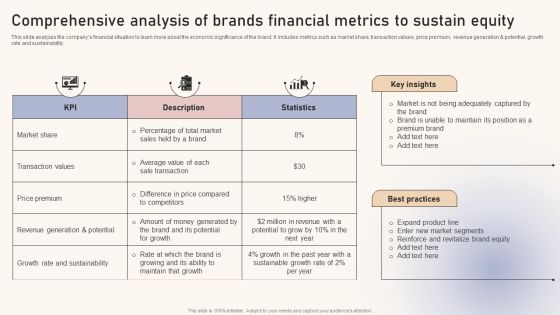
Optimizing Brand Equity Through Strategic Management Comprehensive Analysis Of Brands Financial Metrics Sustain Mockup PDF
This slide analyzes the companys financial situation to learn more about the economic significance of the brand. It includes metrics such as market share, transaction values, price premium, revenue generation and potential, growth rate and sustainability. There are so many reasons you need a Optimizing Brand Equity Through Strategic Management Comprehensive Analysis Of Brands Financial Metrics Sustain Mockup PDF. The first reason is you can not spend time making everything from scratch, Thus, Slidegeeks has made presentation templates for you too. You can easily download these templates from our website easily.

Bar Graph Ppt PowerPoint Presentation Gallery Example Topics
This is a bar graph ppt powerpoint presentation gallery example topics. This is a four stage process. The stages in this process are business, strategy, marketing, analysis, finance, bar graph.

Stacked Line Ppt PowerPoint Presentation Summary Master Slide
This is a stacked line ppt powerpoint presentation summary master slide. This is a three stage process. The stages in this process are revenue in percentage, stacked line, product.

Bar Graph Ppt PowerPoint Presentation Visual Aids Model
This is a bar graph ppt powerpoint presentation visual aids model. This is a three stage process. The stages in this process are business, strategy, analysis, planning, sales in percentage.

Bar Graph Ppt PowerPoint Presentation Model Graphic Tips
This is a bar graph ppt powerpoint presentation model graphic tips. This is a two stage process. The stages in this process are we are dollars in millions, financials years, bar graph, product, business.
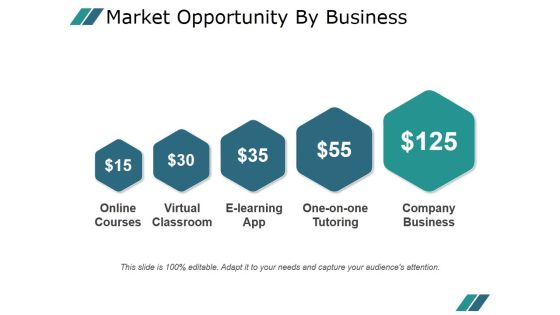
Market Opportunity By Business Ppt PowerPoint Presentation Gallery
This is a market opportunity by business ppt powerpoint presentation gallery. This is a five stage process. The stages in this process are online courses, virtual classroom, e learning app, one on one tutoring, company.

Crm Dashboard Opportunity By Rating Ppt PowerPoint Presentation Model
This is a crm dashboard opportunity by rating ppt powerpoint presentation model. This is a three stage process. The stages in this process are open opportunity, cold, hot, warm.

Balance Sheet Kpis Tabular Form Ppt PowerPoint Presentation Infographics Good
This is a balance sheet kpis tabular form ppt powerpoint presentation infographics good. This is a four stage process. The stages in this process are current assets, current liabilities, total assets, total liabilities.

Changes In Competitive Environment Template 1 Ppt PowerPoint Presentation Icon Show
This is a changes in competitive environment template 1 ppt powerpoint presentation icon show. This is a four stage process. The stages in this process are engagement, competitive, business, marketing, management.
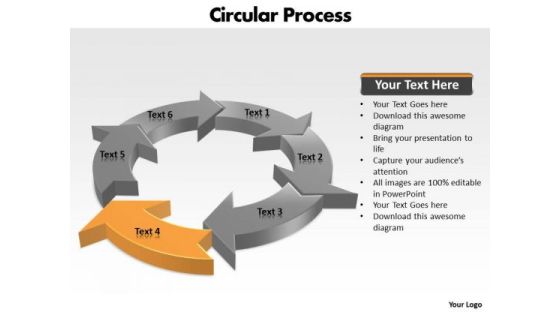
Ppt Components Of Circular PowerPoint Menu Template Process Chart Templates
PPT components of circular powerpoint menu template process chart Templates-This circular flow diagram can helps to illustrate the economic exchange that takes place in the building of wealth. Clarity of thought has been the key to your growth. Use our template to illustrate your ability.-PPT components of circular powerpoint menu template process chart Templates-Arrow, Chart, Circular, Color, Colorful, Connect, Connection, Design, Diagram, Finance, Graphic, Group, Growth, Icon, Illustration, Marketing, Pieces, Process, Recycle, Recycling, Round, Set, Strategy, Symbol, Wheel
