AI PPT Maker
Templates
PPT Bundles
Design Services
Business PPTs
Business Plan
Management
Strategy
Introduction PPT
Roadmap
Self Introduction
Timelines
Process
Marketing
Agenda
Technology
Medical
Startup Business Plan
Cyber Security
Dashboards
SWOT
Proposals
Education
Pitch Deck
Digital Marketing
KPIs
Project Management
Product Management
Artificial Intelligence
Target Market
Communication
Supply Chain
Google Slides
Research Services
 One Pagers
All Categories
-
Home
- Customer Favorites
- Economic Growth
Economic Growth

Stacked Line Ppt PowerPoint Presentation File Show
This is a stacked line ppt powerpoint presentation file show. This is a three stage process. The stages in this process are revenue in percentage, product.

Bar Graph Ppt Powerpoint Presentation Slides Example
This is a bar graph ppt powerpoint presentation slides example. This is a five stage process. The stages in this process are graph, business, marketing, finance.
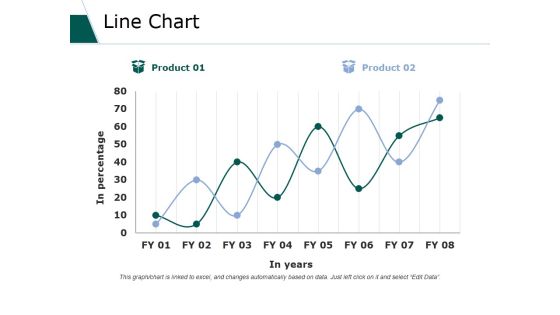
Line Chart Ppt PowerPoint Presentation Gallery Information
This is a line chart ppt powerpoint presentation gallery information. This is a two stage process. The stages in this process are business, marketing, strategy, planning, finance.

Area Chart Ppt PowerPoint Presentation Summary Sample
This is a area chart ppt powerpoint presentation summary sample. This is a two stage process. The stages in this process are business, marketing, finance, strategy, planning.
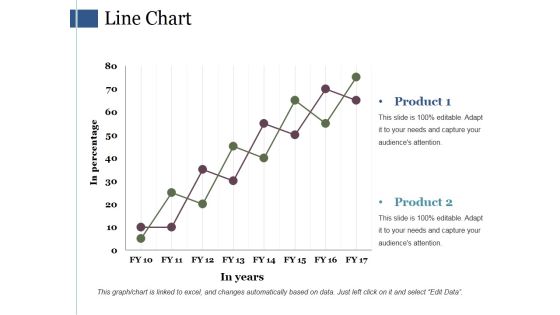
Line Chart Ppt PowerPoint Presentation Guide
This is a line chart ppt powerpoint presentation guide. This is a two stage process. The stages in this process are business, marketing, finance, strategy, planning.

Clustered Column Line Ppt PowerPoint Presentation Model Aids
This is a clustered column line ppt powerpoint presentation model aids. This is a four stage process. The stages in this process are business, marketing, strategy, finance, planning.

Combo Chart Ppt PowerPoint Presentation Ideas Graphic Images
This is a combo chart ppt powerpoint presentation ideas graphic images. This is a eight stage process. The stages in this process are bar, finance, business, marketing, success.
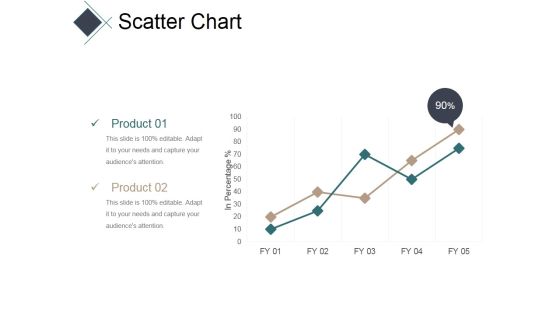
Scatter Chart Ppt PowerPoint Presentation Pictures Slide Portrait
This is a scatter chart ppt powerpoint presentation pictures slide portrait. This is a two stage process. The stages in this process are business, line, graph, success, finance.

Stacked Column Ppt PowerPoint Presentation Infographic Template Graphics
This is a stacked column ppt powerpoint presentation infographic template graphics. This is a nine stage process. The stages in this process are business, marketing, finance, analysis, planning.

Line Chart Ppt PowerPoint Presentation Model Design Templates
This is a line chart ppt powerpoint presentation model design templates. This is a two stage process. The stages in this process are sales in percentage, financial years, product.
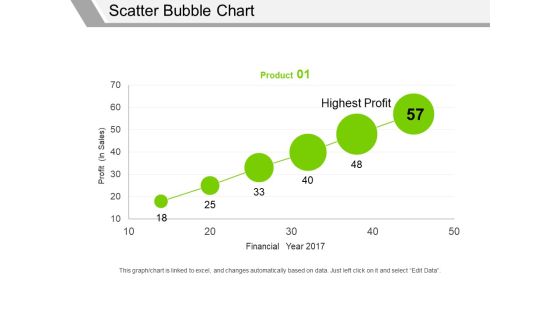
Scatter Bubble Chart Ppt PowerPoint Presentation Professional Graphics Pictures
This is a scatter bubble chart ppt powerpoint presentation professional graphics pictures. This is a one stage process. The stages in this process are profit in sales, financial year, highest profit, product.
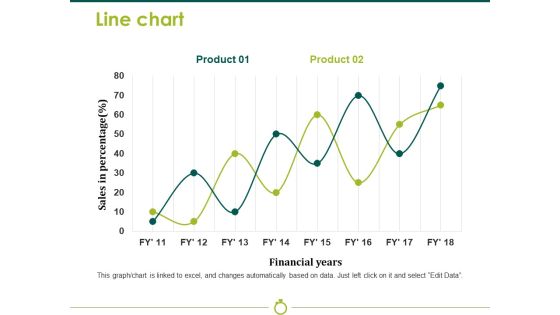
Line Chart Template 2 Ppt PowerPoint Presentation Model Background Image
This is a line chart template 2 ppt powerpoint presentation model background image. This is a two stage process. The stages in this process are sales in percentage, financial years, business, marketing, strategy, graph.

Column Chart Ppt PowerPoint Presentation Outline Styles
This is a column chart ppt powerpoint presentation outline styles. This is a two stage process. The stages in this process are sales in percentage, financial year in, business, marketing, graph.
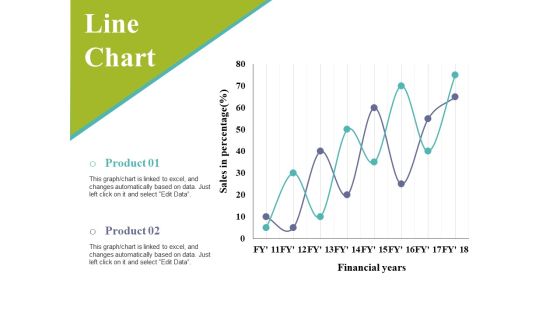
Line Chart Ppt PowerPoint Presentation Infographic Template Slides
This is a line chart ppt powerpoint presentation infographic template slides. This is a two stage process. The stages in this process are sales in percentage, financial years, business, marketing, graph.

Line Chart Ppt PowerPoint Presentation Styles Themes
This is a line chart ppt powerpoint presentation styles themes. This is a two stage process. The stages in this process are business, marketing, financial years, sales in percentage.
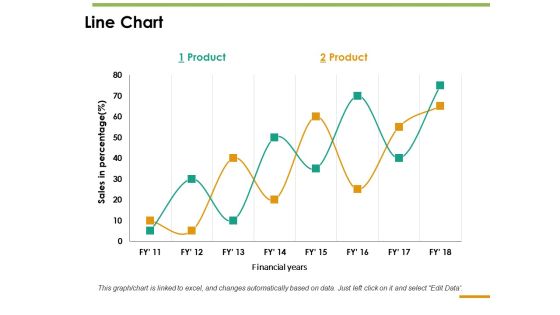
Line Chart Ppt PowerPoint Presentation Inspiration Guide
This is a line chart ppt powerpoint presentation inspiration guide. This is a two stage process. The stages in this process are line chart, sales in percentage, product, financial years.

Column Chart Ppt PowerPoint Presentation Ideas Format
This is a column chart ppt powerpoint presentation ideas format. This is a two stage process. The stages in this process are business, strategy, marketing, planning, finance.
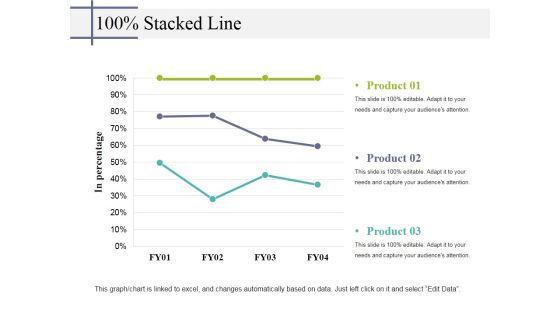
Stacked Line Ppt PowerPoint Presentation Styles Picture
This is a stacked line ppt powerpoint presentation styles picture. This is a three stage process. The stages in this process are stacked line, finance, analysis, business, strategy.

Combo Chart Ppt PowerPoint Presentation Summary Elements
This is a combo chart ppt powerpoint presentation summary elements. This is a three stage process. The stages in this process are business, marketing, strategy, planning, finance.

Google Trends Ppt PowerPoint Presentation Ideas Introduction
This is a google trends ppt powerpoint presentation ideas introduction. This is a three stage process. The stages in this process are facebook, myspace, twitter, finance.
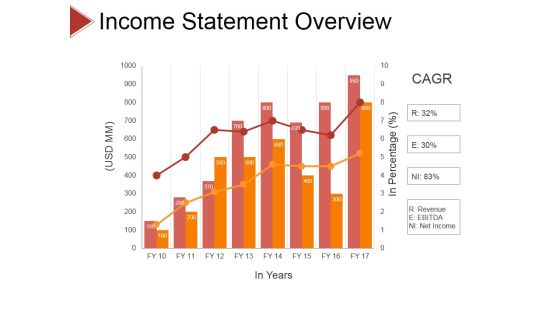
Income Statement Overview Ppt PowerPoint Presentation Slides Samples
This is a income statement overview ppt powerpoint presentation slides samples. This is a eight stage process. The stages in this process are business, strategy, analysis, pretention, revenue, ebitda, net income.
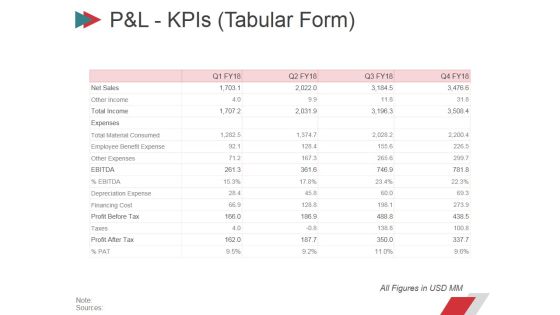
Pandl Kpis Tabular Form Ppt PowerPoint Presentation Summary Layout
This is a pandl kpis tabular form ppt powerpoint presentation summary layout. This is a four stage process. The stages in this process are revenue, cogs, operating profit, net profit.

Pandl Kpis Tabular Form Ppt PowerPoint Presentation File Design Templates
This is a pandl kpis tabular form ppt powerpoint presentation file design templates. This is a four stage process. The stages in this process are revenue, cogs, operating profit, net profit.
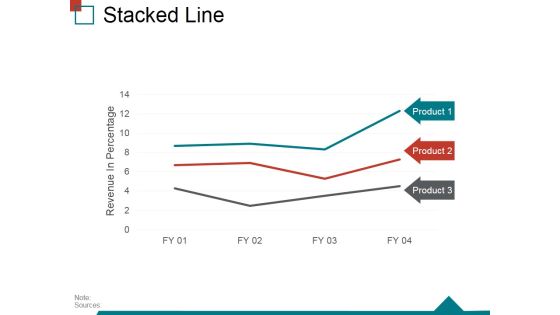
Stacked Line Ppt PowerPoint Presentation Ideas Summary
This is a stacked line ppt powerpoint presentation ideas summary. This is a three stage process. The stages in this process are revenue in percentage, stacked line, business, marketing, success.

Area Chart Ppt PowerPoint Presentation Summary Example
This is a area chart ppt powerpoint presentation summary example. This is a two stage process. The stages in this process are financial year, in percentage, product.

Combo Chart Ppt PowerPoint Presentation File Visual Aids
This is a combo chart ppt powerpoint presentation file visual aids. This is a two stage process. The stages in this process are bar graph, business, marketing, finance, planning.
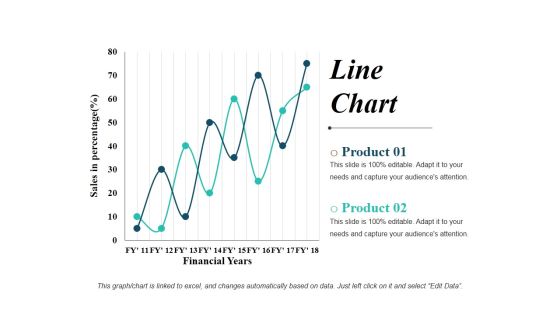
Line Chart Ppt PowerPoint Presentation Show Graphics Design
This is a line chart ppt powerpoint presentation show graphics design. This is a two stage process. The stages in this process are line graph, business, marketing, finance, planning.
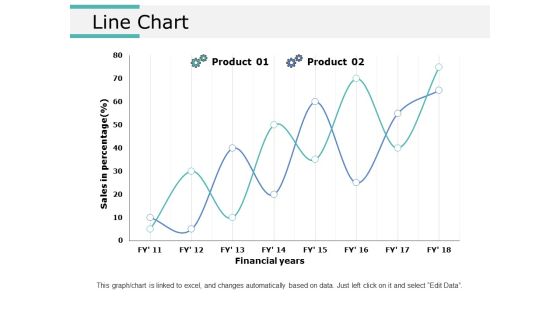
Line Chart Ppt PowerPoint Presentation Ideas Graphics Tutorials
This is a line chart ppt powerpoint presentation ideas graphics tutorials. This is a two stage process. The stages in this process are line chart, marketing, strategy, planning, finance.
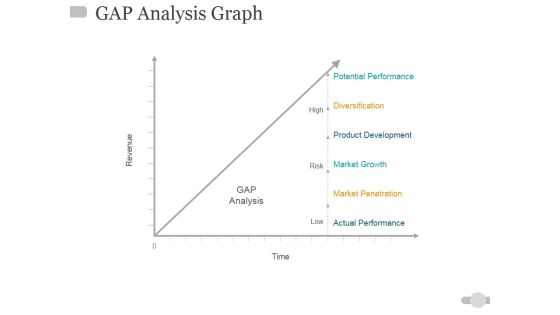
Gap Analysis Graph Ppt PowerPoint Presentation Inspiration Picture
This is a gap analysis graph ppt powerpoint presentation inspiration picture. This is a one stage process. The stages in this process are high, risk, low, time, gap analysis, revenue.

Stacked Line Ppt PowerPoint Presentation Summary File Formats
This is a stacked line ppt powerpoint presentation summary file formats. This is a three stage process. The stages in this process are product, revenue in percentage, strategy, business, marketing.

Stacked Line With Marker Ppt PowerPoint Presentation Infographics Images
This is a stacked line with marker ppt powerpoint presentation infographics images. This is a twelve stage process. The stages in this process are business, marketing, strategy, finance, success.

Scatter Chart Ppt PowerPoint Presentation Portfolio File Formats
This is a scatter chart ppt powerpoint presentation portfolio file formats. This is a one stage process. The stages in this process are scatter chart, finance, success, management, business.

Visitors To Lead Performance Ppt PowerPoint Presentation Outline Background Image
This is a visitors to lead performance ppt powerpoint presentation outline background image. This is a eleven stage process. The stages in this process are cumulative frequency, finance, management, marketing, success.

Bar Chart Ppt PowerPoint Presentation File Model
This is a bar chart ppt powerpoint presentation file model. This is a two stage process. The stages in this process are business, strategy, marketing, analysis, finance, bar graph.

Area Chart Ppt PowerPoint Presentation Visual Aids Example 2015
This is a area chart ppt powerpoint presentation visual aids example 2015. This is a two stage process. The stages in this process are area chart, finance, marketing, strategy, business.
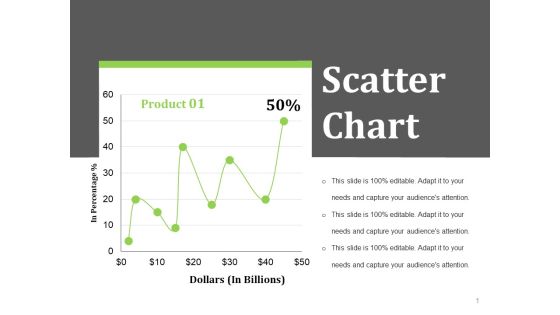
Scatter Chart Ppt PowerPoint Presentation Styles Layout Ideas
This is a scatter chart ppt powerpoint presentation styles layout ideas. This is a one stage process. The stages in this process are dollars in billions, in percentage, business, finance.

Competitive Analysis Ppt PowerPoint Presentation Pictures Example Topics
This is a competitive analysis ppt powerpoint presentation pictures example topics. This is a one stage process. The stages in this process are competitive analysis, finance, marketing, strategy, business.
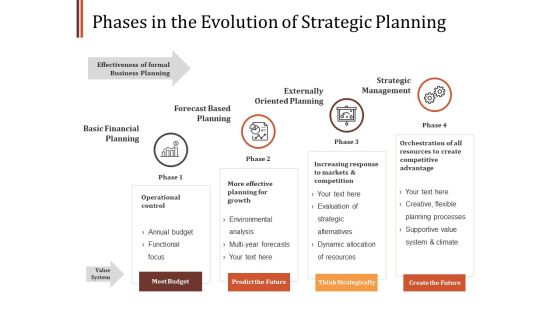
Phases In The Evolution Of Strategic Planning Ppt PowerPoint Presentation Show Graphics Design
This is a phases in the evolution of strategic planning ppt powerpoint presentation show graphics design. This is a four stage process. The stages in this process are basic financial planning, forecast based planning, externally oriented planning, strategic management, strategic planning.

Clustered Column Ppt PowerPoint Presentation File Designs Download
This is a clustered column ppt powerpoint presentation file designs download. This is a six stage process. The stages in this process are dollars in thousands, financial year, product.
Scatter Bubble Chart Ppt PowerPoint Presentation Gallery Designs Download
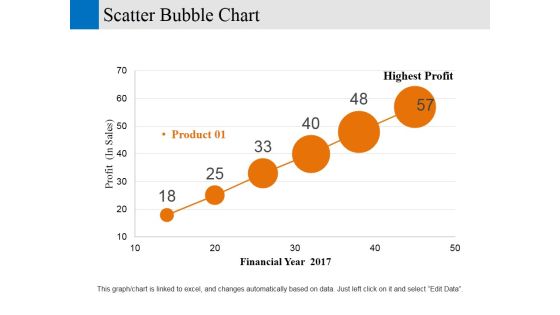
This is a scatter bubble chart ppt powerpoint presentation gallery designs download. This is a six stage process. The stages in this process are financial year, profit, business, marketing, strategy.

Three Ways To Increase Profits In Business Ppt PowerPoint Presentation Gallery Model
Presenting this set of slides with name three ways to increase profits in business ppt powerpoint presentation gallery model. This is a three stage process. The stages in this process are revenue generation, business, strategies. This is a completely editable PowerPoint presentation and is available for immediate download. Download now and impress your audience.

Market Opportunity By Business Ppt PowerPoint Presentation Portfolio
This is a market opportunity by business ppt powerpoint presentation portfolio. This is a five stage process. The stages in this process are online courses, virtual classroom, e learning app, one on one tutoring, company business.

Change Curve Ppt PowerPoint Presentation Backgrounds
This is a change curve ppt powerpoint presentation backgrounds. This is a five stage process. The stages in this process are commitment, satisfaction, denial , exploration, commitment, hope, looking to the past, looking to the, future.

Real Estate Rents Ppt PowerPoint Presentation Tips
This is a real estate rents ppt powerpoint presentation tips. This is a one stage process. The stages in this process are business, marketing, management, timeline, planning.

Kaizen Vs Innovation Ppt PowerPoint Presentation Topics
This is a kaizen vs innovation ppt powerpoint presentation topics. This is a four stage process. The stages in this process are kaizen, innovation, innovation, time.

Bar Chart Ppt PowerPoint Presentation Layouts Visuals
This is a bar chart ppt powerpoint presentation layouts visuals. This is a two stage process. The stages in this process are business, strategy, marketing, planning, chart and graph.

Global Ad Spend By Medium Ppt Powerpoint Presentation Picture
This is a global ad spend by medium ppt powerpoint presentation picture. This is a seven stage process. The stages in this process are desktop internet, mobile internet, newspapers, magazines.

Line Chart Ppt PowerPoint Presentation Model Elements
This is a line chart ppt powerpoint presentation model elements. This is a eight stage process. The stages in this process are business, strategy, analysis, planning, line chart.

Combo Chart Ppt PowerPoint Presentation Infographic Template Brochure
This is a combo chart ppt powerpoint presentation infographic template brochure. This is a eight stage process. The stages in this process are product, market size, strategy, business, marketing.
Scm Goals Ppt PowerPoint Presentation Infographic Template Slide Portrait
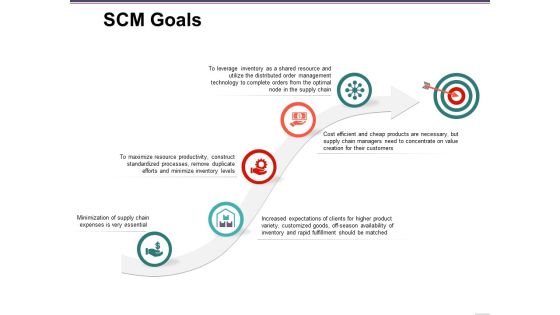
This is a scm goals ppt powerpoint presentation infographic template slide portrait. This is a five stage process. The stages in this process are icons, business, marketing, target, strategy.

Line Chart Ppt PowerPoint Presentation Portfolio Design Templates
This is a line chart ppt powerpoint presentation portfolio design templates. This is a two stage process. The stages in this process are in percentage, in years, percentage, business, graph.
Rogers Technology Adoption Curve Ppt PowerPoint Presentation Slides Information
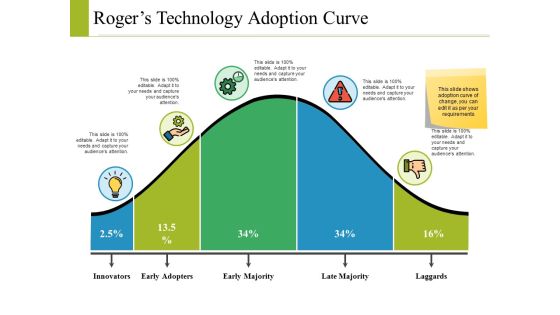
This is a rogers technology adoption curve ppt powerpoint presentation slides information. This is a five stage process. The stages in this process are innovators, early adopters, early majority, late majority, laggards.

Column Chart Ppt PowerPoint Presentation Professional Shapes
This is a column chart ppt powerpoint presentation professional shapes. This is a two stage process. The stages in this process are business, management, marketing.

Combo Chart Ppt PowerPoint Presentation File Example
This is a combo chart ppt powerpoint presentation file example. This is a three stage process. The stages in this process are product, percentage, marketing, business, management.

Most Effective Media Channels Ppt PowerPoint Presentation Model Graphic Images
This is a most effective media channels ppt powerpoint presentation model graphic images. This is a nine stage process. The stages in this process are business, management, marketing, percentage, product.
Key Metrics For Data Quality Measurement Ppt PowerPoint Presentation Styles Deck PDF
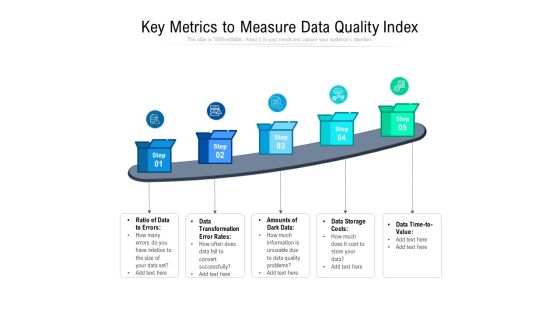
Persuade your audience using this key metrics for data quality measurement ppt powerpoint presentation styles deck pdf. This PPT design covers five stages, thus making it a great tool to use. It also caters to a variety of topics including ratio of data to errors, data transformation error rates, amounts of dark data, data storage costs, data time to value. Download this PPT design now to present a convincing pitch that not only emphasizes the topic but also showcases your presentation skills.

Business Growth02 Success PowerPoint Templates And PowerPoint Backgrounds 0611
Microsoft PowerPoint Template and Background with a depicting financial growth

Business Model Environment Evaluation With Market Demonstration PDF
This slide focuses on the business model environment analysis which includes key trends, market forces, macro-economic forces and industry forces with regulatory patterns, business stakeholders, economic infrastructure, market issues, revenue attractiveness, etc. Persuade your audience using this Business Model Environment Evaluation With Market Demonstration PDF. This PPT design covers four stages, thus making it a great tool to use. It also caters to a variety of topics including Technology Changes, Socioeconomic Trends, Market Segments. Download this PPT design now to present a convincing pitch that not only emphasizes the topic but also showcases your presentation skills.

Financial Growth01 Business PowerPoint Templates And PowerPoint Backgrounds 0711
Microsoft PowerPoint Template and Background with business finance depicting growth

Senseable Cities Development Initiatives Framework Guidelines PDF
This slide illustrate key initiatives to develop a smart city project to enhance quality of living. It includes elements such as focus areas, smart cities initiatives, economic development, energy and environment, heath care, infrastructure etc. Persuade your audience using this Senseable Cities Development Initiatives Framework Guidelines PDF. This PPT design covers Five stages, thus making it a great tool to use. It also caters to a variety of topics including Economic Development, Energy And Environment, Health Care Download this PPT design now to present a convincing pitch that not only emphasizes the topic but also showcases your presentation skills.
