Delivery Performance

Customer Satisfaction And Performance Metrics Ppt PowerPoint Presentation Complete Deck With Slides
This is a customer satisfaction and performance metrics ppt powerpoint presentation complete deck with slides. This is a one stage process. The stages in this process are customer, service, marketing, planning, strategy.

Consumer Quality Management Performance Reliability And Serviceability Ppt PowerPoint Presentation Professional Design Inspiration
This is a consumer quality management performance reliability and serviceability ppt powerpoint presentation professional design inspiration. This is a eight stage process. The stages in this process are customer support, customer management, customer quality.

Optimizing Online Stores Key Metrics To Measure Current Performance Download PDF
This slide represents the key performance indicators to track and monitor the performance of ecommerce website to draw effective strategies to tackle the problems. It includes key metrics for ecommerce website performance measurement such as average order value and shopping cart abandonment rate. The Optimizing Online Stores Key Metrics To Measure Current Performance Download PDF is a compilation of the most recent design trends as a series of slides. It is suitable for any subject or industry presentation, containing attractive visuals and photo spots for businesses to clearly express their messages. This template contains a variety of slides for the user to input data, such as structures to contrast two elements, bullet points, and slides for written information. Slidegeeks is prepared to create an impression.

Administering Logistics Activities In SCM Comparing Logistics Performance Metrics With Competitors Pictures PDF
This slide focuses on the comparison of logistics performance metrics with competitors on the basis of parameters such as shipping time, order accuracy, equipment utilization rate, etc. Deliver an awe inspiring pitch with this creative Administering Logistics Activities In SCM Comparing Logistics Performance Metrics With Competitors Pictures PDF bundle. Topics like Shipping Time, Equipment Utilization, Warehousing Costs can be discussed with this completely editable template. It is available for immediate download depending on the needs and requirements of the user.

Developing Excellence In Logistics Operations Comparing Logistics Performance Metrics Diagrams PDF
This slide focuses on the comparison of logistics performance metrics with competitors on the basis of parameters such as shipping time, order accuracy, equipment utilization rate, etc.Deliver an awe inspiring pitch with this creative Developing Excellence In Logistics Operations Comparing Logistics Performance Metrics Diagrams PDF bundle. Topics like Order Accuracy, Equipment Utilization, Transportation Costs can be discussed with this completely editable template. It is available for immediate download depending on the needs and requirements of the user.
Key Performance Indicators Of A Shipping Firm Ppt PowerPoint Presentation Background Designs
This is a key performance indicators of a shipping firm ppt powerpoint presentation background designs. This is a eight stage process. The stages in this process are business, strategy, marketing, process, table, management.

Crm Performance Metrics Sales And Service Ppt Powerpoint Presentation Inspiration Show
This is a crm performance metrics sales and service ppt powerpoint presentation inspiration show. This is a three stage process. The stages in this process are crm, customer relationship management, client relationships.
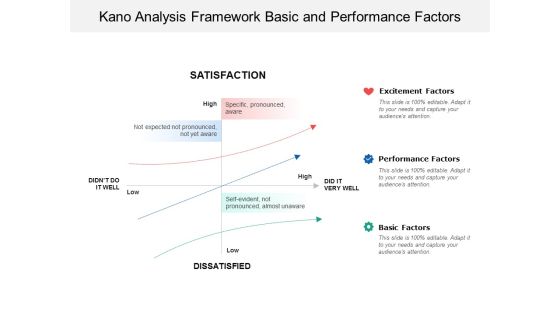
Kano Analysis Framework Basic And Performance Factors Ppt PowerPoint Presentation Pictures Clipart Images
This is a kano analysis framework basic and performance factors ppt powerpoint presentation pictures clipart images. This is a three stage process. The stages in this process are product development, kano model, kano framework.
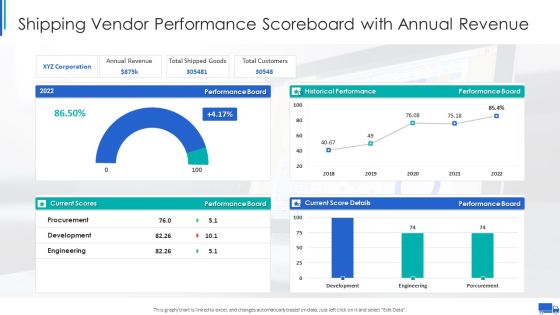
Shipping Vendor Performance Scoreboard With Annual Revenue Ppt Infographics Graphics PDF
This graph or chart is linked to excel, and changes automatically based on data. Just left click on it and select Edit Data. Deliver an awe inspiring pitch with this creative Shipping Vendor Performance Scoreboard With Annual Revenue Ppt Infographics Graphics PDF bundle. Topics like Annual Revenue Board, Total Shipped Goods, Total Customers Performance can be discussed with this completely editable template. It is available for immediate download depending on the needs and requirements of the user.
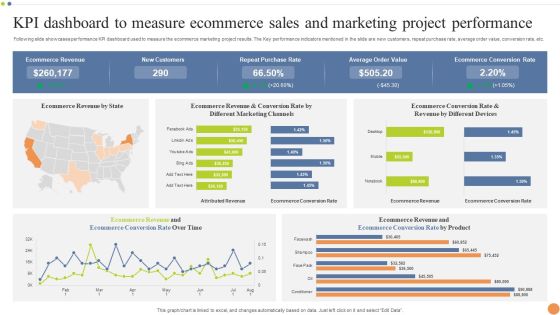
KPI Dashboard To Measure Ecommerce Sales And Marketing Project Performance Portrait PDF
Following slide showcases performance KPI dashboard used to measure the ecommerce marketing project results. The Key performance indicators mentioned in the slide are new customers, repeat purchase rate, average order value, conversion rate, etc. Pitch your topic with ease and precision using this KPI Dashboard To Measure Ecommerce Sales And Marketing Project Performance Portrait PDF. This layout presents information on Purchase Rate, Average Order Value, Ecommerce Conversion Rate. It is also available for immediate download and adjustment. So, changes can be made in the color, design, graphics or any other component to create a unique layout.
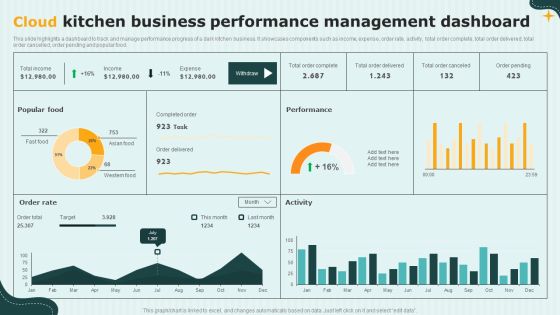
International Cloud Kitchen Industry Analysis Cloud Kitchen Business Performance Management Guidelines PDF
This slide highlights a dashboard to track and manage performance progress of a dark kitchen business. It showcases components such as income, expense, order rate, activity, total order complete, total order delivered, total order cancelled, order pending and popular food. From laying roadmaps to briefing everything in detail, our templates are perfect for you. You can set the stage with your presentation slides. All you have to do is download these easy-to-edit and customizable templates. International Cloud Kitchen Industry Analysis Cloud Kitchen Business Performance Management Guidelines PDF will help you deliver an outstanding performance that everyone would remember and praise you for. Do download this presentation today.
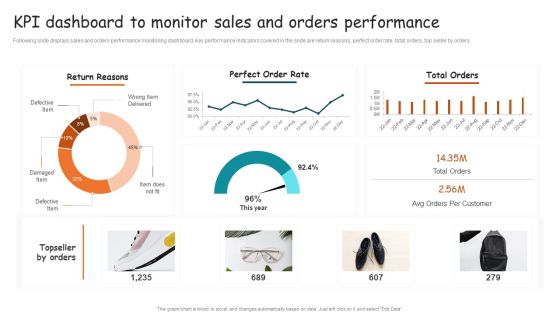
Guide For Brand Kpi Dashboard To Monitor Sales And Orders Performance Brochure PDF
Following slide displays sales and orders performance monitoring dashboard. Key performance indicators covered in the slide are return reasons, perfect order rate, total orders, top seller by orders. Do you have an important presentation coming up Are you looking for something that will make your presentation stand out from the rest Look no further than Guide For Brand Kpi Dashboard To Monitor Sales And Orders Performance Brochure PDF. With our professional designs, you can trust that your presentation will pop and make delivering it a smooth process. And with Slidegeeks, you can trust that your presentation will be unique and memorable. So why wait Grab Guide For Brand Kpi Dashboard To Monitor Sales And Orders Performance Brochure PDF today and make your presentation stand out from the rest.
Employee Productivity Evaluation Across Company Determine Team Performance Tracking Dashboard Structure PDF
This slide provides information about team performance management dashboard by tracking customer concern resolution rate, top people involved, etc.Deliver and pitch your topic in the best possible manner with this Employee Productivity Evaluation Across Company Determine Team Performance Tracking Dashboard Structure PDF. Use them to share invaluable insights on Top Performing, Contact Resolution, Occupancy Rate and impress your audience. This template can be altered and modified as per your expectations. So, grab it now.

Contents Employee Productivity Management Determine Team Performance Tracking Dashboard Inspiration PDF
This slide provides information about team performance management dashboard by tracking customer concern resolution rate, top people involved, etc. Deliver and pitch your topic in the best possible manner with this Contents Employee Productivity Management Determine Team Performance Tracking Dashboard Inspiration PDF Use them to share invaluable insights on Performing Team, Promoter Score, Contact Resolution and impress your audience. This template can be altered and modified as per your expectations. So, grab it now.
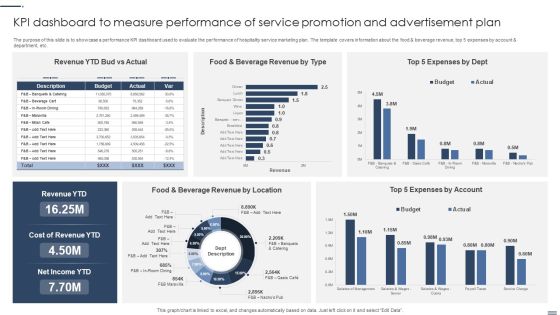
Kpi Dashboard To Measure Performance Of Service Promotion And Advertisement Plan Background PDF
The purpose of this slide is to showcase a performance KPI dashboard used to evaluate the performance of hospitality service marketing plan. The template covers information about the food and beverage revenue, top 5 expenses by account and department, etc. Showcasing this set of slides titled Kpi Dashboard To Measure Performance Of Service Promotion And Advertisement Plan Background PDF. The topics addressed in these templates areLocation, Account, Cost Revenue. All the content presented in this PPT design is completely editable. Download it and make adjustments in color, background, font etc. as per your unique business setting.
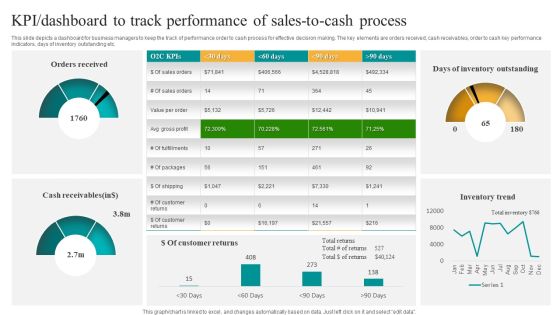
KPI Dashboard To Track Performance Of Sales To Cash Process Download PDF
This slide depicts a dashboard for business managers to keep the track of performance order to cash process for effective decision making. The key elements are orders received, cash receivables, order to cash key performance indicators, days of inventory outstanding etc. Showcasing this set of slides titled KPI Dashboard To Track Performance Of Sales To Cash Process Download PDF. The topics addressed in these templates are Orders Received, Cash Receivables, Days Inventory Outstanding. All the content presented in this PPT design is completely editable. Download it and make adjustments in color, background, font etc. as per your unique business setting.

Strategies To Attract Customers And Lead Generation Current Problem Declining Website Performance Portrait PDF
This slide covers the comparison table for the deteriorating website performance. It includes KPIs such as customer return rate, conversion rate, cart abandonment rate, bounce rate, unique visitor rate, time spent on rate, etc. Presenting Strategies To Attract Customers And Lead Generation Current Problem Declining Website Performance Portrait PDF to provide visual cues and insights. Share and navigate important information on four stages that need your due attention. This template can be used to pitch topics like Customer Return Rate, Abandon Cart Rate, Declining Website Performance. In addtion, this PPT design contains high resolution images, graphics, etc, that are easily editable and available for immediate download.

Consumer Journey Mapping Techniques Customer Support Team Performance Audit And Review Results Professional PDF
This slide covers the customer care department audit results. It includes performance evaluation criteria such as agent name, accepted call legs, declined legs, missed, outbound calls, leg talk time, avg leg talk time, live chat issues resolved, video calls, etc. Showcasing this set of slides titled Consumer Journey Mapping Techniques Customer Support Team Performance Audit And Review Results Professional PDF. The topics addressed in these templates are Audit And Review Results, Team Performance, Customer Support. All the content presented in this PPT design is completely editable. Download it and make adjustments in color, background, font etc. as per your unique business setting.

Customer Support Services Track Kpis To Evaluate Team Performance Icons PDF
The following slide depicts key metrics to evaluate support team performance. Major KPIs covered are customer satisfaction score, first contact resolution, employee engagement and negative response rate. Create an editable Customer Support Services Track Kpis To Evaluate Team Performance Icons PDF that communicates your idea and engages your audience. Whether youre presenting a business or an educational presentation, pre-designed presentation templates help save time. Customer Support Services Track Kpis To Evaluate Team Performance Icons PDF is highly customizable and very easy to edit, covering many different styles from creative to business presentations. Slidegeeks has creative team members who have crafted amazing templates. So, go and get them without any delay.
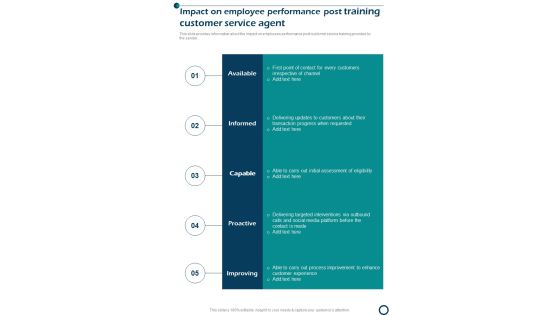
Impact On Employee Performance Post Training Customer Service Agent One Pager Sample Example Document
This slide provides information about the impact on employees performance post customer service training provided by the sender. Presenting you an exemplary Impact On Employee Performance Post Training Customer Service Agent One Pager Sample Example Document. Our one pager comprises all the must have essentials of an inclusive document. You can edit it with ease, as its layout is completely editable. With such freedom, you can tweak its design and other elements to your requirements. Download this Impact On Employee Performance Post Training Customer Service Agent One Pager Sample Example Document brilliant piece now.
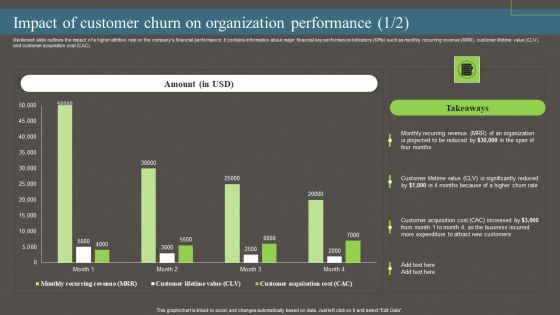
Impact Of Customer Churn On Organization Performance Ppt PowerPoint Presentation File Pictures PDF
Mentioned slide outlines the impact of a higher attrition rate on the companys financial performance. It contains information about major financial key performance indicators KPIs such as monthly recurring revenue MRR, customer lifetime value CLV, and customer acquisition cost CAC. The best PPT templates are a great way to save time, energy, and resources. Slidegeeks have 100 percent editable powerpoint slides making them incredibly versatile. With these quality presentation templates, you can create a captivating and memorable presentation by combining visually appealing slides and effectively communicating your message. Download Impact Of Customer Churn On Organization Performance Ppt PowerPoint Presentation File Pictures PDF from Slidegeeks and deliver a wonderful presentation.

Strategic Ecommerce Plan For B2B Enterprises B2b Sales Performance Tracking Dashboard Demonstration PDF
This slide represents metric dashboard to track sales performance on e-commerce website. It cover performance indicators such as sales breakdown, order breakdown, recurring sales etc. Slidegeeks has constructed Strategic Ecommerce Plan For B2B Enterprises B2b Sales Performance Tracking Dashboard Demonstration PDF after conducting extensive research and examination. These presentation templates are constantly being generated and modified based on user preferences and critiques from editors. Here, you will find the most attractive templates for a range of purposes while taking into account ratings and remarks from users regarding the content. This is an excellent jumping-off point to explore our content and will give new users an insight into our top-notch PowerPoint Templates.
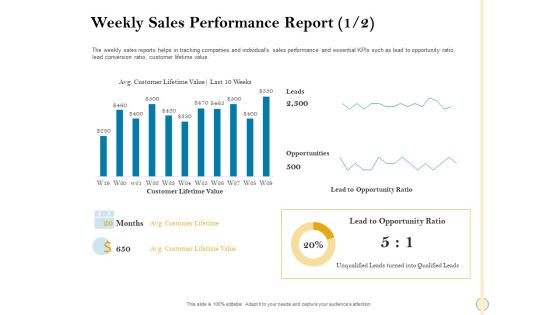
Sales Optimization Best Practices To Close More Deals Weekly Sales Performance Report Customer Clipart PDF
The weekly sales reports helps in tracking companies and individuals sales performance and essential KPIs such as lead to opportunity ratio, lead conversion ratio, customer lifetime value. Deliver and pitch your topic in the best possible manner with this sales optimization best practices to close more deals weekly sales performance report customer clipart pdf. Use them to share invaluable insights on weekly sales performance report and impress your audience. This template can be altered and modified as per your expectations. So, grab it now.

Consumer Journey Mapping Techniques Dashboard For Tracking Customer Service Team Performance Summary PDF
This slide covers the KPI dashboard for analyzing the performance of client support department. It includes metrics such as first call resolution, unresolved calls, average response rate, the best day to call, average time to solve issues, etc. Pitch your topic with ease and precision using this Consumer Journey Mapping Techniques Dashboard For Tracking Customer Service Team Performance Summary PDF. This layout presents information on Dashboard For Tracking Customer, Service Team Performance. It is also available for immediate download and adjustment. So, changes can be made in the color, design, graphics or any other component to create a unique layout.

Customer Service Department Performance Goals With Progress Status Ppt PowerPoint Presentation Infographics Background Image PDF
This slide showcases performance objectives of customer service department which helps team managers to improve sales conversion rate and profitability. It shows performance objectives, task assigned, assigned to, monitored by, deadline and progress status. Showcasing this set of slides titled Customer Service Department Performance Goals With Progress Status Ppt PowerPoint Presentation Infographics Background Image PDF. The topics addressed in these templates are Task Assigned, Monitored, Improve Sales Conversion. All the content presented in this PPT design is completely editable. Download it and make adjustments in color, background, font etc. as per your unique business setting.

Quarterly Sales Performance Of Business Tracker Showing Customer Conversion Rate Formats PDF
This slide delineates a table to record quarter wise performance statistics of sales team in organization. It includes information about completed activities, targets, percentage to target and pace of operations. Pitch your topic with ease and precision using this Quarterly Sales Performance Of Business Tracker Showing Customer Conversion Rate Formats PDF. This layout presents information on Quarterly Sales Performance, Business Tracker Showing, Customer Conversion Rate. It is also available for immediate download and adjustment. So, changes can be made in the color, design, graphics or any other component to create a unique layout.

Dashboard For Measuring Product Sales Performance Multi Brand Promotion Campaign For Customer Engagement Professional PDF
This slide showcases dashboard that can help organization to measure product sales performance after dual branding campaign. Its key components are sales, sales target, gross profit, sales by channel, inventory days outstanding, sales growth etc From laying roadmaps to briefing everything in detail, our templates are perfect for you. You can set the stage with your presentation slides. All you have to do is download these easy to edit and customizable templates. Dashboard For Measuring Product Sales Performance Multi Brand Promotion Campaign For Customer Engagement Professional PDF will help you deliver an outstanding performance that everyone would remember and praise you for. Do download this presentation today.

Implementing On Site Seo Strategy To Expand Customer Reach Measuring Our Seo Performance Professional PDF
The following slide provides various key performance indicators of the SEO strategy, these can be number of users, social networks and new vs returning. From laying roadmaps to briefing everything in detail, our templates are perfect for you. You can set the stage with your presentation slides. All you have to do is download these easy to edit and customizable templates. Implementing On Site Seo Strategy To Expand Customer Reach Measuring Our Seo Performance Professional PDF will help you deliver an outstanding performance that everyone would remember and praise you for. Do download this presentation today.

Integrating CRM Solution To Acquire Potential Customers CRM Mobile Marketing Campaign Performance Tracking Structure PDF
This slide represents the report to track and monitor the performance of CRM mobile marketing campaign organized by the organization. It includes details related to campaign, publisher, clicks, conversions, revenue etc. From laying roadmaps to briefing everything in detail, our templates are perfect for you. You can set the stage with your presentation slides. All you have to do is download these easy to edit and customizable templates. Integrating CRM Solution To Acquire Potential Customers CRM Mobile Marketing Campaign Performance Tracking Structure PDF will help you deliver an outstanding performance that everyone would remember and praise you for. Do download this presentation today.

Developing Excellence In Logistics Operations Kpis To Track Transportation Management System Performance Clipart PDF
This slide focuses on key performance indicators to track transportation management system performance which includes freight cost for each unit shipped, outbound and inbound freight costs, etc.Deliver and pitch your topic in the best possible manner with this Developing Excellence In Logistics Operations Kpis To Track Transportation Management System Performance Clipart PDF Use them to share invaluable insights on Inbound Freight, Transportation Time, Freight Billing and impress your audience. This template can be altered and modified as per your expectations. So, grab it now.

Sales Performance Monitoring Order Number Detection Icon Ppt Summary Rules PDF
Persuade your audience using this Sales Performance Monitoring Order Number Detection Icon Ppt Summary Rules PDF. This PPT design covers four stages, thus making it a great tool to use. It also caters to a variety of topics including Sales Performance, Monitoring Order, Number Detection, Icon. Download this PPT design now to present a convincing pitch that not only emphasizes the topic but also showcases your presentation skills.

Pitch Deck For Shipping And Logistics Startup Addressing Performance Highlights Mockup PDF
This slide caters details about performance highlights of logistics company in terms of CAGR, annual revenues, cash flows from operations, adjusted EBITDA, etc. Presenting pitch deck for shipping and logistics startup addressing performance highlights mockup pdf to provide visual cues and insights. Share and navigate important information on six stages that need your due attention. This template can be used to pitch topics like annual revenues cash flows from operations, critical orders management, adjusted diluted In addtion, this PPT design contains high resolution images, graphics, etc, that are easily editable and available for immediate download.

Performance Monitoring Dashboard For Consumer Goods Industry Analysis Of Food Infographics PDF
This slide showcase the performance monitoring dashboard for consumer goods providing information regarding the overview of food and beverages sales, top selling products and on shelf availability.There are so many reasons you need a Performance Monitoring Dashboard For Consumer Goods Industry Analysis Of Food Infographics PDF. The first reason is you can not spend time making everything from scratch, Thus, Slidegeeks has made presentation templates for you too. You can easily download these templates from our website easily.

Analyzing And Deploying Effective CMS Key Metrics To Measure Current Performance Of Ecommerce Website Infographics PDF
This slide represents the key performance indicators to track and monitor the performance of ecommerce website to draw effective strategies to tackle the problems. It includes key metrics for ecommerce website performance measurement such as average order value and shopping cart abandonment rate. Do you know about Slidesgeeks Analyzing And Deploying Effective CMS Key Metrics To Measure Current Performance Of Ecommerce Website Infographics PDF These are perfect for delivering any kind od presentation. Using it, create PowerPoint presentations that communicate your ideas and engage audiences. Save time and effort by using our pre designed presentation templates that are perfect for a wide range of topic. Our vast selection of designs covers a range of styles, from creative to business, and are all highly customizable and easy to edit. Download as a PowerPoint template or use them as Google Slides themes.
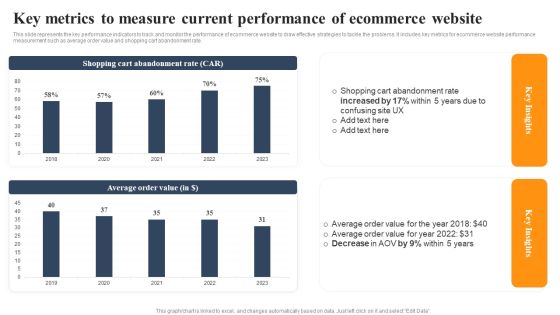
Implementing An Effective Ecommerce Management Framework Key Metrics Current Performance Of Ecommerce Website Slides PDF
This slide represents the key performance indicators to track and monitor the performance of ecommerce website to draw effective strategies to tackle the problems. It includes key metrics for ecommerce website performance measurement such as average order value and shopping cart abandonment rate. The Implementing An Effective Ecommerce Management Framework Key Metrics Current Performance Of Ecommerce Website Slides PDF is a compilation of the most recent design trends as a series of slides. It is suitable for any subject or industry presentation, containing attractive visuals and photo spots for businesses to clearly express their messages. This template contains a variety of slides for the user to input data, such as structures to contrast two elements, bullet points, and slides for written information. Slidegeeks is prepared to create an impression.

Implementing Management System To Enhance Ecommerce Processes Key Metrics To Measure Current Performance Themes PDF
This slide represents the key performance indicators to track and monitor the performance of ecommerce website to draw effective strategies to tackle the problems. It includes key metrics for ecommerce website performance measurement such as average order value and shopping cart abandonment rate. Do you know about Slidesgeeks Implementing Management System To Enhance Ecommerce Processes Key Metrics To Measure Current Performance Themes PDF. These are perfect for delivering any kind od presentation. Using it, create PowerPoint presentations that communicate your ideas and engage audiences. Save time and effort by using our pre designed presentation templates that are perfect for a wide range of topic. Our vast selection of designs covers a range of styles, from creative to business, and are all highly customizable and easy to edit. Download as a PowerPoint template or use them as Google Slides themes.
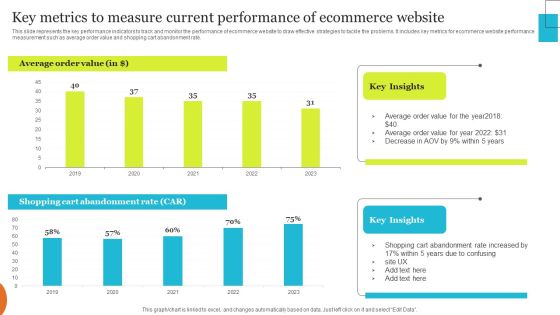
Implementing Effective Ecommerce Managemnet Platform Key Metrics To Measure Current Performance Clipart PDF
This slide represents the key performance indicators to track and monitor the performance of ecommerce website to draw effective strategies to tackle the problems. It includes key metrics for ecommerce website performance measurement such as average order value and shopping cart abandonment rate. Want to ace your presentation in front of a live audience Our Implementing Effective Ecommerce Managemnet Platform Key Metrics To Measure Current Performance Clipart PDF can help you do that by engaging all the users towards you. Slidegeeks experts have put their efforts and expertise into creating these impeccable powerpoint presentations so that you can communicate your ideas clearly. Moreover, all the templates are customizable, and easy to edit and downloadable. Use these for both personal and commercial use.

Leveraging Twitter For Social Performance Analysis Dashboard For Twitter Marketing Mockup PDF
This slide represents the dashboard to analysis the performance of twitter advertising campaign. It provides information regarding total followers gained and lost, impressions, engagement rate. It also covers details of top five used and best performing hashtags performance. Crafting an eye-catching presentation has never been more straightforward. Let your presentation shine with this tasteful yet straightforward Leveraging Twitter For Social Performance Analysis Dashboard For Twitter Marketing Mockup PDF template. It offers a minimalistic and classy look that is great for making a statement. The colors have been employed intelligently to add a bit of playfulness while still remaining professional. Construct the ideal Leveraging Twitter For Social Performance Analysis Dashboard For Twitter Marketing Mockup PDF that effortlessly grabs the attention of your audience Begin now and be certain to wow your customers

Employee Performance Review Form With Overall Rating Ppt Visual Aids Styles PDF
This slide shows the performance review form of employee of an organization to be filled by his supervisor in order to rate his performance. It includes rating employee on the basis of his job knowledge, work quality, attendance, productivity, dependability etc. Pitch your topic with ease and precision using this Employee Performance Review Form With Overall Rating Ppt Visual Aids Styles PDF. This layout presents information on Job Knowledge, Work Quality, Productivity. It is also available for immediate download and adjustment. So, changes can be made in the color, design, graphics or any other component to create a unique layout.

Comparing Marketing Performance With Competitors Digital Marketing Strategy Deployment Information PDF
This slide covers the comparison of companys performance with competitors on the basis of various parameters such as conversion rate, average order value, bounce rate, gross margin, etc. Create an editable Comparing Marketing Performance With Competitors Digital Marketing Strategy Deployment Information PDF that communicates your idea and engages your audience. Whether you are presenting a business or an educational presentation, pre-designed presentation templates help save time. Comparing Marketing Performance With Competitors Digital Marketing Strategy Deployment Information PDF is highly customizable and very easy to edit, covering many different styles from creative to business presentations. Slidegeeks has creative team members who have crafted amazing templates. So, go and get them without any delay.
Guide For Effective Brand Rebranding Performance Tracking Dashboard To Track Microsoft PDF
This slide provides information regarding rebranding performance tracking dashboard in order to track renewed brand. It includes details about total spent, total link clicks, total conversations, etc. From laying roadmaps to briefing everything in detail, our templates are perfect for you. You can set the stage with your presentation slides. All you have to do is download these easy-to-edit and customizable templates. Guide For Effective Brand Rebranding Performance Tracking Dashboard To Track Microsoft PDF will help you deliver an outstanding performance that everyone would remember and praise you for. Do download this presentation today.
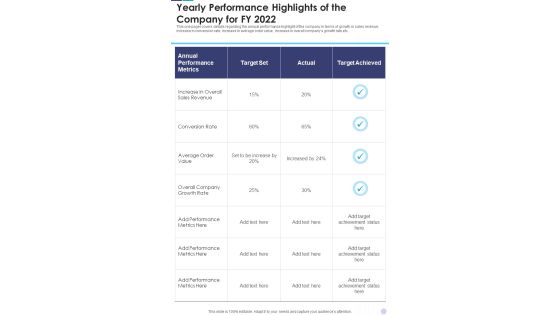
Yearly Performance Highlights Of The Company For FY 2022 One Pager Documents
This one pager covers details regarding the annual performance highlight of the company in terms of growth in sales revenue, increase in conversion rate, increase in average order value, increase in overall companys growth rate etc. Presenting you an exemplary Yearly Performance Highlights Of The Company For FY 2022 One Pager Documents. Our one-pager comprises all the must-have essentials of an inclusive document. You can edit it with ease, as its layout is completely editable. With such freedom, you can tweak its design and other elements to your requirements. Download this Yearly Performance Highlights Of The Company For FY 2022 One Pager Documents brilliant piece now.

Business To Business Digital Channel Management B2B Sales Performance Tracking Dashboard Template PDF
This slide represents metric dashboard to track sales performance on e-commerce website. It cover performance indicators such as sales breakdown, order breakdown, recurring sales etc. Take your projects to the next level with our ultimate collection of Business To Business Digital Channel Management B2B Sales Performance Tracking Dashboard Template PDF. Slidegeeks has designed a range of layouts that are perfect for representing task or activity duration, keeping track of all your deadlines at a glance. Tailor these designs to your exact needs and give them a truly corporate look with your own brand colors they will make your projects stand out from the rest.
E Commerce Operations In B2b B2b Sales Performance Tracking Dashboard Icons PDF
This slide represents metric dashboard to track sales performance on e-commerce website. It cover performance indicators such as sales breakdown, order breakdown, recurring sales etc. Slidegeeks is one of the best resources for PowerPoint templates. You can download easily and regulate E Commerce Operations In B2b B2b Sales Performance Tracking Dashboard Icons PDF for your personal presentations from our wonderful collection. A few clicks is all it takes to discover and get the most relevant and appropriate templates. Use our Templates to add a unique zing and appeal to your presentation and meetings. All the slides are easy to edit and you can use them even for advertisement purposes.

Key Performance Indicators Of Ibn Outsourcing Company With Future Targets Guidelines PDF
The slide shows the key Performance Indicator KPIs which will help the company to track the success rate of implemented strategies. Some of the KPIs are Customer Attrition Rate, Product or Service Adoption Rate, Average Customer Queue Time , Customer Satisfaction Rate etc. Deliver an awe-inspiring pitch with this creative key performance indicators of ibn outsourcing company with future targets guidelines pdf. bundle. Topics like company revenue, customer attrition rate, customer retention rate, performance, customer retention rate can be discussed with this completely editable template. It is available for immediate download depending on the needs and requirements of the user.
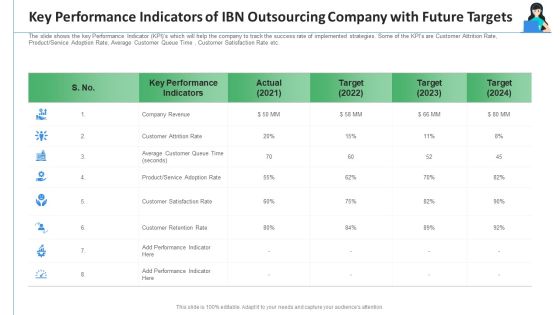
Key Performance Indicators Of IBN Outsourcing Company With Future Targets Ppt Layouts Background Designs PDF
The slide shows the key Performance Indicator KPIs which will help the company to track the success rate of implemented strategies. Some of the KPIs are Customer Attrition Rate, Product Service Adoption Rate, Average Customer Queue Time , Customer Satisfaction Rate etc. Deliver and pitch your topic in the best possible manner with this key performance indicators of IBN outsourcing company with future targets ppt layouts background designs pdf. Use them to share invaluable insights on product service, customer retention rate, company revenue, key performance indicators and impress your audience. This template can be altered and modified as per your expectations. So, grab it now.

Maintaining Partner Relationships KPI Dashboard To Measure Sales Performance Rules PDF
Following slide illustrates sales performance monitoring dashboard. KPIs included in the dashboard are sales revenue, sales growth, average revenue per unit, customer lifetime value and customer acquisition cost. Deliver and pitch your topic in the best possible manner with this Maintaining Partner Relationships KPI Dashboard To Measure Sales Performance Rules PDF. Use them to share invaluable insights on Sales Country Performance, Above Sales Target, YTD, Customer Lifetime Value, Customer Acquisition Cost and impress your audience. This template can be altered and modified as per your expectations. So, grab it now.
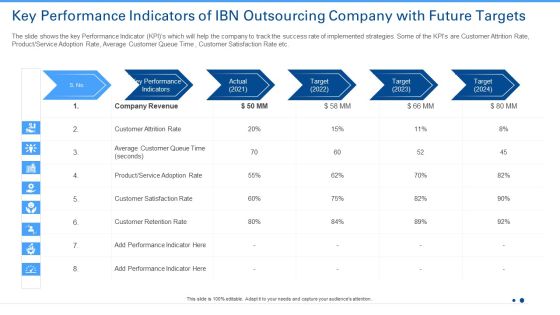
Key Performance Indicators Of IBN Outsourcing Company With Future Targets Graphics PDF
The slide shows the key Performance Indicator KPIs which will help the company to track the success rate of implemented strategies. Some of the KPIs are Customer Attrition Rate, Product Service Adoption Rate, Average Customer Queue Time , Customer Satisfaction Rate etc.Deliver an awe-inspiring pitch with this creative key performance indicators of ibn outsourcing company with future targets graphics pdf. bundle. Topics like key performance indicators, target, actual can be discussed with this completely editable template. It is available for immediate download depending on the needs and requirements of the user.
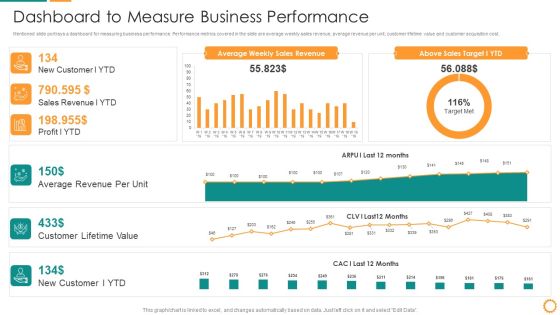
IT Consolidation Post Mergers And Acquisition Dashboard To Measure Business Performance Clipart PDF
Mentioned slide portrays a dashboard for measuring business performance. Performance metrics covered in the slide are average weekly sales revenue, average revenue per unit, customer lifetime value and customer acquisition cost. Deliver and pitch your topic in the best possible manner with this IT Consolidation Post Mergers And Acquisition Dashboard To Measure Business Performance Clipart PDF. Use them to share invaluable insights on Average Revenue, Customer Lifetime Value, Sales Revenue, Sales Target and impress your audience. This template can be altered and modified as per your expectations. So, grab it now.
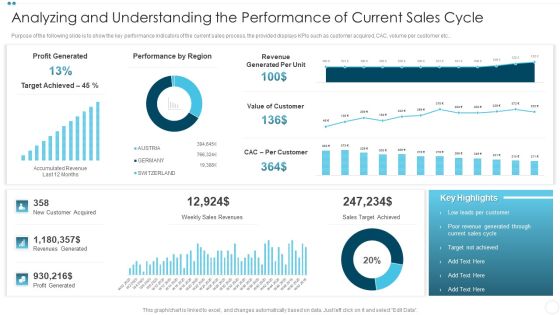
Analyzing And Understanding The Performance Of Current Sales Cycle Background PDF
Purpose of the following slide is to show the key performance indicators of the current sales process, the provided displays KPIs such as customer acquired, CAC, volume per customer etc.Deliver and pitch your topic in the best possible manner with this Analyzing And Understanding The Performance Of Current Sales Cycle Background PDF Use them to share invaluable insights on Profit Generated, Performance By Region, Customer Acquired and impress your audience. This template can be altered and modified as per your expectations. So, grab it now.

Inspecting Sales Optimization Areas Sales Analysis Dashboard To Measure Performance Demonstration PDF
This slide showcases a dashboard presenting various metrics to measure and analyze sales performance for revenue growth. It includes key components such as number of annual new customer, sales revenue, customer satisfaction, customer acquisition cost, product wise sales, month wise sales and sales comparison. From laying roadmaps to briefing everything in detail, our templates are perfect for you. You can set the stage with your presentation slides. All you have to do is download these easy-to-edit and customizable templates. Inspecting Sales Optimization Areas Sales Analysis Dashboard To Measure Performance Demonstration PDF will help you deliver an outstanding performance that everyone would remember and praise you for. Do download this presentation today.
Product Branding To Enhance Product Marketing Activities Performance Tracking Dashboard Portrait PDF
This slide provides information regarding product branding performance tracking dashboard in terms of revenues, new customers, customer satisfaction rate. Crafting an eye-catching presentation has never been more straightforward. Let your presentation shine with this tasteful yet straightforward Product Branding To Enhance Product Marketing Activities Performance Tracking Dashboard Portrait PDF template. It offers a minimalistic and classy look that is great for making a statement. The colors have been employed intelligently to add a bit of playfulness while still remaining professional. Construct the ideal Product Branding To Enhance Product Marketing Activities Performance Tracking Dashboard Portrait PDF that effortlessly grabs the attention of your audience Begin now and be certain to wow your customers.
Umbrella Branding Measures To Boost Brand Awareness Product Branding Performance Tracking Dashboard Information PDF
This slide provides information regarding product branding performance tracking dashboard in terms of revenues, new customers, customer satisfaction rate. This Umbrella Branding Measures To Boost Brand Awareness Product Branding Performance Tracking Dashboard Information PDF from Slidegeeks makes it easy to present information on your topic with precision. It provides customization options, so you can make changes to the colors, design, graphics, or any other component to create a unique layout. It is also available for immediate download, so you can begin using it right away. Slidegeeks has done good research to ensure that you have everything you need to make your presentation stand out. Make a name out there for a brilliant performance.

Selecting Suitable Automated Systems Ensuring Optimum Process Performance Assuring Food Quality And Hygiene Demonstration PDF
This slide provides information regarding selection of appropriate automated system for ensuring optimum process performance and addressing them various parameters. Deliver and pitch your topic in the best possible manner with this selecting suitable automated systems ensuring optimum process performance assuring food quality and hygiene demonstration pdf. Use them to share invaluable insights on centralized monitoring, management, product traceability, standardization, process optimization and impress your audience. This template can be altered and modified as per your expectations. So, grab it now.
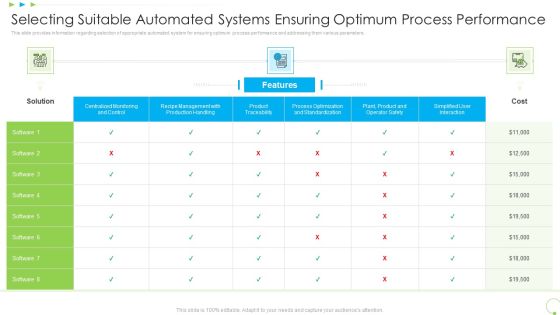
Selecting Suitable Automated Systems Ensuring Optimum Process Performance Uplift Food Production Company Quality Standards Topics PDF
This slide provides information regarding selection of appropriate automated system for ensuring optimum process performance and addressing them various parameters. Deliver and pitch your topic in the best possible manner with this selecting suitable automated systems ensuring optimum process performance uplift food production company quality standards topics pdf. Use them to share invaluable insights on centralized monitoring, management, product traceability, standardization, process optimization and impress your audience. This template can be altered and modified as per your expectations. So, grab it now.

Selecting Suitable Automated Systems Ensuring Optimum Process Performance Food Security Excellence Ppt Styles Slide Download PDF
This slide provides information regarding selection of appropriate automated system for ensuring optimum process performance and addressing them various parameters. Deliver and pitch your topic in the best possible manner with this selecting suitable automated systems ensuring optimum process performance food security excellence ppt styles slide download pdf. Use them to share invaluable insights on centralized monitoring, management, product traceability, standardization, process optimization and impress your audience. This template can be altered and modified as per your expectations. So, grab it now.

Selecting Suitable Automated Systems Ensuring Optimum Process Performance Increased Superiority For Food Products Microsoft PDF
This slide provides information regarding selection of appropriate automated system for ensuring optimum process performance and addressing them various parameters. Deliver and pitch your topic in the best possible manner with this selecting suitable automated systems ensuring optimum process performance increased superiority for food products microsoft pdf. Use them to share invaluable insights on centralized monitoring, management, product traceability, standardization, process optimization and impress your audience. This template can be altered and modified as per your expectations. So, grab it now.

Sales Key Performance Indicators Of The Company Before Strategy Implementation Growth Ppt Infographic Template Microsoft PDF
This slide shows the current Sales Performance Indicators of the company before adopting an effective strategy. These stats are related to Sales Growth, Average Sales Cycle Length, Profit Margin, Customer Churn Rate, Overall Company Sales etc. from the years 2018 to 2020 along with key takeaways. Deliver and pitch your topic in the best possible manner with this sales key performance indicators of the company before strategy implementation growth ppt infographic template microsoft pdf. Use them to share invaluable insights on performance indicators metrics, sales growth, customer churn rate, profit margin, 2018 to 2020 and impress your audience. This template can be altered and modified as per your expectations. So, grab it now.
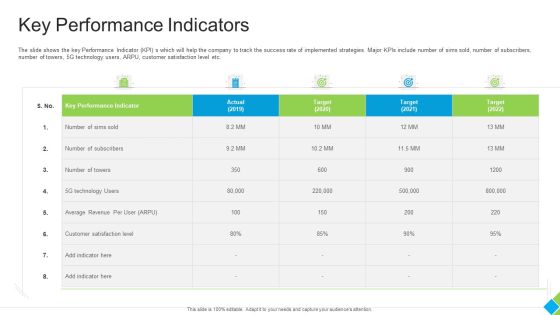
Diminishing Market Share Of A Telecommunication Firm Case Competition Key Performance Indicators Summary PDF
The slide shows the key Performance Indicator KPIs which will help the company to track the success rate of implemented strategies. Major KPIs include number of sims sold, number of subscribers, number of towers, 5G technology users, ARPU, customer satisfaction level etc. Deliver an awe inspiring pitch with this creative diminishing market share of a telecommunication firm case competition key performance indicators summary pdf bundle. Topics like technology, average revenue, customer satisfaction level, key performance indicator, target can be discussed with this completely editable template. It is available for immediate download depending on the needs and requirements of the user.
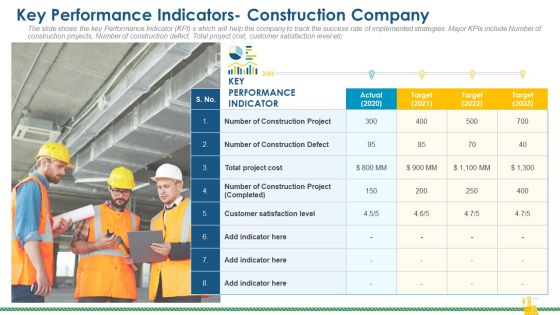
Rising Construction Defect Claims Against The Corporation Key Performance Indicators Construction Company Infographics PDF
The slide shows the key Performance Indicator KPI s which will help the company to track the success rate of implemented strategies. Major KPIs include Number of construction projects, Number of construction defect, Total project cost, customer satisfaction level etc. Deliver an awe inspiring pitch with this creative rising construction defect claims against the corporation key performance indicators construction company infographics pdf bundle. Topics like performance, project, customer satisfaction level can be discussed with this completely editable template. It is available for immediate download depending on the needs and requirements of the user.

 Home
Home