Data Icon

Data And Analytics Playbook How To Bridge Business Intelligence And Predictive Graphics PDF
This template depicts that with interactive BI visualization and predictive modeling in the same enterprise analytics platform, organizations can easily collaborate on initiatives that make recommended actions accessible to the business. Deliver and pitch your topic in the best possible manner with this Data And Analytics Playbook How To Bridge Business Intelligence And Predictive Graphics PDF. Use them to share invaluable insights on Probability By Package, Customer Information, Internet Data and impress your audience. This template can be altered and modified as per your expectations. So, grab it now.

Data And Scientific Capability Five Years Roadmap With Multiple Activities Sample
We present our data and scientific capability five years roadmap with multiple activities sample. This PowerPoint layout is easy to edit so you can change the font size, font type, color, and shape conveniently. In addition to this, the PowerPoint layout is Google Slides compatible, so you can share it with your audience and give them access to edit it. Therefore, download and save this well researched data and scientific capability five years roadmap with multiple activities sample in different formats like PDF, PNG, and JPG to smoothly execute your business plan.

Illustrative Data Structure Five Years Roadmap For Business Intelligence Programs Infographics
We present our illustrative data structure five years roadmap for business intelligence programs infographics. This PowerPoint layout is easy-to-edit so you can change the font size, font type, color, and shape conveniently. In addition to this, the PowerPoint layout is Google Slides compatible, so you can share it with your audience and give them access to edit it. Therefore, download and save this well-researched illustrative data structure five years roadmap for business intelligence programs infographics in different formats like PDF, PNG, and JPG to smoothly execute your business plan.

Illustrative Data Structure Half Yearly Roadmap For Implementing BI Program Professional
We present our illustrative data structure half yearly roadmap for implementing bi program professional. This PowerPoint layout is easy-to-edit so you can change the font size, font type, color, and shape conveniently. In addition to this, the PowerPoint layout is Google Slides compatible, so you can share it with your audience and give them access to edit it. Therefore, download and save this well-researched illustrative data structure half yearly roadmap for implementing bi program professional in different formats like PDF, PNG, and JPG to smoothly execute your business plan.

Data Center Relocation Planning Five Years Roadmap Ppt Summary Slideshow PDF
We present our data center relocation planning five years roadmap ppt summary slideshow pdf. This PowerPoint layout is easy-to-edit so you can change the font size, font type, color, and shape conveniently. In addition to this, the PowerPoint layout is Google Slides compatible, so you can share it with your audience and give them access to edit it. Therefore, download and save this well-researched data center relocation planning five years roadmap ppt summary slideshow pdf in different formats like PDF, PNG, and JPG to smoothly execute your business plan.

Data Center Relocation Half Yearly Roadmap With Multiple Activities Professional PDF
We present our data center relocation half yearly roadmap with multiple activities professional pdf. This PowerPoint layout is easy-to-edit so you can change the font size, font type, color, and shape conveniently. In addition to this, the PowerPoint layout is Google Slides compatible, so you can share it with your audience and give them access to edit it. Therefore, download and save this well-researched data center relocation half yearly roadmap with multiple activities professional pdf in different formats like PDF, PNG, and JPG to smoothly execute your business plan.

Data Center Relocation Six Months Roadmap For Saving Operation Cost Graphics PDF
We present our data center relocation six months roadmap for saving operation cost graphics pdf. This PowerPoint layout is easy-to-edit so you can change the font size, font type, color, and shape conveniently. In addition to this, the PowerPoint layout is Google Slides compatible, so you can share it with your audience and give them access to edit it. Therefore, download and save this well-researched data center relocation six months roadmap for saving operation cost graphics pdf in different formats like PDF, PNG, and JPG to smoothly execute your business plan.
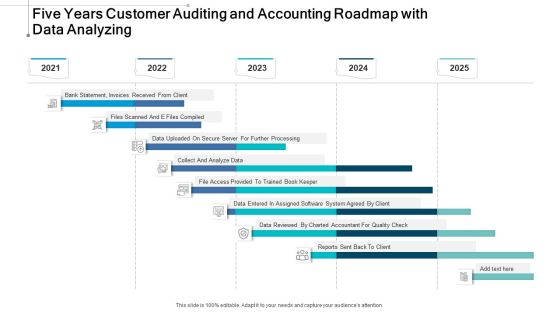
Five Years Client Bookkeeping And Accounting Roadmap With Data Analyzing Rules
We present our five years client bookkeeping and accounting roadmap with data analyzing rules. This PowerPoint layout is easy to edit so you can change the font size, font type, color, and shape conveniently. In addition to this, the PowerPoint layout is Google Slides compatible, so you can share it with your audience and give them access to edit it. Therefore, download and save this well researched five years client bookkeeping and accounting roadmap with data analyzing rules in different formats like PDF, PNG, and JPG to smoothly execute your business plan.

Half Yearly Customer Auditing And Accounting Roadmap With Data Analyzing Demonstration
We present our half yearly customer auditing and accounting roadmap with data analyzing demonstration. This PowerPoint layout is easy to edit so you can change the font size, font type, color, and shape conveniently. In addition to this, the PowerPoint layout is Google Slides compatible, so you can share it with your audience and give them access to edit it. Therefore, download and save this well researched half yearly customer auditing and accounting roadmap with data analyzing demonstration in different formats like PDF, PNG, and JPG to smoothly execute your business plan.
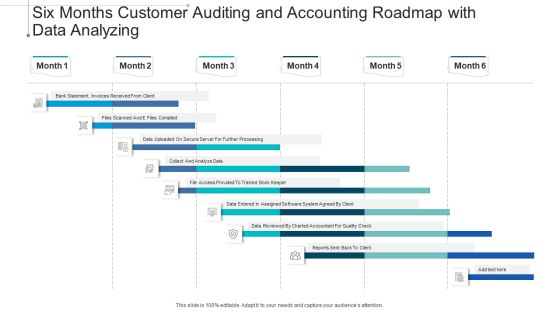
Six Months Customer Auditing And Accounting Roadmap With Data Analyzing Demonstration
We present our six months customer auditing and accounting roadmap with data analyzing demonstration. This PowerPoint layout is easy to edit so you can change the font size, font type, color, and shape conveniently. In addition to this, the PowerPoint layout is Google Slides compatible, so you can share it with your audience and give them access to edit it. Therefore, download and save this well researched six months customer auditing and accounting roadmap with data analyzing demonstration in different formats like PDF, PNG, and JPG to smoothly execute your business plan.

Five Yearly Action Plan Roadmap Development For Master Data Administration Sample
We present our five yearly action plan roadmap development for master data administration sample. This PowerPoint layout is easy to edit so you can change the font size, font type, color, and shape conveniently. In addition to this, the PowerPoint layout is Google Slides compatible, so you can share it with your audience and give them access to edit it. Therefore, download and save this well researched five yearly action plan roadmap development for master data administration sample in different formats like PDF, PNG, and JPG to smoothly execute your business plan.
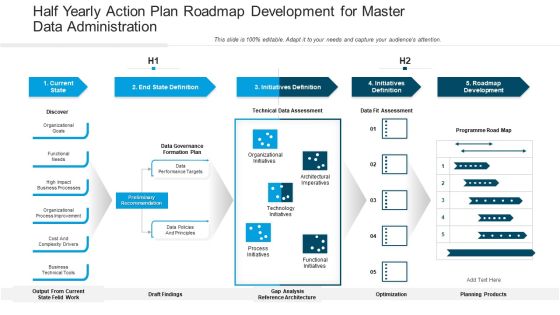
Half Yearly Action Plan Roadmap Development For Master Data Administration Elements
We present our half yearly action plan roadmap development for master data administration elements. This PowerPoint layout is easy to edit so you can change the font size, font type, color, and shape conveniently. In addition to this, the PowerPoint layout is Google Slides compatible, so you can share it with your audience and give them access to edit it. Therefore, download and save this well researched half yearly action plan roadmap development for master data administration elements in different formats like PDF, PNG, and JPG to smoothly execute your business plan.

Six Month Action Plan Roadmap Development For Master Data Administration Structure
We present our six month action plan roadmap development for master data administration structure. This PowerPoint layout is easy to edit so you can change the font size, font type, color, and shape conveniently. In addition to this, the PowerPoint layout is Google Slides compatible, so you can share it with your audience and give them access to edit it. Therefore, download and save this well researched six month action plan roadmap development for master data administration structure in different formats like PDF, PNG, and JPG to smoothly execute your business plan.

Four Quarter Organization Data Analysis Process Enhancement Best Practices Roadmap Demonstration
We present our four quarter organization data analysis process enhancement best practices roadmap demonstration. This PowerPoint layout is easy to edit so you can change the font size, font type, color, and shape conveniently. In addition to this, the PowerPoint layout is Google Slides compatible, so you can share it with your audience and give them access to edit it. Therefore, download and save this well researched four quarter organization data analysis process enhancement best practices roadmap demonstration in different formats like PDF, PNG, and JPG to smoothly execute your business plan.

Agile Techniques For Data Migration Performance Assessment Of It Projects Undertaken Slides PDF
Following slide illustrates performance assessment stats of IT projects undertaken and completed by the organization in FY22. It shows that organization was unable to deliver most of the projects on time. Deliver and pitch your topic in the best possible manner with this Agile Techniques For Data Migration Performance Assessment Of It Projects Undertaken Slides PDF. Use them to share invaluable insights on Workflow Management, Project Failure, Real Time Monitoring, Data Capture, Management And Analysis and impress your audience. This template can be altered and modified as per your expectations. So, grab it now.

Guidebook For Executing Business Market Intelligence Data Evaluation Sample With Conjoint Analysis Ideas PDF
The following slide showcases sample of data assessment with conjoint analysis method to compare features and identify value. It outlines key components such as attribute, level, all responses and comments. Boost your pitch with our creative Guidebook For Executing Business Market Intelligence Data Evaluation Sample With Conjoint Analysis Ideas PDF. Deliver an awe inspiring pitch that will mesmerize everyone. Using these presentation templates you will surely catch everyones attention. You can browse the ppts collection on our website. We have researchers who are experts at creating the right content for the templates. So you do not have to invest time in any additional work. Just grab the template now and use them.

Actual Time Marketing Data Analysis Ppt PowerPoint Presentation Gallery Pictures PDF
The slide exhibits the evaluation of real-time marketing data to assess the program performance. Various KPIs included are planned and actual budget, real-time marketing benefits and year-wise budget allocation. Showcasing this set of slides titled Actual Time Marketing Data Analysis Ppt PowerPoint Presentation Gallery Pictures PDF. The topics addressed in these templates are Planned, Actual Budget, Budget Allocation, Real Time Marketing, Benefits. All the content presented in this PPT design is completely editable. Download it and make adjustments in color, background, font etc. as per your unique business setting.

Medical Care Benefits Of Using Healthcare Data Management Mobile App Diagrams PDF
This slide shows the benefits of using healthcare data management mobile app. This includes various benefits of the application to the providers and the customers such as easily availability of health related information, secure connection, customization, etc. Presenting medical care benefits of using healthcare data management mobile app diagrams pdf to provide visual cues and insights. Share and navigate important information on one stages that need your due attention. This template can be used to pitch topics like security, patient, information, benefits. In addtion, this PPT design contains high resolution images, graphics, etc, that are easily editable and available for immediate download.

Data Interpretation And Analysis Playbook How To Overcome Automated Discovery Of Insights Challenges Rules PDF
This template illustrates that business needs is an intelligent analytics platform that can automatically discover valuable insights from the data. It also depicts that next-generation analytics platform acts as an analyst for the organizations. Deliver an awe inspiring pitch with this creative data interpretation and analysis playbook how to overcome automated discovery of insights challenges rules pdf bundle. Topics like opportunities, organizations, analytics, business can be discussed with this completely editable template. It is available for immediate download depending on the needs and requirements of the user.

Data Interpretation And Analysis Playbook How To Overcome Search Driven Analytics Barriers Summary PDF
This template depicts that intuitive search-driven analytics gives users an easy way to ask questions, receive suggestions on what to query, and visualize their data. Deliver and pitch your topic in the best possible manner with this data interpretation and analysis playbook how to overcome search driven analytics barriers summary pdf. Use them to share invaluable insights on how to overcome search driven analytics barriers and impress your audience. This template can be altered and modified as per your expectations. So, grab it now.

Deploying B2B Advertising Techniques For Lead Generation Statistical Data To Analyze Need Enhancing Graphics PDF
This slide covers need of optimizing demand generation strategies by analyzing statistical data. It involves optimizing right techniques, aligning content with customer journey. Whether you have daily or monthly meetings, a brilliant presentation is necessary. Deploying B2B Advertising Techniques For Lead Generation Statistical Data To Analyze Need Enhancing Graphics PDF can be your best option for delivering a presentation. Represent everything in detail using Deploying B2B Advertising Techniques For Lead Generation Statistical Data To Analyze Need Enhancing Graphics PDF and make yourself stand out in meetings. The template is versatile and follows a structure that will cater to your requirements. All the templates prepared by Slidegeeks are easy to download and edit. Our research experts have taken care of the corporate themes as well. So, give it a try and see the results.

Cloud Storage For Cloud Data Migration Ppt PowerPoint Presentation Diagram Images PDF
This slide represents the use case of cloud storage service in cloud data migration by describing its benefits such as affordability, reliability, availability, and durability. Want to ace your presentation in front of a live audience Our Cloud Storage For Cloud Data Migration Ppt PowerPoint Presentation Diagram Images PDF can help you do that by engaging all the users towards you. Slidegeeks experts have put their efforts and expertise into creating these impeccable powerpoint presentations so that you can communicate your ideas clearly. Moreover, all the templates are customizable, and easy to edit and downloadable. Use these for both personal and commercial use.

Software KPI Data Of Warehouse With Manufacturer And Category Diagrams PDF
Showcasing this set of slides titled Software KPI Data Of Warehouse With Manufacturer And Category Diagrams PDF The topics addressed in these templates are Software Product Versions, Capabilities With Internal, Applications By Capability All the content presented in this PPT design is completely editable. Download it and make adjustments in color, background, font etc. as per your unique business setting.
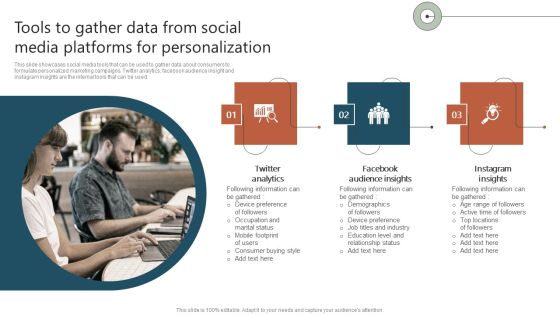
Tools To Gather Data From Social Media Platforms For Personalization Ppt Infographic Template Information PDF
This slide showcases social media tools that can be used to gather data about consumers to formulate personalized marketing campaigns. Twitter analytics, facebook audience insight and instagram insights are the internal tools that can be used. If you are looking for a format to display your unique thoughts, then the professionally designed Tools To Gather Data From Social Media Platforms For Personalization Ppt Infographic Template Information PDF is the one for you. You can use it as a Google Slides template or a PowerPoint template. Incorporate impressive visuals, symbols, images, and other charts. Modify or reorganize the text boxes as you desire. Experiment with shade schemes and font pairings. Alter, share or cooperate with other people on your work. Download Tools To Gather Data From Social Media Platforms For Personalization Ppt Infographic Template Information PDF and find out how to give a successful presentation. Present a perfect display to your team and make your presentation unforgettable.

Cloud Security Assessment How Does Cloud Security Work Data Security Diagrams PDF
This slide represents the data recovery and business continuity plan in cloud security and what to consider while making a business continuity plan.Presenting Cloud Security Assessment How Does Cloud Security Work Data Security Diagrams PDF to provide visual cues and insights. Share and navigate important information on four stages that need your due attention. This template can be used to pitch topics like Impact Analysis, Recovery Strategies, Plan Development. In addtion, this PPT design contains high resolution images, graphics, etc, that are easily editable and available for immediate download.

Integrating Parallel Processor System Single Instruction And Multiple Data Stream Simd Ideas PDF
This slide depicts the single instruction and multiple data stream types of parallel processing and how tasks are performed in this. It also covers components such as memory, control unit, processor unit, alignment network, and memory modules. Explore a selection of the finest Integrating Parallel Processor System Single Instruction And Multiple Data Stream Simd Ideas PDF here. With a plethora of professionally designed and pre-made slide templates, you can quickly and easily find the right one for your upcoming presentation. You can use our Integrating Parallel Processor System Single Instruction And Multiple Data Stream Simd Ideas PDF to effectively convey your message to a wider audience. Slidegeeks has done a lot of research before preparing these presentation templates. The content can be personalized and the slides are highly editable. Grab templates today from Slidegeeks.

BPM System Methodology Data Flow Representation Of Business Modelling Pictures PDF
This slide covers technique based on flow of data to execute various business processes. The purpose of this slide is to present graphical or visual representation using a standardized set of symbols and notations to explain several businesss operations through data movement. It includes elements such as flow of information between external entities including customer order and payment record database, etc. This modern and well-arranged BPM System Methodology Data Flow Representation Of Business Modelling Pictures PDF provides lots of creative possibilities. It is very simple to customize and edit with the Powerpoint Software. Just drag and drop your pictures into the shapes. All facets of this template can be edited with Powerpoint, no extra software is necessary. Add your own material, put your images in the places assigned for them, adjust the colors, and then you can show your slides to the world, with an animated slide included.
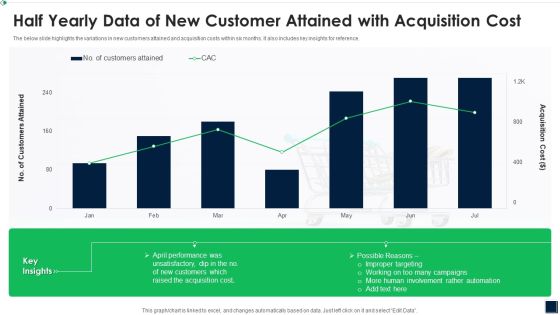
Half Yearly Data Of New Customer Attained With Acquisition Cost Mockup PDF
The below slide highlights the variations in new customers attained and acquisition costs within six months. It also includes key insights for reference.Showcasing this set of slides titled Half Yearly Data Of New Customer Attained With Acquisition Cost Mockup PDF The topics addressed in these templates are Half Yearly Data OF New Customer Attained WITH Acquisition Cost All the content presented in this PPT design is completely editable. Download it and make adjustments in color, background, font etc. as per your unique business setting.
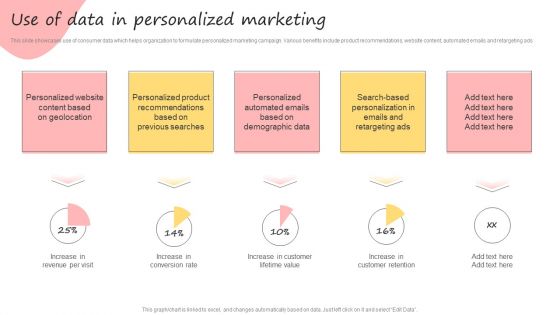
Developing Promotional Strategic Plan For Online Marketing Use Of Data In Personalized Marketing Inspiration PDF
This slide showcases use of consumer data which helps organization to formulate personalized marketing campaign. Various benefits include product recommendations, website content, automated emails and retargeting ads. If your project calls for a presentation, then Slidegeeks is your go-to partner because we have professionally designed, easy-to-edit templates that are perfect for any presentation. After downloading, you can easily edit Developing Promotional Strategic Plan For Online Marketing Use Of Data In Personalized Marketing Inspiration PDF and make the changes accordingly. You can rearrange slides or fill them with different images. Check out all the handy templates
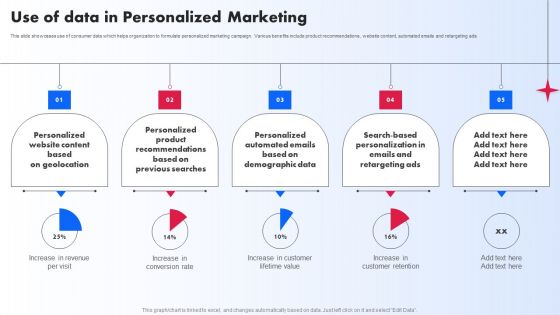
Use Of Data In Personalized Marketing Ppt PowerPoint Presentation File Professional PDF
This slide showcases use of consumer data which helps organization to formulate personalized marketing campaign. Various benefits include product recommendations, website content, automated emails and retargeting ads. If your project calls for a presentation, then Slidegeeks is your go to partner because we have professionally designed, easy to edit templates that are perfect for any presentation. After downloading, you can easily edit Use Of Data In Personalized Marketing Ppt PowerPoint Presentation File Professional PDF and make the changes accordingly. You can rearrange slides or fill them with different images. Check out all the handy templates

KPI Dashboard To Monitor Workforce Diversity Data And Inclusion Of IT Firm Slides PDF
Following slide demonstrates KPI dashboard to track diversity and inclusion which can be used by managers to develop workforce for business . It includes elements such as hiring data diversity, performance rating, promotion rate, promotion percentage, employee turnover, top management gender diversity, etc. Showcasing this set of slides titled KPI Dashboard To Monitor Workforce Diversity Data And Inclusion Of IT Firm Slides PDF. The topics addressed in these templates are Employee Turnover, Management, Promotion Rate. All the content presented in this PPT design is completely editable. Download it and make adjustments in color, background, font etc. as per your unique business setting.

Retail Store Data Map Dashboard Ppt PowerPoint Presentation Gallery Display PDF
This slide shows retail store data inventory dashboard. It provides information such as units sold, on hand, stock availability, top selling items, average inventory value by product category, etc. Pitch your topic with ease and precision using this Retail Store Data Map Dashboard Ppt PowerPoint Presentation Gallery Display PDF. This layout presents information on Inventory Turn, Over Ratio, Gross Margin ROI. It is also available for immediate download and adjustment. So, changes can be made in the color, design, graphics or any other component to create a unique layout.

Database Expansion And Optimization Dashboard For Data Repository Monitoring Ppt Model Infographic Template
This slide presents the dashboard for effective monitoring of the data repository. It visually shows the information regarding the databases throughput, response time, query type, error code, etc. Deliver and pitch your topic in the best possible manner with this database expansion and optimization dashboard for data repository monitoring ppt model infographic template. Use them to share invaluable insights on database throughput, average database response, live database connections and impress your audience. This template can be altered and modified as per your expectations. So, grab it now.

Executing Advance Data Analytics At Workspace Current Potential Implications Demonstration PDF
This slide provides information regarding the potential implications concerns existing in firm in terms of increase in issues related to employees such as lack of expertise, ineffectiveness in handling issues, reported financial losses due to financial threats and data breaches with records exposed. Deliver an awe inspiring pitch with this creative executing advance data analytics at workspace current potential implications demonstration pdf bundle. Topics like current potential implications faced by firm can be discussed with this completely editable template. It is available for immediate download depending on the needs and requirements of the user.
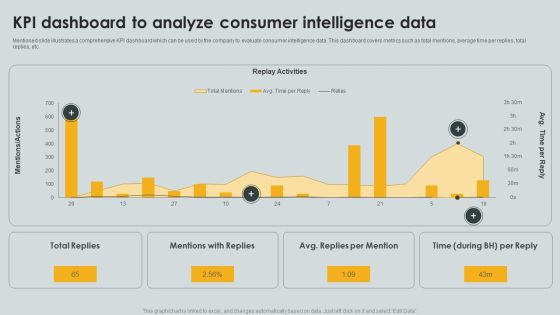
KPI Dashboard To Analyze Consumer Intelligence Data Ppt PowerPoint Presentation File Portfolio PDF
Mentioned slide illustrates a comprehensive KPI dashboard which can be used by the company to evaluate consumer intelligence data. This dashboard covers metrics such as total mentions, average time per replies, total replies, etc. Pitch your topic with ease and precision using this KPI Dashboard To Analyze Consumer Intelligence Data Ppt PowerPoint Presentation File Portfolio PDF. This layout presents information on Replay Activities, Total Replies, Mentions Replies. It is also available for immediate download and adjustment. So, changes can be made in the color, design, graphics or any other component to create a unique layout.
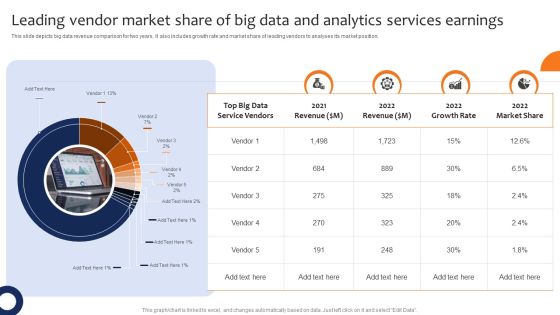
Leading Vendor Market Share Of Big Data And Analytics Services Earnings Professional PDF
This slide depicts big data revenue comparison for two years. It also includes growth rate and market share of leading vendors to analyses its market position. Pitch your topic with ease and precision using this Leading Vendor Market Share Of Big Data And Analytics Services Earnings Professional PDF. This layout presents information on Revenue, Growth Rate, Market Share. It is also available for immediate download and adjustment. So, changes can be made in the color, design, graphics or any other component to create a unique layout.

Benefits Of Metadata Management To Data Analysts In Organization Diagrams PDF
This slide covers the basic benefits of metadata for any data reader in an organization. The purpose of this template is to define usage of metadata for increasing business revenue. It also includes details related to websites, consumers, social media, etc. Showcasing this set of slides titled Benefits Of Metadata Management To Data Analysts In Organization Diagrams PDF. The topics addressed in these templates are Benefits, Action Steps, Outcomes. All the content presented in this PPT design is completely editable. Download it and make adjustments in color, background, font etc. as per your unique business setting.

Personnel Salary Summary Dashboard With EPF And ESI Data Brochure PDF
The following highlights the slide employee payroll summary dashboard with EPF and ESI data illustrating key headings which includes payroll period, tasks to do, payroll deductions, employee summary and payroll cost. Pitch your topic with ease and precision using this Personnel Salary Summary Dashboard With EPF And ESI Data Brochure PDF. This layout presents information on Employee Provident Fund, Employee State Insurance, Tax Deducted At Source. It is also available for immediate download and adjustment. So, changes can be made in the color, design, graphics or any other component to create a unique layout.

Average Costing On Threats Management For Data Breach Incident Demonstration PDF
This slide covers total cost incurred on response of data breach incident. It includes four categories such as incident detection and escalation, notifications, post breach response, lost business cost ,etc. Pitch your topic with ease and precision using this Average Costing On Threats Management For Data Breach Incident Demonstration PDF. This layout presents information on Lost Business Cost, Detection And Escalation, Notification. It is also available for immediate download and adjustment. So, changes can be made in the color, design, graphics or any other component to create a unique layout.

Cognitive Analytics Strategy And Techniques Tracking Customer Data Insights Dashboard Demonstration PDF
This slide provides information regarding customer data insights dashboard in terms of average churn risk, segments, high earner, highly engaged customers, etc. Take your projects to the next level with our ultimate collection of Cognitive Analytics Strategy And Techniques Tracking Customer Data Insights Dashboard Demonstration PDF. Slidegeeks has designed a range of layouts that are perfect for representing task or activity duration, keeping track of all your deadlines at a glance. Tailor these designs to your exact needs and give them a truly corporate look with your own brand colors they will make your projects stand out from the rest.

Project Data Quality Kpis Metrics Summary Dashboard With Threshold Guidelines PDF
This slide covers different KPIs to measure performance of data quality for project completion. It includes metric such as consistency, completeness, orderliness, timeliness, accuracy, auditability and uniqueness with thresholds. Pitch your topic with ease and precision using this Project Data Quality Kpis Metrics Summary Dashboard With Threshold Guidelines PDF. This layout presents information on Consistency, Completeness, Orderliness. It is also available for immediate download and adjustment. So, changes can be made in the color, design, graphics or any other component to create a unique layout.

Country Wise Data Of Average Duration Of Hospital Stay After Giving Birth Designs PDF
This slide showcases the average length of hospital stay based on the diagnosis to understand issues and enhance patient acute care management. It also includes the length of womens hospital stays in different nations. Pitch your topic with ease and precision using this Country Wise Data Of Average Duration Of Hospital Stay After Giving Birth Designs PDF. This layout presents information on Country Wise Data, Average Duration. It is also available for immediate download and adjustment. So, changes can be made in the color, design, graphics or any other component to create a unique layout.

Clinical Trial Phases With Data Focus And Design Features Clinical Research Trial Phases Structure PDF
This slide shows the tabulation of key objectives of multiple phases of the clinical research process. It also provides information regarding factors to be identified while investigating the new drug. Find highly impressive Clinical Trial Phases With Data Focus And Design Features Clinical Research Trial Phases Structure PDF on Slidegeeks to deliver a meaningful presentation. You can save an ample amount of time using these presentation templates. No need to worry to prepare everything from scratch because Slidegeeks experts have already done a huge research and work for you. You need to download Clinical Trial Phases With Data Focus And Design Features Clinical Research Trial Phases Structure PDF for your upcoming presentation. All the presentation templates are 100 percent editable and you can change the color and personalize the content accordingly. Download now.
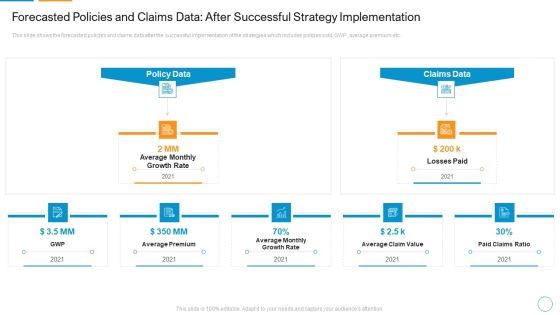
Forecasted Policies And Claims Data After Successful Strategy Implementation Diagrams PDF
This slide shows the forecasted policies and claims data after the successful implementation of the strategies which includes policies sold, GWP, average premium etc.Presenting forecasted policies and claims data after successful strategy implementation diagrams pdf to provide visual cues and insights. Share and navigate important information on five stages that need your due attention. This template can be used to pitch topics like average premium, average monthly growth rate, average claim value. In addtion, this PPT design contains high resolution images, graphics, etc, that are easily editable and available for immediate download.
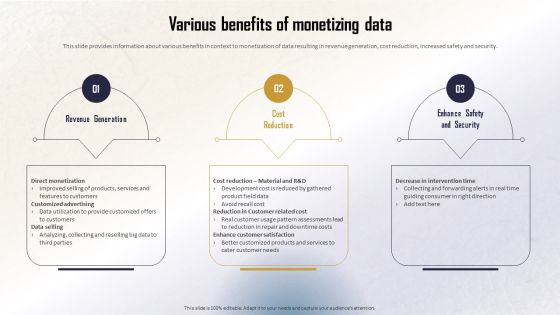
Identifying Direct And Indirect Various Benefits Of Monetizing Data Diagrams PDF
This slide provides information about various benefits in context to monetization of data resulting in revenue generation, cost reduction, increased safety and security. Take your projects to the next level with our ultimate collection of Identifying Direct And Indirect Various Benefits Of Monetizing Data Diagrams PDF. Slidegeeks has designed a range of layouts that are perfect for representing task or activity duration, keeping track of all your deadlines at a glance. Tailor these designs to your exact needs and give them a truly corporate look with your own brand colors theyll make your projects stand out from the rest
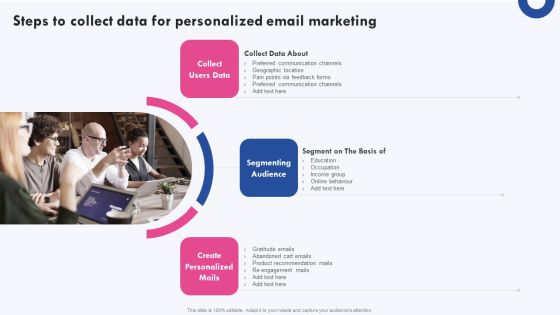
Targeted Marketing Campaigns To Improve Buyers Experience Steps To Collect Data For Personalized Email Diagrams PDF
Do you have an important presentation coming up Are you looking for something that will make your presentation stand out from the rest Look no further than Targeted Marketing Campaigns To Improve Buyers Experience Steps To Collect Data For Personalized Email Diagrams PDF. With our professional designs, you can trust that your presentation will pop and make delivering it a smooth process. And with Slidegeeks, you can trust that your presentation will be unique and memorable. So why wait Grab Targeted Marketing Campaigns To Improve Buyers Experience Steps To Collect Data For Personalized Email Diagrams PDF today and make your presentation stand out from the rest.

Customer Behavioral Data And Analytics Customer Shopping Behavior Week Inspiration PDF
Track shoppers behavior during different days and weeks. If particular days are most profitable weekends for example marketing campaigns should exploit the data to increase revenue for the company. Deliver and pitch your topic in the best possible manner with this customer behavioral data and analytics customer shopping behavior week inspiration pdf. Use them to share invaluable insights on purchase hour of the day value, purchase day of the week value, purchase day of the month value, purchase month of the year value and impress your audience. This template can be altered and modified as per your expectations. So, grab it now.
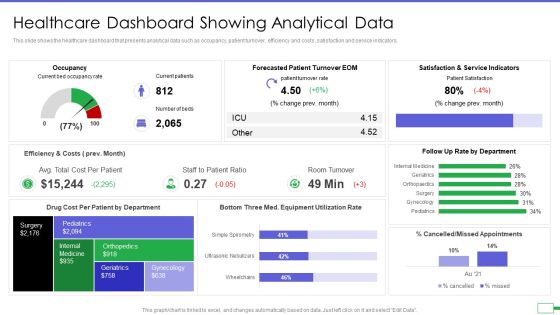
Iot And Digital Twin To Reduce Costs Post Covid Healthcare Dashboard Showing Analytical Data Elements PDF
This slide shows the healthcare dashboard that presents analytical data such as occupancy, patient turnover, efficiency and costs, satisfaction and service indicators. Deliver and pitch your topic in the best possible manner with this iot and digital twin to reduce costs post covid healthcare dashboard showing analytical data elements pdf. Use them to share invaluable insights on occupancy, patient turnover, efficiency and costs, satisfaction and service indicators and impress your audience. This template can be altered and modified as per your expectations. So, grab it now.
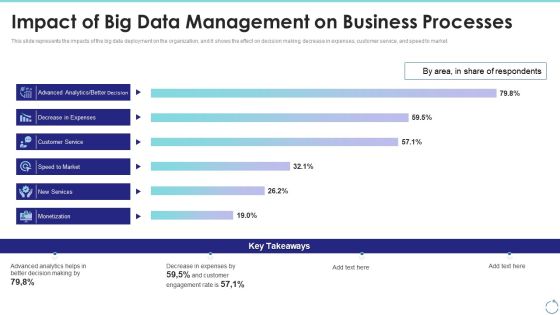
Impact Of Big Data Management On Business Processes Ppt Inspiration Gallery PDF
This slide represents the impacts of the big data deployment on the organization, and it shows the effect on decision making, decrease in expenses, customer service, and speed to market. Deliver and pitch your topic in the best possible manner with this impact of big data management on business processes ppt inspiration gallery pdf. Use them to share invaluable insights on analytics, customer, expenses, services and impress your audience. This template can be altered and modified as per your expectations. So, grab it now.
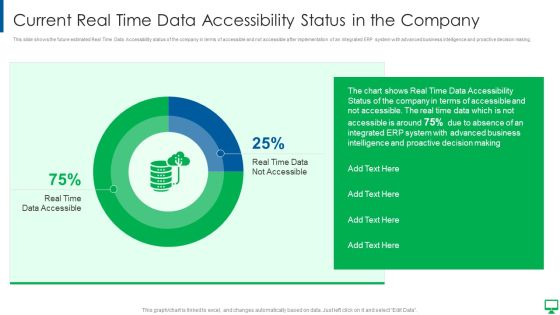
Execution Of ERP System To Enhance Business Effectiveness Current Real Time Data Infographics PDF
This slide shows the future estimated Real Time Data Accessibility status of the company in terms of accessible and not accessible after implementation of an integrated ERP system with advanced business intelligence and proactive decision making.Deliver and pitch your topic in the best possible manner with this Execution of erp system to enhance business effectiveness current real time data infographics pdf Use them to share invaluable insights on status of the company, intelligence and proactive, advanced business and impress your audience. This template can be altered and modified as per your expectations. So, grab it now.

Data And Analytics Playbook How To Overcome Automated Discovery Of Insights Background PDF
This template illustrates that business needs is an intelligent analytics platform that can automatically discover valuable insights from the data. It also depicts that next-generation analytics platform acts as an analyst for the organizations. Deliver an awe inspiring pitch with this creative Data And Analytics Playbook How To Overcome Automated Discovery Of Insights Background PDF bundle. Topics like Estimated Time Savings, Automation Opportunities, Possible Deflections, Assignment Group can be discussed with this completely editable template. It is available for immediate download depending on the needs and requirements of the user.

Administered Data And Analytic Quality Playbook How To Overcome Automated Discovery Mockup PDF
This template illustrates that business needs is an intelligent analytics platform that can automatically discover valuable insights from the data. It also depicts that next generation analytics platform acts as an analyst for the organizations.Deliver an awe inspiring pitch with this creative Administered Data And Analytic Quality Playbook How To Overcome Automated Discovery Mockup PDF bundle. Topics like Automation Opportunities, Possible Deflections, Estimated Savings can be discussed with this completely editable template. It is available for immediate download depending on the needs and requirements of the user.

Impacts Of Big Data Management On Business Processes Ppt PowerPoint Presentation File Infographics PDF
This slide represents the impacts of the big data deployment on the organization, and it shows the effect on decision making, decrease in expenses, customer service, and speed to market. Deliver and pitch your topic in the best possible manner with this Impacts Of Big Data Management On Business Processes Ppt PowerPoint Presentation File Infographics PDF. Use them to share invaluable insights on Decision Making, Expenses, Customer Engagement Rate and impress your audience. This template can be altered and modified as per your expectations. So, grab it now.

Financial Data Revelation To Varied Stakeholders Composition Of Gross Revenue By Services And Region Slides PDF
This slide shows the composition of revenue and sales by regions such as America, China, Europe, etc. Create an editable Financial Data Revelation To Varied Stakeholders Composition Of Gross Revenue By Services And Region Slides PDF that communicates your idea and engages your audience. Whether you are presenting a business or an educational presentation, pre designed presentation templates help save time. Financial Data Revelation To Varied Stakeholders Composition Of Gross Revenue By Services And Region Slides PDF is highly customizable and very easy to edit, covering many different styles from creative to business presentations. Slidegeeks has creative team members who have crafted amazing templates. So, go and get them without any delay.
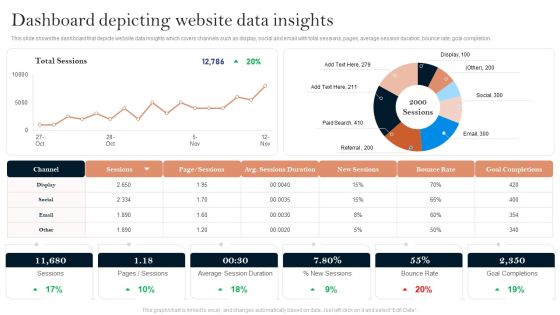
Successful Branding Technique For Electronic Commerce Corporation Dashboard Depicting Website Data Insights Microsoft PDF
Do you have to make sure that everyone on your team knows about any specific topic. I yes, then you should give Successful Branding Technique For Electronic Commerce Corporation Dashboard Depicting Website Data Insights Microsoft PDF a try. Our experts have put a lot of knowledge and effort into creating this impeccable Successful Branding Technique For Electronic Commerce Corporation Dashboard Depicting Website Data Insights Microsoft PDF. You can use this template for your upcoming presentations, as the slides are perfect to represent even the tiniest detail. You can download these templates from the Slidegeeks website and these are easy to edit. So grab these today.
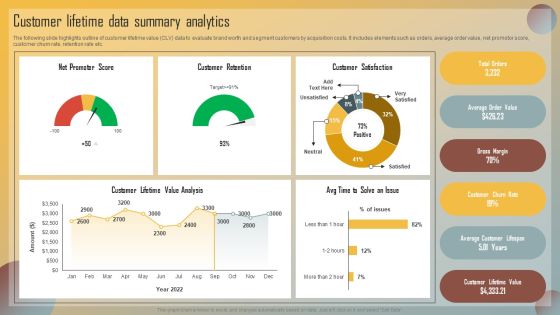
Guide For Marketing Analytics To Improve Decisions Customer Lifetime Data Summary Analytics Structure PDF
The following slide highlights outline of customer lifetime value CLV data to evaluate brand worth and segment customers by acquisition costs. It includes elements such as orders, average order value, net promotor score, customer churn rate, retention rate etc. Find a pre designed and impeccable Guide For Marketing Analytics To Improve Decisions Customer Lifetime Data Summary Analytics Structure PDF. The templates can ace your presentation without additional effort. You can download these easy to edit presentation templates to make your presentation stand out from others. So, what are you waiting for Download the template from Slidegeeks today and give a unique touch to your presentation.
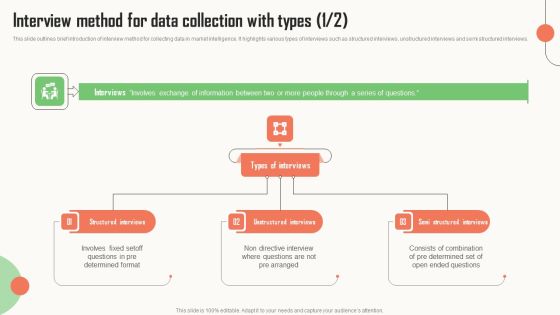
Strategic Market Insight Implementation Guide Interview Method For Data Collection With Types Diagrams PDF
This slide outlines brief introduction of interview method for collecting data in market intelligence. It highlights various types of interviews such as structured interviews, unstructured interviews and semi structured interviews. Make sure to capture your audiences attention in your business displays with our gratis customizable Strategic Market Insight Implementation Guide Interview Method For Data Collection With Types Diagrams PDF. These are great for business strategies, office conferences, capital raising or task suggestions. If you desire to acquire more customers for your tech business and ensure they stay satisfied, create your own sales presentation with these plain slides.

Timeline For Data Migration To Cloud Storage Ppt PowerPoint Presentation File Deck PDF
This slide depicts the timeline for migrating data to the cloud storage, including various phases such as assessment, planning, validation, migration, and verification and optimization. Do you have an important presentation coming up Are you looking for something that will make your presentation stand out from the rest Look no further than Timeline For Data Migration To Cloud Storage Ppt PowerPoint Presentation File Deck PDF. With our professional designs, you can trust that your presentation will pop and make delivering it a smooth process. And with Slidegeeks, you can trust that your presentation will be unique and memorable. So why wait Grab Timeline For Data Migration To Cloud Storage Ppt PowerPoint Presentation File Deck PDF today and make your presentation stand out from the rest.
Business Strategy 5 Staged Data Analysis Strategic Plan Example Ppt Slide
Double Your Chances With Our business strategy 5 staged data analysis strategic plan example ppt slide Powerpoint Templates. The Value Of Your Thoughts Will Increase Two-Fold. Charm The Audience With Your Thoughts. Add Our Process and Flows Powerpoint Templates And They Will Be Dotty For You.
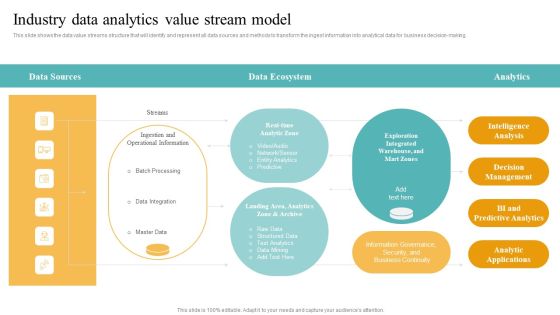
Transformation Toolkit Competitive Intelligence Information Analysis Industry Data Analytics Value Stream Model Raw Mockup PDF
This slide illustrates the workflow related to performing the data analytics project along with key responsible owners to accomplish the activities. If you are looking for a format to display your unique thoughts, then the professionally designed Transformation Toolkit Competitive Intelligence Information Analysis Industry Data Analytics Value Stream Model Raw Mockup PDF is the one for you. You can use it as a Google Slides template or a PowerPoint template. Incorporate impressive visuals, symbols, images, and other charts. Modify or reorganize the text boxes as you desire. Experiment with shade schemes and font pairings. Alter, share or cooperate with other people on your work. Download Transformation Toolkit Competitive Intelligence Information Analysis Industry Data Analytics Value Stream Model Raw Mockup PDF and find out how to give a successful presentation. Present a perfect display to your team and make your presentation unforgettable.

 Home
Home