Data Icon

Data Collection And Analysis Flow Chart Ppt PowerPoint Presentation Outline Graphics
This is a data collection and analysis flow chart ppt powerpoint presentation outline graphics. This is a five stage process. The stages in this process are business, management, planning, strategy, marketing.
Market Performance Analysis Data Chart With Arrow Ppt PowerPoint Presentation Inspiration Graphics
This is a market performance analysis data chart with arrow ppt powerpoint presentation inspiration graphics. This is a four stage process. The stages in this process are marketing analytics, marketing performance, marketing discovery.

24 Hour Timeframe Chart For Data Driven Decision Management Ppt PowerPoint Presentation File Example PDF
Presenting 24 hour timeframe chart for data driven decision management ppt powerpoint presentation file example pdf to dispense important information. This template comprises ten stages. It also presents valuable insights into the topics including 24 hour timeframe chart for data driven decision management. This is a completely customizable PowerPoint theme that can be put to use immediately. So, download it and address the topic impactfully.

Financial Waterfall Chart For Data Visualization Ppt PowerPoint Presentation Ideas Elements
This is a financial waterfall chart for data visualization ppt powerpoint presentation ideas elements. This is a five stage process. The stages in this process are sales waterfall, waterfall chart, business.
Stock Photo Corporate Business Strategy Pie Chart To Compare Data Best
Our stock photo corporate business strategy pie chart to compare data best ensure the force is with you. They enhance the energy in you. Our marketing help ideas come into force. They encourage the audience to commence action.
Stock Photo Develop Business Strategy Compare Data Pie Chart Stock Images
All for one and one for all. Our stock photo develop business strategy compare data pie chart stock images are all for you. Get things done on a war footing. Our marketing are excellent accelerators.

Computer Screen With Business Data Charts Ppt Powerpoint Presentation Show Vector
This is a computer screen with business data charts ppt powerpoint presentation show vector. This is a four stage process. The stages in this process are business metrics, business kpi, business dashboard.
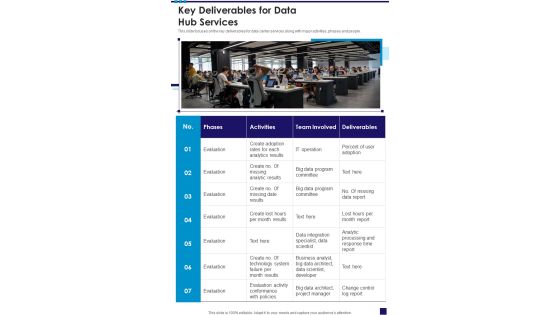
Key Deliverables For Data Hub Services One Pager Sample Example Document
This slide focuses on the key deliverables for data center services along with major activities, phases and people. Presenting you an exemplary Key Deliverables For Data Hub Services One Pager Sample Example Document. Our one pager comprises all the must have essentials of an inclusive document. You can edit it with ease, as its layout is completely editable. With such freedom, you can tweak its design and other elements to your requirements. Download this Key Deliverables For Data Hub Services One Pager Sample Example Document brilliant piece now.

Key Deliverables For Data Center Services Contractor Bid Proposal One Pager Sample Example Document
This slide focuses on the key deliverables for data center services along with major activities, phases and people. Presenting you an exemplary Key Deliverables For Data Center Services Contractor Bid Proposal One Pager Sample Example Document. Our one-pager comprises all the must-have essentials of an inclusive document. You can edit it with ease, as its layout is completely editable. With such freedom, you can tweak its design and other elements to your requirements. Download this Key Deliverables For Data Center Services Contractor Bid Proposal One Pager Sample Example Document brilliant piece now.
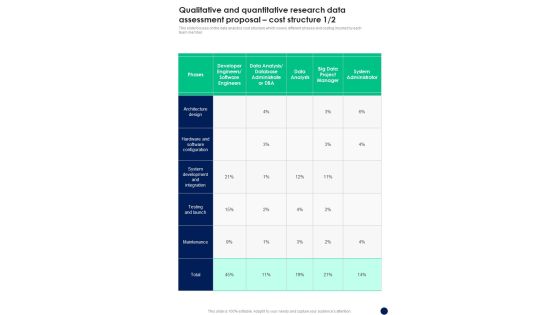
Qualitative And Quantitative Research Data Assessment Proposal Cost Structure One Pager Sample Example Document
This slide focuses on the data analytics cost structure which covers different phases and costing incurred by each team member. Presenting you an exemplary Qualitative And Quantitative Research Data Assessment Proposal Cost Structure One Pager Sample Example Document. Our one pager comprises all the must have essentials of an inclusive document. You can edit it with ease, as its layout is completely editable. With such freedom, you can tweak its design and other elements to your requirements. Download this Qualitative And Quantitative Research Data Assessment Proposal Cost Structure One Pager Sample Example Document brilliant piece now.

Improving Business Procedures Enterprise Resource Planning System Formulating Timeline For Data Migration Topics PDF
The following slide showcases the six important phases of data migration to ensure easy and secure transfer of data. It mainly includes activities such as drafting checklist, conducting trial, highlighting improvements, defining impact, deploying and monitoring etc. The best PPT templates are a great way to save time, energy, and resources. Slidegeeks have 100 percent editable powerpoint slides making them incredibly versatile. With these quality presentation templates, you can create a captivating and memorable presentation by combining visually appealing slides and effectively communicating your message. Download Improving Business Procedures Enterprise Resource Planning System Formulating Timeline For Data Migration Topics PDF from Slidegeeks and deliver a wonderful presentation.
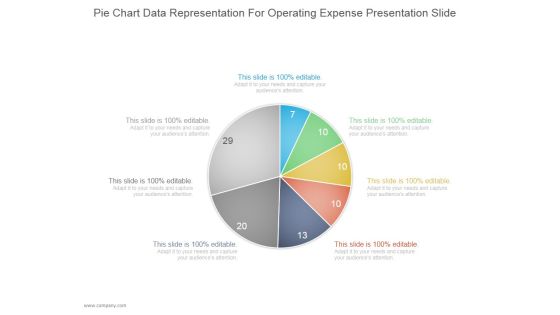
Pie Chart Data Representation For Operating Expense Ppt PowerPoint Presentation Deck
This is a pie chart data representation for operating expense ppt powerpoint presentation deck. This is a seven stage process. The stages in this process are business, strategy, marketing, pie chart, management.

Information Transformation Process Toolkit Data Analytics Change Management Gantt Chart Inspiration PDF
The slide shows the timeline for assessing and implementing the change in data analytics project. Presenting Information Transformation Process Toolkit Data Analytics Change Management Gantt Chart Inspiration PDF to provide visual cues and insights. Share and navigate important information on one stages that need your due attention. This template can be used to pitch topics like Design Documentation, Environment, Implement. In addtion, this PPT design contains high resolution images, graphics, etc, that are easily editable and available for immediate download.

Information Technology Operations Administration With ML Data Collection And Analysis Microsoft PDF
The following slide shows the artificial intelligence process of data collection and Analysis, the provided diagram shows the historical and real time data interpretation through machine learning. Want to ace your presentation in front of a live audience Our Information Technology Operations Administration With ML Data Collection And Analysis Microsoft PDF can help you do that by engaging all the users towards you. Slidegeeks experts have put their efforts and expertise into creating these impeccable powerpoint presentations so that you can communicate your ideas clearly. Moreover, all the templates are customizable, and easy to edit and downloadable. Use these for both personal and commercial use.

Business Intelligence And Big Employee Training Plan For Data Analytics Program Themes PDF
This slide shows the cross training employee assessment chart based on the key skill levels with respective responsibilities. Deliver an awe inspiring pitch with this creative business intelligence and big employee training plan for data analytics program themes pdf bundle. Topics like skill, responsibilities, process, employee, data visualization can be discussed with this completely editable template. It is available for immediate download depending on the needs and requirements of the user.
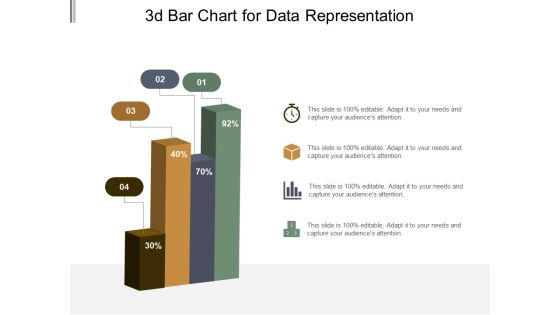
3D Bar Chart For Data Representation Ppt PowerPoint Presentation Model Graphic Tips
This is a 3d bar chart for data representation ppt powerpoint presentation model graphic tips. This is a four stage process. The stages in this process are art, colouring, paint brush.
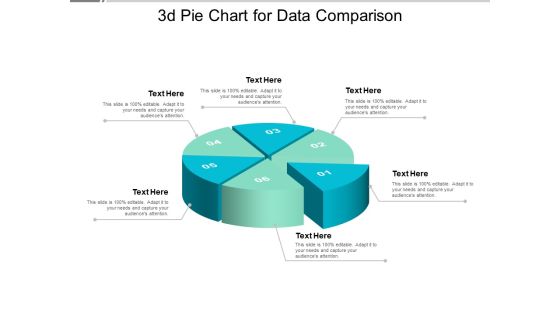
3D Pie Chart For Data Comparison Ppt PowerPoint Presentation Model Design Ideas
This is a 3d pie chart for data comparison ppt powerpoint presentation model design ideas. This is a six stage process. The stages in this process are art, colouring, paint brush.

Billing Process Flow Chart Receive Bill Data Adjust Invoices Ppt Powerpoint Presentation Pictures Introduction
This is a billing process flow chart receive bill data adjust invoices ppt powerpoint presentation pictures introduction. This is a eight stage process. The stages in this process are billing process, billing procedure, billing cycle.
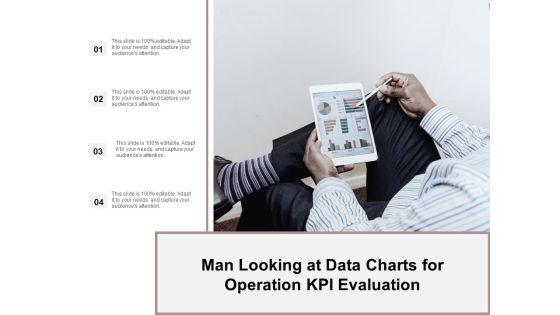
Man Looking At Data Charts For Operation Kpi Evaluation Ppt Powerpoint Presentation Ideas Demonstration
This is a man looking at data charts for operation kpi evaluation ppt powerpoint presentation ideas demonstration. This is a four stage process. The stages in this process are business metrics, business kpi, business dashboard.

Visual Data Presentation With Bar Chart Ppt PowerPoint Presentation Portfolio Brochure
This is a visual data presentation with bar chart ppt powerpoint presentation portfolio brochure. This is a four stage process. The stages in this process are visual aids, communication, business.

Branches For Visualization Research And Development Google Charts Tool For Data Elements PDF
This slide depicts google charts as the tool for data visualization, which can extract data from various sources, including SQL, databases, google sheets. Do you have an important presentation coming up Are you looking for something that will make your presentation stand out from the rest Look no further than Branches For Visualization Research And Development Google Charts Tool For Data Elements PDF. With our professional designs, you can trust that your presentation will pop and make delivering it a smooth process. And with Slidegeeks, you can trust that your presentation will be unique and memorable. So why wait Grab Branches For Visualization Research And Development Google Charts Tool For Data Elements PDF today and make your presentation stand out from the rest.
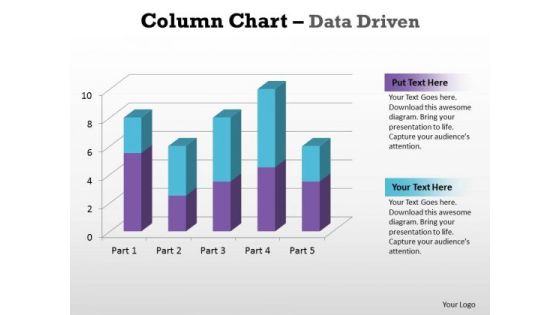
Business Graphic PowerPoint Templates Business Column Chart Data Driven Ppt Slides
Business Graphic PowerPoint Templates Business column chart data driven PPT Slides-With help of visual aids like this template you can capture the attention of the audience and make the presentation very interactive and lively.-Business Graphic PowerPoint Templates Business column chart data driven PPT Slides-This ppt can be used for concepts relating to-chart,, graph, growth, investment, , market, percentage, , presentation report, results, statistics, stock, success and business.

Real Time Data Processing With Metrics And Tools Ppt Styles Topics PDF
This slide focuses on real time data management which covers inputs, suppliers, participants, tools, consumers, metrics and primary deliverables such as data policies, standards, resolved problems, service management, etc. Persuade your audience using this Real Time Data Processing With Metrics And Tools Ppt Styles Topics PDF. This PPT design covers one stages, thus making it a great tool to use. It also caters to a variety of topics including Suppliers, Participants, Metrics, Consumers, Primary Deliverables. Download this PPT design now to present a convincing pitch that not only emphasizes the topic but also showcases your presentation skills.

Consumer Lead Generation Process Data Cleansing Process Flow For Duplicate Leads Professional PDF
This slide covers the data cleansing workflow. It includes steps such as initiating contact through lead channel, receiving lead data in system, reassigning lead to appropriate owner, managing lead through defined process, etc. There are so many reasons you need a Consumer Lead Generation Process Data Cleansing Process Flow For Duplicate Leads Professional PDF. The first reason is you cant spend time making everything from scratch, Thus, Slidegeeks has made presentation templates for you too. You can easily download these templates from our website easily.
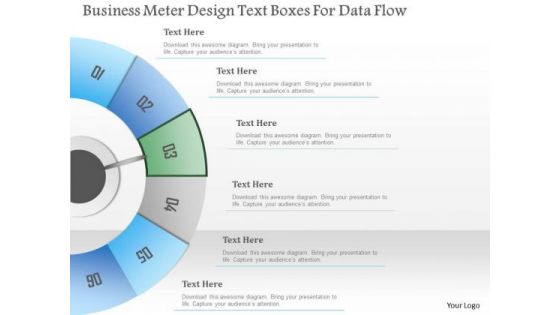
Busines Diagram Business Meter Design Text Boxes For Data Flow Presentation Template
Concept of data flow can be well defined with this exclusive business diagram. This slide contains the diagram of six steps in semi-circle. Use this professional diagram to impress your viewers.

Business Diagram Four Staged Flag Diagram For Data Representation PowerPoint Template
Four staged flag diagram has been used to craft this power point template. This PPT diagram contains the concept of business agenda and data representation. Use this PPT for business and marketing related presentations.

Project Management Gantt Chart For Data Analysis Project Proposal One Pager Sample Example Document
Presenting you an exemplary Project Management Gantt Chart For Data Analysis Project Proposal One Pager Sample Example Document. Our one-pager comprises all the must-have essentials of an inclusive document. You can edit it with ease, as its layout is completely editable. With such freedom, you can tweak its design and other elements to your requirements. Download this Project Management Gantt Chart For Data Analysis Project Proposal One Pager Sample Example Document brilliant piece now.
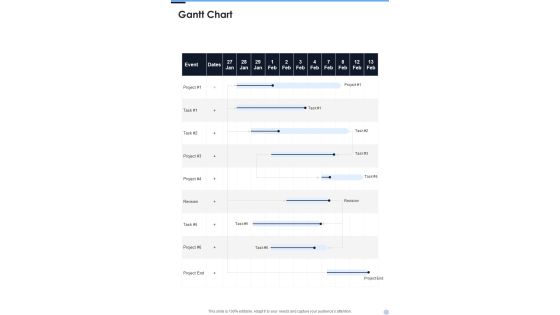
Gantt Chart Proposal For Data Analysis In Research Project One Pager Sample Example Document
Presenting you an exemplary Gantt Chart Proposal For Data Analysis In Research Project One Pager Sample Example Document. Our one-pager comprises all the must-have essentials of an inclusive document. You can edit it with ease, as its layout is completely editable. With such freedom, you can tweak its design and other elements to your requirements. Download this Gantt Chart Proposal For Data Analysis In Research Project One Pager Sample Example Document brilliant piece now.
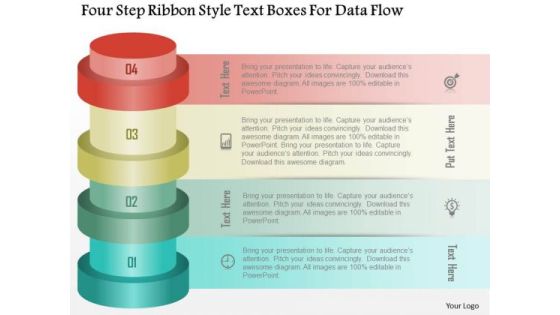
Business Diagram Four Step Ribbon Style Text Boxes For Data Flow PowerPoint Template
Four step ribbon style text boxes are used to craft this power point template. This PPT contains the concept of data flow and representation. Use this PPT diagram for your business and marketing related presentations.

C Language Data Types Flow Chart Ppt PowerPoint Presentation File Slide Portrait PDF
Persuade your audience using this c language data types flow chart ppt powerpoint presentation file slide portrait pdf. This PPT design covers six stages, thus making it a great tool to use. It also caters to a variety of topics including c language data types flow chart. Download this PPT design now to present a convincing pitch that not only emphasizes the topic but also showcases your presentation skills.

Comprehensive Customer Data Platform Guide Optimizing Promotional Initiatives Build CDP Architecture Unified Themes PDF
The following slide showcases customer data platform architecture to develop customer brand relationships. It includes elements such as customer lifecycle stages, channels, assessment and visualization, data sources etc. Find highly impressive Comprehensive Customer Data Platform Guide Optimizing Promotional Initiatives Build CDP Architecture Unified Themes PDF on Slidegeeks to deliver a meaningful presentation. You can save an ample amount of time using these presentation templates. No need to worry to prepare everything from scratch because Slidegeeks experts have already done a huge research and work for you. You need to download Comprehensive Customer Data Platform Guide Optimizing Promotional Initiatives Build CDP Architecture Unified Themes PDF for your upcoming presentation. All the presentation templates are 100 percent editable and you can change the color and personalize the content accordingly. Download now.

30 60 90 Days Plan For Implementing Data Lineage Themes PDF
This slide depicts the 30 60 90 days plan for implementing data lineage in the organization, including the steps to be taken such as finding key business drivers, onboarding senior management on the project, scoping the project, defining the scope and so on.Presenting this PowerPoint presentation, titled 30 60 90 Days Plan For Implementing Data Lineage Themes PDF, with topics curated by our researchers after extensive research. This editable presentation is available for immediate download and provides attractive features when used. Download now and captivate your audience. Presenting this 30 60 90 Days Plan For Implementing Data Lineage Themes PDF. Our researchers have carefully researched and created these slides with all aspects taken into consideration. This is a completely customizable 30 60 90 Days Plan For Implementing Data Lineage Themes PDF that is available for immediate downloading. Download now and make an impact on your audience. Highlight the attractive features available with our PPTs.

Customer Relationship Management Dashboard With Industry Operations Data Statistics Pictures PDF
This slide illustrates graphical representation of statistical data of sales operation. It includes sales pipeline, closed operations, open operations, operations by closing date etc. Pitch your topic with ease and precision using this Customer Relationship Management Dashboard With Industry Operations Data Statistics Pictures PDF. This layout presents information on Sales Pipeline, Insurance, Telecommunic. It is also available for immediate download and adjustment. So, changes can be made in the color, design, graphics or any other component to create a unique layout.
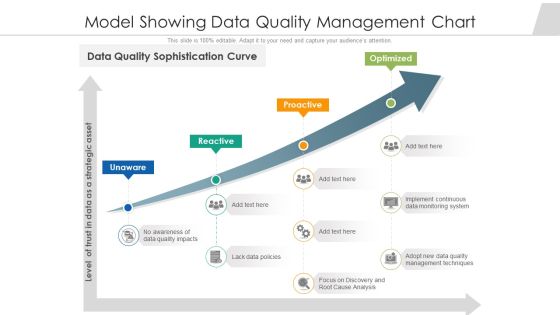
Model Showing Data Quality Management Chart Ppt PowerPoint Presentation Show Slide Download PDF
Persuade your audience using this model showing data quality management chart ppt powerpoint presentation show slide download pdf. This PPT design covers four stages, thus making it a great tool to use. It also caters to a variety of topics including implement continuous data monitoring system, management techniques, strategic asset. Download this PPT design now to present a convincing pitch that not only emphasizes the topic but also showcases your presentation skills.
Table Of Contents For Administered Data And Analytic Quality Playbook Themes PDF
Presenting Table Of Contents For Administered Data And Analytic Quality Playbook Themes PDF to provide visual cues and insights. Share and navigate important information on one stags that need your due attention. This template can be used to pitch topics like Automated Data, Analysis Powered, Solutions Barriers In addtion, this PPT design contains high resolution images, graphics, etc, that are easily editable and available for immediate download.
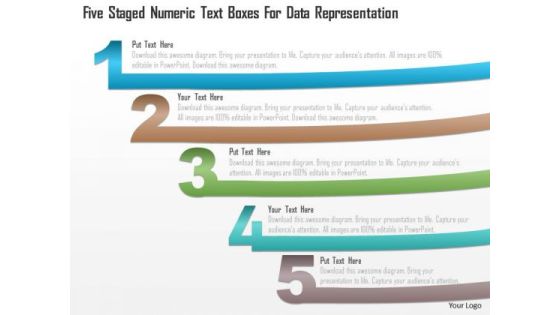
Business Diagram Five Staged Numeric Text Boxes For Data Representation PowerPoint Template
Five staged numeric text boxes diagram has been used to design this power point template. This diagram template contains the concept of data representation. Use this PPT for your business and marketing related presentations.

Business Potential Customer Data Assessment Chart Ppt PowerPoint Presentation Gallery Brochure PDF
Presenting business potential customer data assessment chart ppt powerpoint presentation gallery brochure pdf to provide visual cues and insights. Share and navigate important information on four stages that need your due attention. This template can be used to pitch topics like match data, potential and analysis, summary and actions. In addtion, this PPT design contains high resolution images, graphics, etc, that are easily editable and available for immediate download.
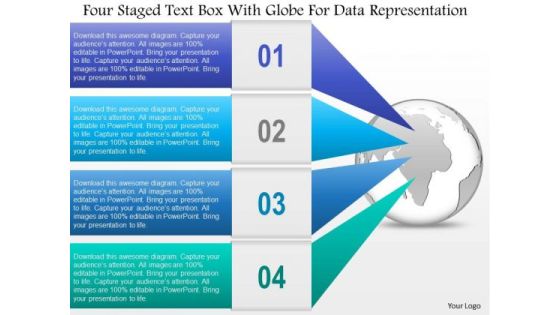
Business Diagram Four Staged Text Box With Globe For Data Representation Ppt Template
Four staged text boxes with globe has been used to craft this power point template. This PPT diagram contains the concept of global business agenda and data representation. Use this PPT for business and marketing related presentations.
Business Diagram Human Hand With Credit Card Text Boxes For Data Representation Ppt Template
This power point template has been crafted with graphic of human hand and credit card style text boxes. his PPT diagram contains the concept of data representation. This PPT is suitable for your business and marketing presentations.

Blockchain Security Solutions Deployment How Blockchain Prevents Fraud And Data Theft Themes PDF
This slide describes the different methods used by blockchain technology to prevent data from fraud and stealing. The purpose of this slide is to showcase the various techniques and technologies used in blockchain technology to prevent fraud and data theft. Get a simple yet stunning designed Blockchain Security Solutions Deployment How Blockchain Prevents Fraud And Data Theft Themes PDF. It is the best one to establish the tone in your meetings. It is an excellent way to make your presentations highly effective. So, download this PPT today from Slidegeeks and see the positive impacts. Our easy-to-edit Blockchain Security Solutions Deployment How Blockchain Prevents Fraud And Data Theft Themes PDF can be your go-to option for all upcoming conferences and meetings. So, what are you waiting for Grab this template today.

Data Process Planning Flow Chart On White Board Ppt PowerPoint Presentation Professional Aids PDF
Persuade your audience using this data process planning flow chart on white board ppt powerpoint presentation professional aids pdf. This PPT design covers three stages, thus making it a great tool to use. It also caters to a variety of topics including data process planning flow chart on white board. Download this PPT design now to present a convincing pitch that not only emphasizes the topic but also showcases your presentation skills.

Gantt Chart For Data Hub Services Proposal One Pager Sample Example Document
Presenting you an exemplary Gantt Chart For Data Hub Services Proposal One Pager Sample Example Document. Our one pager comprises all the must have essentials of an inclusive document. You can edit it with ease, as its layout is completely editable. With such freedom, you can tweak its design and other elements to your requirements. Download this Gantt Chart For Data Hub Services Proposal One Pager Sample Example Document brilliant piece now.
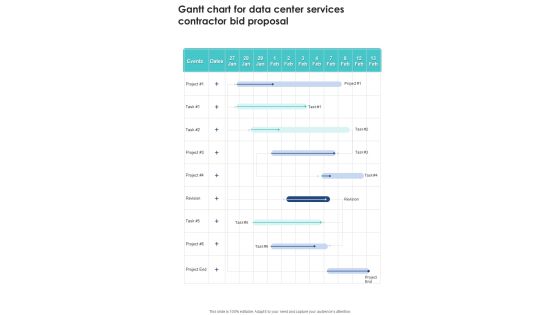
Gantt Chart For Data Center Services Contractor Bid Proposal One Pager Sample Example Document
Presenting you an exemplary Gantt Chart For Data Center Services Contractor Bid Proposal One Pager Sample Example Document. Our one-pager comprises all the must-have essentials of an inclusive document. You can edit it with ease, as its layout is completely editable. With such freedom, you can tweak its design and other elements to your requirements. Download this Gantt Chart For Data Center Services Contractor Bid Proposal One Pager Sample Example Document brilliant piece now.
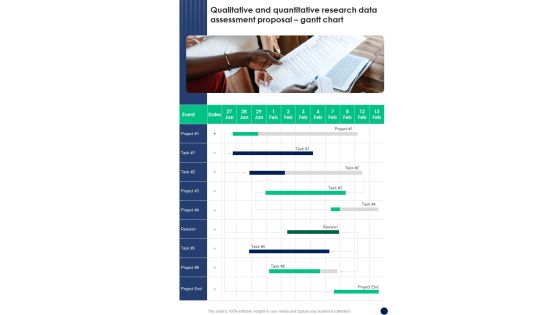
Qualitative And Quantitative Research Data Assessment Proposal Gantt Chart One Pager Sample Example Document
Presenting you an exemplary Qualitative And Quantitative Research Data Assessment Proposal Gantt Chart One Pager Sample Example Document. Our one pager comprises all the must have essentials of an inclusive document. You can edit it with ease, as its layout is completely editable. With such freedom, you can tweak its design and other elements to your requirements. Download this Qualitative And Quantitative Research Data Assessment Proposal Gantt Chart One Pager Sample Example Document brilliant piece now.

Top 10 Revolutionary Solutions For Everything Generative AI Architecture Data Preprocessing Layer Elements PDF
This slide provides information regarding data preprocessing layer associated with generative AI architecture. This layer comprises of several phases such as data collection phase, data preparation phase and feature extraction phase. This modern and well arranged Top 10 Revolutionary Solutions For Everything Generative AI Architecture Data Preprocessing Layer Elements PDF provides lots of creative possibilities. It is very simple to customize and edit with the Powerpoint Software. Just drag and drop your pictures into the shapes. All facets of this template can be edited with Powerpoint no extra software is necessary. Add your own material, put your images in the places assigned for them, adjust the colors, and then you can show your slides to the world, with an animated slide included.

Business Diagram Tip Of Iceberg Big Data Problems And Analysis Ppt Slide
This PowerPoint template has been designed with graphic of iceberg diagram. This diagram slide depicts concept of big data problem and analysis Download this diagram to create professional presentations.
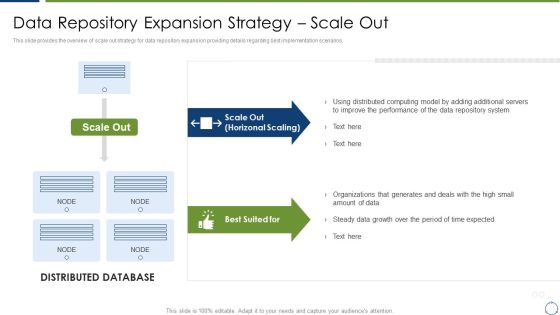
Horizontal Scaling Technique For Information Data Repository Expansion Strategy Scale Out Themes PDF
This slide provides the overview of scale out strategy for data repository expansion providing details regarding best implementation scenarios.Deliver and pitch your topic in the best possible manner with this Horizontal Scaling Technique For Information Data Repository Expansion Strategy Scale Out Themes PDF Use them to share invaluable insights on Distributed Computing, Improve The Performance, Repository System and impress your audience. This template can be altered and modified as per your expectations. So, grab it now.

Information Science What Is Data Science Ppt PowerPoint Presentation Inspiration Themes PDF
This slide represents the meaning of data science and how this innovation is helpful in businesses developing AI systems to perform tasks.Deliver an awe inspiring pitch with this creative Information Science What Is Data Science Ppt PowerPoint Presentation Inspiration Themes PDF bundle. Topics like Machine Learning, Scientific Methods, Aptitude Programming can be discussed with this completely editable template. It is available for immediate download depending on the needs and requirements of the user.
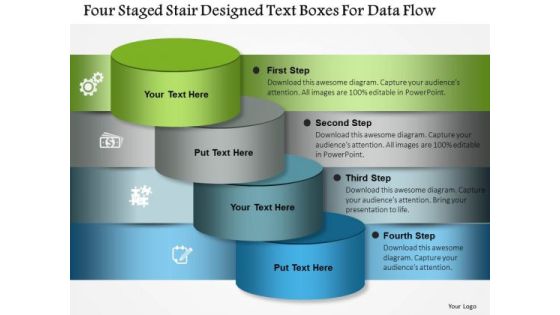
Business Diagram Four Staged Stair Designed Text Boxes For Data Flow Presentation Template
Four staged stair designed text boxes are used to design this power point template. This PPT contains the concept of data flow. Use this PPT for your business and finance related presentations.
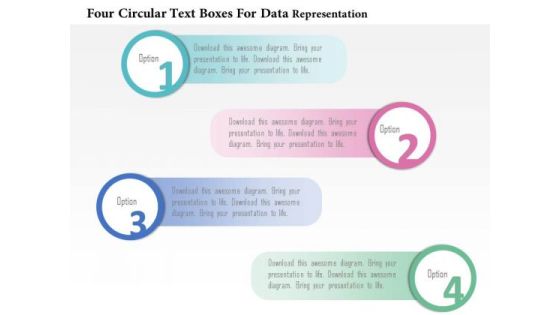
Business Diagram Four Circular Text Boxes For Data Representation PowerPoint Template
Graphic of four circular text boxes are used to craft this power point template. This PPT contains the concept of data representation. This PPT is suitable for business and marketing related presentations.
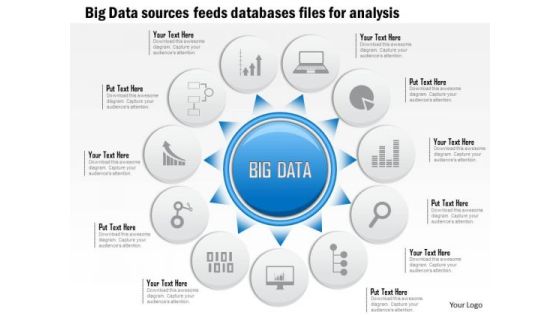
Business Diagram Big Data Sources Sensors Feeds Databases Files For Analysis Ppt Slide
This slide has been designed with graphic of circular source diagram. This diagram contains the concept of data source sensors and feeds of database files. Download this editable slide to build an exclusive presentation for your viewers.

Big Data Insight For Time Spent Analysis Over Internet Diagram Slides
This is a big data insight for time spent analysis over internet diagram slides. This is a one stage process. The stages in this process are social networking, online shopping, multimedia sites, searches, reading content, emails communication.
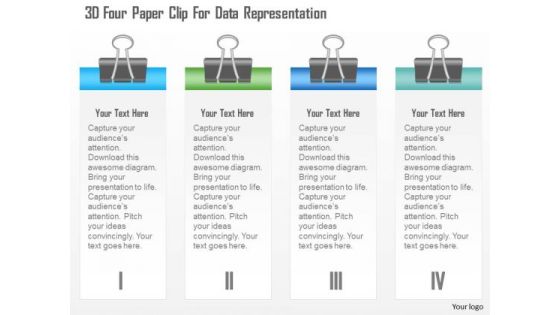
Busines Diagram 3d Four Paper Clip For Data Representation Presentation Template
This business diagram displays 3d paper clips with four text boxes. This editable text boxes diagram can be used for data representation. Use this slide to make professional presentations.

Business Diagram 3 Vs Of Big Data Showing Challenges And Complexity Of Analysis Ppt Slide
Explain the complexity and analysis with this unique PowerPoint template. This technology diagram contains the graphic of three V's to display data complexity. Use this diagram to make professional presentations.

Data Exchange Level Of Iot And AI Devices In Technological Smart Homes Download PDF
This side showcase the exchange of data between levels of smart home to analyze data of user and use it to forecast and predict future events. It includes the levels such as device level, network level, cloud level and application level. Presenting Data Exchange Level Of Iot And AI Devices In Technological Smart Homes Download PDF to dispense important information. This template comprises four stages. It also presents valuable insights into the topics including Device Level, Network Level, Cloud Level. This is a completely customizable PowerPoint theme that can be put to use immediately. So, download it and address the topic impactfully.

Data Constraints Information Limitation And Mitigation Strategies For Organization Development Mockup PDF
This slide covers the risk mitigation strategies for the data stored digitally. The purpose of this template is to analyze the problems faced during information storage. It also includes elements such as results, evaluation, etc.Presenting Data Constraints Information Limitation And Mitigation Strategies For Organization Development Mockup PDF to dispense important information. This template comprises five stages. It also presents valuable insights into the topics including Outsourcing Data, Technology Should, Biometric Information. This is a completely customizable PowerPoint theme that can be put to use immediately. So, download it and address the topic impactfully.

Aiops Integration Summary Report Data Collection And Analysis In Aiops Slides PDF
The following slide shows the artificial intelligence process of data collection and analysis, the provided diagram shows the historical and real time data interpretation through machine learning. Want to ace your presentation in front of a live audience Our Aiops Integration Summary Report Data Collection And Analysis In Aiops Slides PDF can help you do that by engaging all the users towards you. Slidegeeks experts have put their efforts and expertise into creating these impeccable powerpoint presentations so that you can communicate your ideas clearly. Moreover, all the templates are customizable, and easy to edit and downloadable. Use these for both personal and commercial use.

AI Deployment In IT Process Data Collection And Analysis In Aiops Introduction PDF
The following slide shows the artificial intelligence process of data collection and Analysis, the provided diagram shows the historical and real time data interpretation through machine learning. The best PPT templates are a great way to save time, energy, and resources. Slidegeeks have 100 percent editable powerpoint slides making them incredibly versatile. With these quality presentation templates, you can create a captivating and memorable presentation by combining visually appealing slides and effectively communicating your message. Download AI Deployment In IT Process Data Collection And Analysis In Aiops Introduction PDF from Slidegeeks and deliver a wonderful presentation.

Assessment And Workflow Key Factors Driving Data Center Relocation Themes PDF
This slide shows the major factors or drivers due to which the company is looking for data center relocation. The drivers for data center relocation are increasing performance capabilities, taking advantage of geographical proximity, reduction in capital expenses and improved energy efficiency. Crafting an eye-catching presentation has never been more straightforward. Let your presentation shine with this tasteful yet straightforward Assessment And Workflow Key Factors Driving Data Center Relocation Themes PDF template. It offers a minimalistic and classy look that is great for making a statement. The colors have been employed intelligently to add a bit of playfulness while still remaining professional. Construct the ideal Assessment And Workflow Key Factors Driving Data Center Relocation Themes PDF that effortlessly grabs the attention of your audience Begin now and be certain to wow your customers.
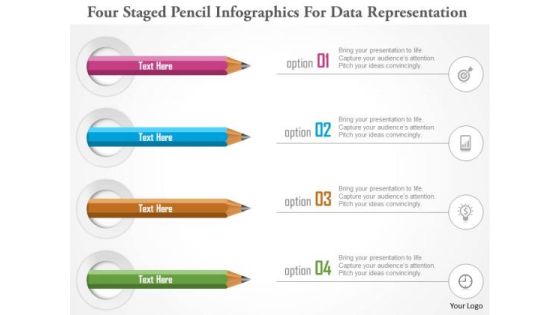
Business Diagram Four Staged Pencil Infographics For Data Representation PowerPoint Template
Four staged pencil info graphics has been used to design this power point template. This diagram template contains the concept of data representations. Use this PPT for your business and marketing presentations.

 Home
Home