AI PPT Maker
Templates
PPT Bundles
Design Services
Business PPTs
Business Plan
Management
Strategy
Introduction PPT
Roadmap
Self Introduction
Timelines
Process
Marketing
Agenda
Technology
Medical
Startup Business Plan
Cyber Security
Dashboards
SWOT
Proposals
Education
Pitch Deck
Digital Marketing
KPIs
Project Management
Product Management
Artificial Intelligence
Target Market
Communication
Supply Chain
Google Slides
Research Services
 One Pagers
All Categories
-
Home
- Customer Favorites
- Data Icon
Data Icon

Product Performance Highlights With Key Growth Drivers Ppt Pictures Design Templates PDF
This graph or chart is linked to excel, and changes automatically based on data. Just left click on it and select Edit Data. Pitch your topic with ease and precision using this Product Performance Highlights With Key Growth Drivers Ppt Pictures Design Templates PDF. This layout presents information on Product Performance, Key Growth, Projected Growth. It is also available for immediate download and adjustment. So, changes can be made in the color, design, graphics or any other component to create a unique layout.

Client Helpline Dashboard Performance Key Metrics Ppt Outline Deck PDF
This graph or chart is linked to excel, and changes automatically based on data. Just left click on it and select Edit Data. Pitch your topic with ease and precision using this Client Helpline Dashboard Performance Key Metrics Ppt Outline Deck PDF. This layout presents information on Key Metrics, Trend, Compare. It is also available for immediate download and adjustment. So, changes can be made in the color, design, graphics or any other component to create a unique layout.

Client Helpline Dashboard With Product Customer Satisfaction Ppt Slides Graphics Template PDF
This graph or chart is linked to excel, and changes automatically based on data. Just left click on it and select Edit Data. Pitch your topic with ease and precision using this Client Helpline Dashboard With Product Customer Satisfaction Ppt Slides Graphics Template PDF. This layout presents information on Customer Satisfaction, Product, Compare. It is also available for immediate download and adjustment. So, changes can be made in the color, design, graphics or any other component to create a unique layout.

Client Helpline Dashboard With Ticket Resolution Ppt Model Graphics Design PDF
This graph or chart is linked to excel, and changes automatically based on data. Just left click on it and select Edit Data. Pitch your topic with ease and precision using this Client Helpline Dashboard With Ticket Resolution Ppt Model Graphics Design PDF. This layout presents information on Ticket Due Times, Sourcewise Tickets, Open Tickets. It is also available for immediate download and adjustment. So, changes can be made in the color, design, graphics or any other component to create a unique layout.
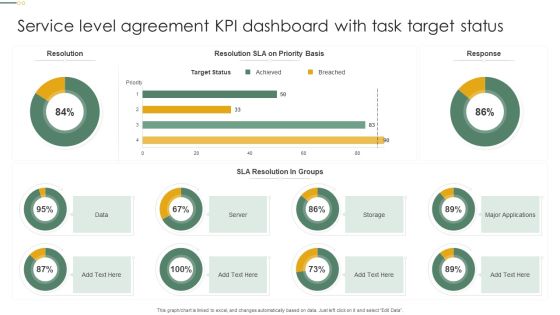
Service Level Agreement KPI Dashboard With Task Target Status Microsoft PDF
This graph or chart is linked to excel, and changes automatically based on data. Just left click on it and select Edit Data. Pitch your topic with ease and precision using this Service Level Agreement KPI Dashboard With Task Target Status Microsoft PDF. This layout presents information on Target Status, Sla Resolution, Groups, Server. It is also available for immediate download and adjustment. So, changes can be made in the color, design, graphics or any other component to create a unique layout.

Company Group Members Demographics Dashboard Overview Clipart PDF
This graph or chart is linked to excel, and changes automatically based on data. Just left click on it and select Edit Data. Pitch your topic with ease and precision using this Company Group Members Demographics Dashboard Overview Clipart PDF. This layout presents information on Headcount Office, Headcount Tenure Range, Headcount Age Range. It is also available for immediate download and adjustment. So, changes can be made in the color, design, graphics or any other component to create a unique layout.

Service SLA KPL Changes And Incidents Dashboard Ppt Inspiration Infographics PDF
This graph or chart is linked to excel, and changes automatically based on data. Just left click on it and select Edit Data. Pitch your topic with ease and precision using this Service SLA KPL Changes And Incidents Dashboard Ppt Inspiration Infographics PDF. This layout presents information on Time Spent Department, Incidents Closed, Operator Group. It is also available for immediate download and adjustment. So, changes can be made in the color, design, graphics or any other component to create a unique layout.

SLA KPL Overview Dashboard Depicting Service Targets Ppt Slides Maker PDF
This graph or chart is linked to excel, and changes automatically based on data. Just left click on it and select Edit Data. Pitch your topic with ease and precision using this SLA KPL Overview Dashboard Depicting Service Targets Ppt Slides Maker PDF. This layout presents information on Monthly Trend, Service Target, Quarterly Trend. It is also available for immediate download and adjustment. So, changes can be made in the color, design, graphics or any other component to create a unique layout.

Doughnut Graph Depicting ROI From Multiple Marketing Activities Rules PDF
This graph or chart is linked to excel, and changes automatically based on data. Just left click on it and select Edit Data. Pitch your topic with ease and precision using this Doughnut Graph Depicting ROI From Multiple Marketing Activities Rules PDF. This layout presents information on Total ROI, Field Campaigns, Print Media, Display Ads. It is also available for immediate download and adjustment. So, changes can be made in the color, design, graphics or any other component to create a unique layout.

Doughnut Graph With Online Employee Recruitment Via Multiple Portals Mockup PDF
This graph or chart is linked to excel, and changes automatically based on data. Just left click on it and select Edit Data. Pitch your topic with ease and precision using this Doughnut Graph With Online Employee Recruitment Via Multiple Portals Mockup PDF. This layout presents information on ABC Employment, Multiple Portals, 2020 To 2022. It is also available for immediate download and adjustment. So, changes can be made in the color, design, graphics or any other component to create a unique layout.
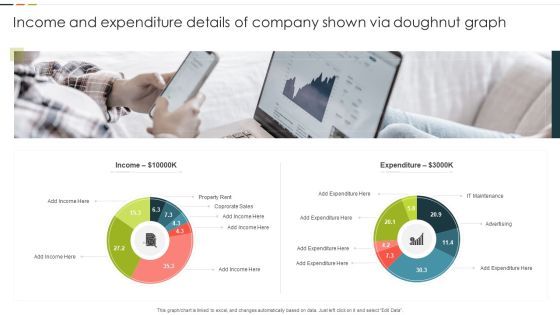
Income And Expenditure Details Of Company Shown Via Doughnut Graph Graphics PDF
This graph or chart is linked to excel, and changes automatically based on data. Just left click on it and select Edit Data. Pitch your topic with ease and precision using this Income And Expenditure Details Of Company Shown Via Doughnut Graph Graphics PDF. This layout presents information on Property Rent, Corporate Sales, Expenditure. It is also available for immediate download and adjustment. So, changes can be made in the color, design, graphics or any other component to create a unique layout.

Kanban Structure For Product Quality Assurance Ppt Portfolio Deck PDF
This graph or chart is linked to excel, and changes automatically based on data. Just left click on it and select Edit Data. Pitch your topic with ease and precision using this Kanban Structure For Product Quality Assurance Ppt Portfolio Deck PDF. This layout presents information on Product Deployment, Quality Assurance, Product, Designing And Development. It is also available for immediate download and adjustment. So, changes can be made in the color, design, graphics or any other component to create a unique layout.
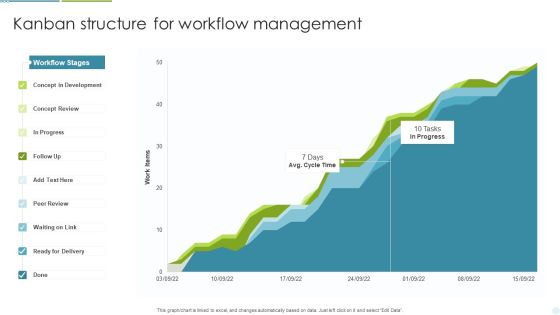
Kanban Structure For Workflow Management Ppt Inspiration Template PDF
This graph or chart is linked to excel, and changes automatically based on data. Just left click on it and select Edit Data. Pitch your topic with ease and precision using this Kanban Structure For Workflow Management Ppt Inspiration Template PDF. This layout presents information on Concept Development, Concept Review, Ready For Delivery. It is also available for immediate download and adjustment. So, changes can be made in the color, design, graphics or any other component to create a unique layout.

Kanban Structure To Manage Weekly Work Activities Ppt Professional Aids PDF
This graph or chart is linked to excel, and changes automatically based on data. Just left click on it and select Edit Data. Pitch your topic with ease and precision using this Kanban Structure To Manage Weekly Work Activities Ppt Professional Aids PDF. This layout presents information on Legend, Ready To Start, In Progress. It is also available for immediate download and adjustment. So, changes can be made in the color, design, graphics or any other component to create a unique layout.

Human Capital Metrics For New Hire Ppt Pictures Brochure PDF
This graph or chart is linked to excel, and changes automatically based on data. Just left click on it and select Edit Data. Pitch your topic with ease and precision using this Human Capital Metrics For New Hire Ppt Pictures Brochure PDF. This layout presents information on Active Employee Count, New Hire Count, New Hire. It is also available for immediate download and adjustment. So, changes can be made in the color, design, graphics or any other component to create a unique layout.

Human Capital Metrics With Absenteeism Rate Ppt Infographic Template Ideas PDF
This graph or chart is linked to excel, and changes automatically based on data. Just left click on it and select Edit Data. Pitch your topic with ease and precision using this Human Capital Metrics With Absenteeism Rate Ppt Infographic Template Ideas PDF. This layout presents information on Overall Labor Effectiveness, OLE Department, Absenteeism. It is also available for immediate download and adjustment. So, changes can be made in the color, design, graphics or any other component to create a unique layout.
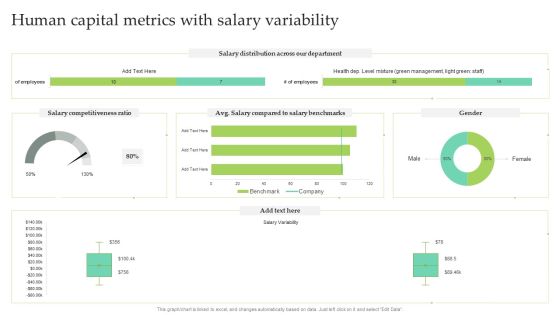
Human Capital Metrics With Salary Variability Ppt Infographic Template Designs PDF
This graph or chart is linked to excel, and changes automatically based on data. Just left click on it and select Edit Data. Pitch your topic with ease and precision using this Human Capital Metrics With Salary Variability Ppt Infographic Template Designs PDF. This layout presents information on Salary Distribution, Salary Competitiveness Ratio, Male. It is also available for immediate download and adjustment. So, changes can be made in the color, design, graphics or any other component to create a unique layout.
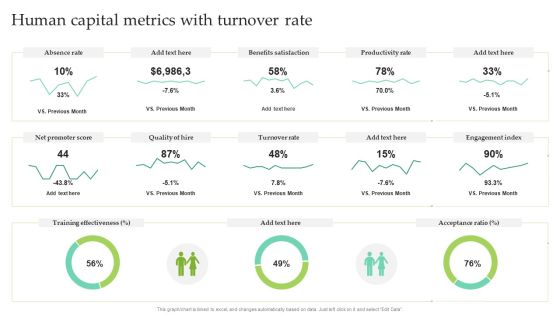
Human Capital Metrics With Turnover Rate Ppt Pictures Outline PDF
This graph or chart is linked to excel, and changes automatically based on data. Just left click on it and select Edit Data. Pitch your topic with ease and precision using this Human Capital Metrics With Turnover Rate Ppt Pictures Outline PDF. This layout presents information on Absence Rate, Benefits Satisfaction, Productivity Rate. It is also available for immediate download and adjustment. So, changes can be made in the color, design, graphics or any other component to create a unique layout.

Marketing Plan Implementation Target Market Size And Growth Ppt File Model PDF
This graph or chart is linked to excel, and changes automatically based on data. Just left click on it and select Edit Data. Deliver an awe-inspiring pitch with this creative marketing plan implementation target market size and growth ppt file model pdf bundle. Topics like target market size and growth can be discussed with this completely editable template. It is available for immediate download depending on the needs and requirements of the user.
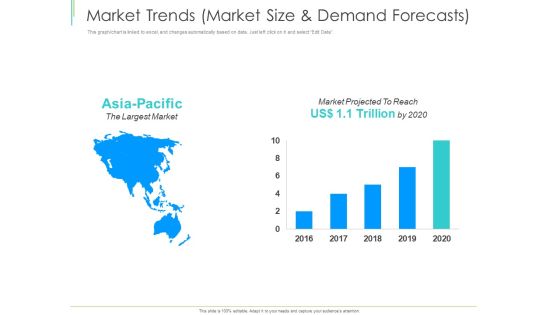
Marketing Plan Implementation Market Trends Market Size And Demand Forecasts Topics PDF
This graph or chart is linked to excel, and changes automatically based on data. Just left click on it and select Edit Data. Deliver an awe-inspiring pitch with this creative marketing plan implementation market trends market size and demand forecasts topics pdf bundle. Topics like market trends, market size and demand forecasts can be discussed with this completely editable template. It is available for immediate download depending on the needs and requirements of the user.
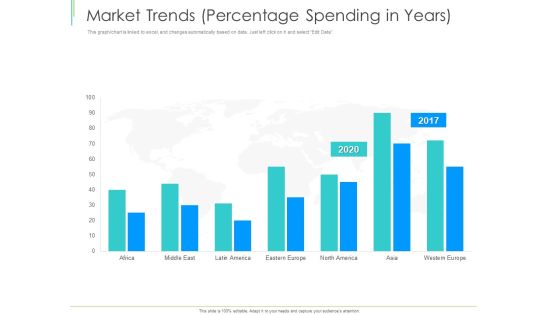
Marketing Plan Implementation Market Trends Percentage Spending In Years Demonstration PDF
This graph or chart is linked to excel, and changes automatically based on data. Just left click on it and select Edit Data. Deliver an awe-inspiring pitch with this creative marketing plan implementation market trends percentage spending in years demonstration pdf bundle. Topics like market trends, percentage spending in years can be discussed with this completely editable template. It is available for immediate download depending on the needs and requirements of the user.

Customer Relationship Management Procedure Customer Retention Benefits Introduction PDF
This graph chart is linked to excel, and changes automatically based on data. Just left click on it and select Edit Data. Deliver an awe inspiring pitch with this creative customer relationship management procedure customer retention benefits introduction pdf bundle. Topics like customer retention benefits, profits, costs can be discussed with this completely editable template. It is available for immediate download depending on the needs and requirements of the user.
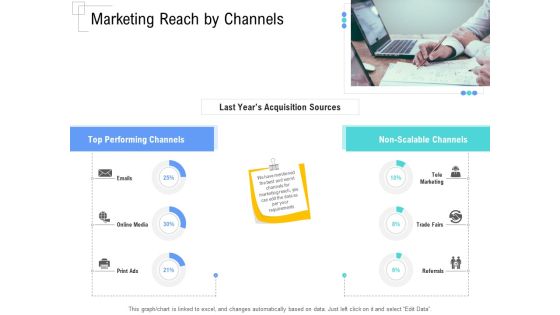
Managing Customer Experience Marketing Reach By Channels Elements PDF
This graph or chart is linked to excel, and changes automatically based on data. Just left click on it and select Edit Data.Deliver and pitch your topic in the best possible manner with this managing customer experience marketing reach by channels elements pdf. Use them to share invaluable insights on last years acquisition sources, top performing channels, non scalable channels and impress your audience. This template can be altered and modified as per your expectations. So, grab it now.

Enterprise Tactical Planning Equipment Rental Leasing Purchase Machine Brochure PDF
This graph or chart is linked to excel, and changes automatically based on data. Just left click on it and select Edit Data. Deliver an awe-inspiring pitch with this creative enterprise tactical planning equipment rental leasing purchase machine brochure pdf bundle. Topics like equipment rental, leasing, purchase can be discussed with this completely editable template. It is available for immediate download depending on the needs and requirements of the user.
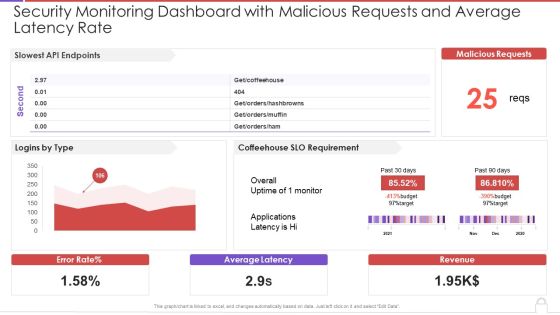
Security Monitoring Dashboard With Malicious Requests And Average Latency Rate Topics PDF
This graph or chart is linked to excel, and changes automatically based on data. Just left click on it and select Edit Data. Deliver an awe inspiring pitch with this creative security monitoring dashboard with malicious requests and average latency rate topics pdf bundle. Topics like slowest api endpoints, malicious requests, coffeehouse slo can be discussed with this completely editable template. It is available for immediate download depending on the needs and requirements of the user.

Supplier Scorecard Retail Compliance Scorecards For Supplier With Damage Free Deliveries Status Sample PDF
This graph or chart is linked to excel, and changes automatically based on data. Just left click on it and select Edit Data. Deliver and pitch your topic in the best possible manner with this supplier scorecard retail compliance scorecards for supplier with damage free deliveries status sample pdf. Use them to share invaluable insights on damage free deliveries, arrival reporting, departure reporting and impress your audience. This template can be altered and modified as per your expectations. So, grab it now.

Supplier Scorecard Retail Compliance Scorecards For Supplier With Delivery Precision Clipart PDF
This graph or chart is linked to excel, and changes automatically based on data. Just left click on it and select Edit Data. Deliver an awe inspiring pitch with this creative supplier scorecard retail compliance scorecards for supplier with delivery precision clipart pdf bundle. Topics like pick up precision, delivery precision, lead time precision can be discussed with this completely editable template. It is available for immediate download depending on the needs and requirements of the user.

Supplier Scorecard Retail Supplier Scorecard For Evaluating Risk Compliance Clipart PDF
This graph or chart is linked to excel, and changes automatically based on data. Just left click on it and select Edit Data. Deliver and pitch your topic in the best possible manner with this supplier scorecard retail supplier scorecard for evaluating risk compliance clipart pdf. Use them to share invaluable insights on risk summary, risk category, vendors evaluated, low, medium, high and impress your audience. This template can be altered and modified as per your expectations. So, grab it now.
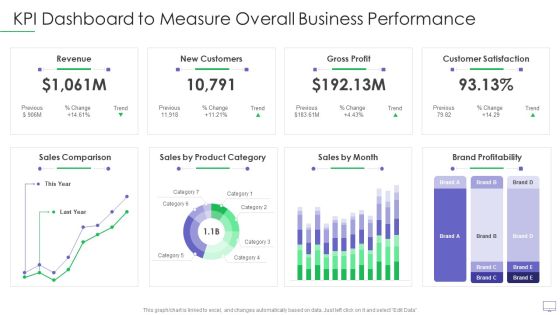
Guide For Software Developers KPI Dashboard To Measure Overall Business Performance Elements PDF
This graph or chart is linked to excel, and changes automatically based on data. Just left click on it and select Edit Data. Deliver an awe inspiring pitch with this creative guide for software developers kpi dashboard to measure overall business performance elements pdf bundle. Topics like revenue new customers, gross profit, customer satisfaction, sales comparison, brand profitability can be discussed with this completely editable template. It is available for immediate download depending on the needs and requirements of the user.
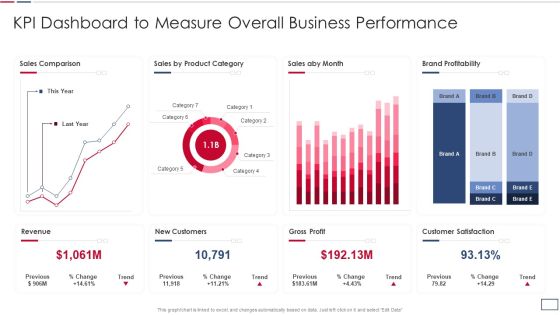
Software Developer Playbook Kpi Dashboard To Measure Overall Business Performance Topics PDF
This graph or chart is linked to excel, and changes automatically based on data. Just left click on it and select Edit Data. Deliver and pitch your topic in the best possible manner with this software developer playbook kpi dashboard to measure overall business performance topics pdf. Use them to share invaluable insights on revenue new customers, gross profit, customer satisfaction, sales comparison and impress your audience. This template can be altered and modified as per your expectations. So, grab it now.

Consumer Retention Techniques Patient Satisfaction Measurement Dashboard Rules PDF
This graph or chart is linked to excel, and changes automatically based on data. Just left click on it and select Edit Data. Deliver and pitch your topic in the best possible manner with this consumer retention techniques patient satisfaction measurement dashboard rules pdf. Use them to share invaluable insights on average waiting times, lab test turnaround, patient satisfaction, patient falls and impress your audience. This template can be altered and modified as per your expectations. So, grab it now.
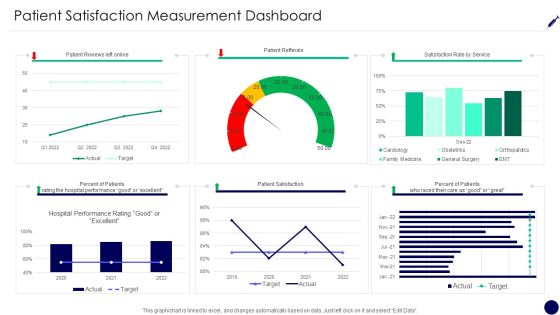
Patient Satisfaction Measurement Dashboard Consumer Retention Techniques Summary PDF
This graph or chart is linked to excel, and changes automatically based on data. Just left click on it and select Edit Data. Deliver and pitch your topic in the best possible manner with this patient satisfaction measurement dashboard consumer retention techniques summary pdf. Use them to share invaluable insights on patient reviews left online, patient refferals, satisfaction rate service, percent patients and impress your audience. This template can be altered and modified as per your expectations. So, grab it now.

Promotion Campaign Scorecard With Conversion Rate Ppt Inspiration Graphics PDF
This graph or chart is linked to excel, and changes automatically based on data. Just left click on it and select Edit Data. Deliver an awe inspiring pitch with this creative promotion campaign scorecard with conversion rate ppt inspiration graphics pdf bundle. Topics like ctr by campaign, conversions by campaign, impressions by date, conversion value vs target, spent by campaign can be discussed with this completely editable template. It is available for immediate download depending on the needs and requirements of the user.

Promotion Scorecard With Total Traffic And Conversions Ppt Pictures Clipart Images PDF
This graph or chart is linked to excel, and changes automatically based on data. Just left click on it and select Edit Data. Deliver an awe inspiring pitch with this creative promotion scorecard with total traffic and conversions ppt pictures clipart images pdf bundle. Topics likeunique victors monthly trend, unique victors monthly trend, marketing mix can be discussed with this completely editable template. It is available for immediate download depending on the needs and requirements of the user.

Promotion Scorecard With Traffic Sources And Leads Funnel Ppt Layouts Background PDF
This graph or chart is linked to excel, and changes automatically based on data. Just left click on it and select Edit Data. Deliver and pitch your topic in the best possible manner with this promotion scorecard with traffic sources and leads funnel ppt layouts background pdf. Use them to share invaluable insights on lead month, lead funnel, dollar, traffic sources and impress your audience. This template can be altered and modified as per your expectations. So, grab it now.
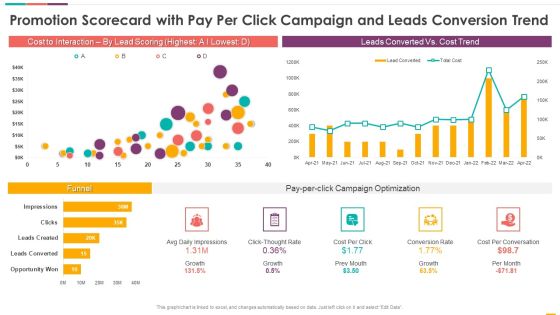
Promotion Scorecard With Pay Per Click Campaign And Leads Conversion Trend Topics PDF
This graph or chart is linked to excel, and changes automatically based on data. Just left click on it and select Edit Data. Deliver an awe inspiring pitch with this creative promotion scorecard with pay per click campaign and leads conversion trend topics pdf bundle. Topics like cost to interaction, by lead scoring, leads converted vs cost trend, funnel can be discussed with this completely editable template. It is available for immediate download depending on the needs and requirements of the user.
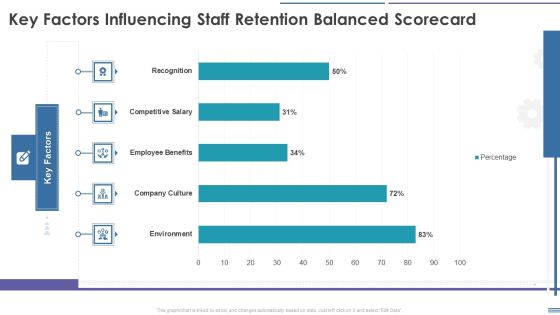
Staff Retention Balanced Scorecard Key Factors Influencing Staff Retention Balanced Scorecard Download PDF
This graph or chart is linked to excel, and changes automatically based on data. Just left click on it and select Edit Data. Deliver an awe inspiring pitch with this creative Staff Retention Balanced Scorecard Key Factors Influencing Staff Retention Balanced Scorecard Download PDF bundle. Topics like Environment, Company Culture, Employee Benefits, Competitive Salary can be discussed with this completely editable template. It is available for immediate download depending on the needs and requirements of the user.
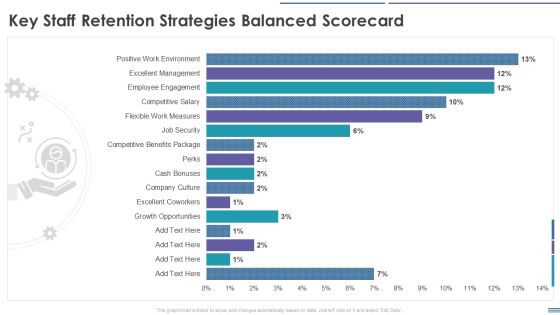
Staff Retention Balanced Scorecard Key Staff Retention Strategies Balanced Scorecard Rules PDF
This graph or chart is linked to excel, and changes automatically based on data. Just left click on it and select Edit Data. Deliver and pitch your topic in the best possible manner with this Staff Retention Balanced Scorecard Key Staff Retention Strategies Balanced Scorecard Rules PDF. Use them to share invaluable insights on Growth Opportunities, Excellent Coworkers, Company Culture, Excellent Management and impress your audience. This template can be altered and modified as per your expectations. So, grab it now.
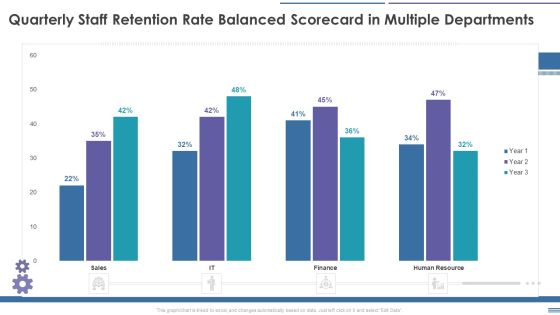
Staff Retention Balanced Scorecard Quarterly Staff Retention Rate Balanced Scorecard In Multiple Formats PDF
This graph or chart is linked to excel, and changes automatically based on data. Just left click on it and select Edit Data. Deliver an awe inspiring pitch with this creative Staff Retention Balanced Scorecard Quarterly Staff Retention Rate Balanced Scorecard In Multiple Formats PDF bundle. Topics like Staff Retention, Balanced Scorecard, Quarterly Staff Retention, Rate Balanced Scorecard can be discussed with this completely editable template. It is available for immediate download depending on the needs and requirements of the user.
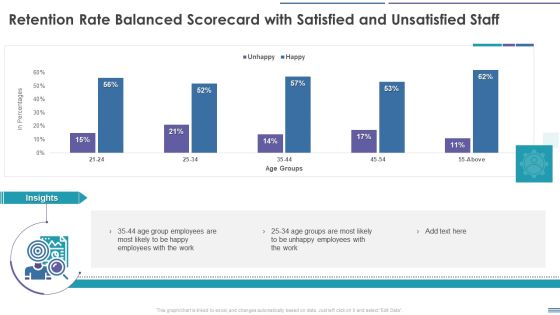
Staff Retention Balanced Scorecard Retention Rate Balanced Scorecard With Satisfied And Unsatisfied Summary PDF
This graph or chart is linked to excel, and changes automatically based on data. Just left click on it and select Edit Data. Deliver an awe inspiring pitch with this creative Staff Retention Balanced Scorecard Retention Rate Balanced Scorecard With Satisfied And Unsatisfied Summary PDF bundle. Topics like Employee, Retention Rate Balanced Scorecard, Satisfied And Unsatisfied Staff can be discussed with this completely editable template. It is available for immediate download depending on the needs and requirements of the user.
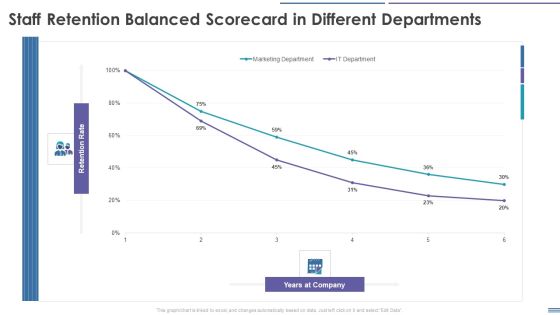
Staff Retention Balanced Scorecard Staff Retention Balanced Scorecard In Different Departments Template PDF
This graph or chart is linked to excel, and changes automatically based on data. Just left click on it and select Edit Data. Deliver and pitch your topic in the best possible manner with this Staff Retention Balanced Scorecard Staff Retention Balanced Scorecard In Different Departments Template PDF. Use them to share invaluable insights on Marketing Department, IT Department and impress your audience. This template can be altered and modified as per your expectations. So, grab it now.
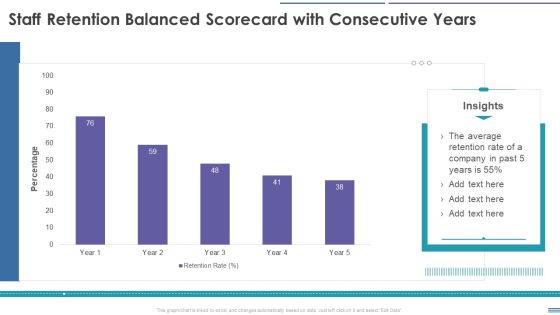
Staff Retention Balanced Scorecard Staff Retention Balanced Scorecard With Consecutive Years Download PDF
This graph or chart is linked to excel, and changes automatically based on data. Just left click on it and select Edit Data. Deliver an awe inspiring pitch with this creative Staff Retention Balanced Scorecard Staff Retention Balanced Scorecard With Consecutive Years Download PDF bundle. Topics like Retention Rate, Percentage can be discussed with this completely editable template. It is available for immediate download depending on the needs and requirements of the user.
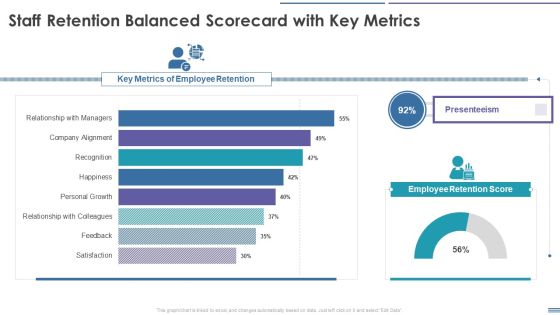
Staff Retention Balanced Scorecard Staff Retention Balanced Scorecard With Key Metrics Demonstration PDF
This graph or chart is linked to excel, and changes automatically based on data. Just left click on it and select Edit Data. Deliver and pitch your topic in the best possible manner with this Staff Retention Balanced Scorecard Staff Retention Balanced Scorecard With Key Metrics Demonstration PDF. Use them to share invaluable insights on Key Metrics Of Employee Retention, Presenteeism, Employee Retention Score and impress your audience. This template can be altered and modified as per your expectations. So, grab it now.

Auto Sales Profit Scorecard For Two And Four Wheeler Vehicles Inspiration PDF
This graph or chart is linked to excel, and changes automatically based on data. Just left click on it and select Edit Data. Deliver an awe inspiring pitch with this creative Auto Sales Profit Scorecard For Two And Four Wheeler Vehicles Inspiration PDF bundle. Topics like Two Wheeler Vehicles, Four Wheeler Vehicles, Six Wheeler Vehicles can be discussed with this completely editable template. It is available for immediate download depending on the needs and requirements of the user.

Auto Sales Revenues Scorecard Of Multiple Countries Inspiration PDF
This graph or chart is linked to excel, and changes automatically based on data. Just left click on it and select Edit Data. Deliver an awe inspiring pitch with this creative Auto Sales Revenues Scorecard Of Multiple Countries Inspiration PDF bundle. Topics like Auto Sales Revenues, Scorecard Multiple Countries can be discussed with this completely editable template. It is available for immediate download depending on the needs and requirements of the user.

Auto Sales Scorecard Bar Graph For Regional Performance Comparison Infographics PDF
This graph or chart is linked to excel, and changes automatically based on data. Just left click on it and select Edit Data. Deliver an awe inspiring pitch with this creative Auto Sales Scorecard Bar Graph For Regional Performance Comparison Infographics PDF bundle. Topics like Auto Sales Scorecard, Bar Graph Regional, Performance Comparison Product can be discussed with this completely editable template. It is available for immediate download depending on the needs and requirements of the user.

Auto Sales Scorecard For Petrol Vs Diesel Vehicles Template PDF
This graph or chart is linked to excel, and changes automatically based on data. Just left click on it and select Edit Data. Deliver an awe inspiring pitch with this creative Auto Sales Scorecard For Petrol Vs Diesel Vehicles Template PDF bundle. Topics like Top Products Revenue, Petrol Vs Diesel, Vehicles Incremental Sales, Marketing Activities Product can be discussed with this completely editable template. It is available for immediate download depending on the needs and requirements of the user.

Auto Sales Weekly Performance Assessment Scorecard Background PDF
This graph or chart is linked to excel, and changes automatically based on data. Just left click on it and select Edit Data. Deliver and pitch your topic in the best possible manner with this Auto Sales Weekly Performance Assessment Scorecard Background PDF. Use them to share invaluable insights on Auto Sales Weekly, Performance Assessment Scorecard and impress your audience. This template can be altered and modified as per your expectations. So, grab it now.

Automobile Sales Scorecard Competitor Assessment Scorecard For Auto Sales Demonstration PDF
This graph or chart is linked to excel, and changes automatically based on data. Just left click on it and select Edit Data. Deliver an awe inspiring pitch with this creative Automobile Sales Scorecard Competitor Assessment Scorecard For Auto Sales Demonstration PDF bundle. Topics like Competitor Assessment Scorecard, Auto Sales Product can be discussed with this completely editable template. It is available for immediate download depending on the needs and requirements of the user.

Automobile Sales Scorecard Quarterly Scorecard For 3 Categories Auto Sales Microsoft PDF
This graph or chart is linked to excel, and changes automatically based on data. Just left click on it and select Edit Data. Deliver an awe inspiring pitch with this creative Automobile Sales Scorecard Quarterly Scorecard For 3 Categories Auto Sales Microsoft PDF bundle. Topics like Quarterly Scorecard Three, Categories Auto Sales can be discussed with this completely editable template. It is available for immediate download depending on the needs and requirements of the user.
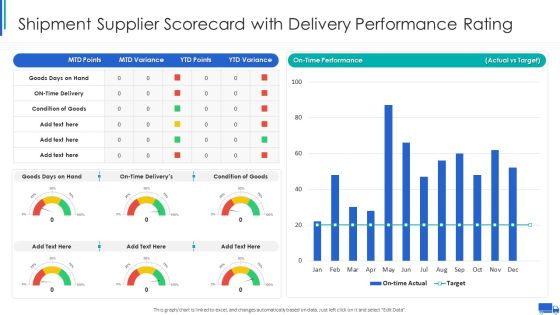
Shipment Supplier Scorecard With Delivery Performance Rating Ppt Ideas Graphic Tips PDF
This graph or chart is linked to excel, and changes automatically based on data. Just left click on it and select Edit Data. Deliver an awe inspiring pitch with this creative Shipment Supplier Scorecard With Delivery Performance Rating Ppt Ideas Graphic Tips PDF bundle. Topics like On Time Performance, Actual Vs Target, Goods Days Hand can be discussed with this completely editable template. It is available for immediate download depending on the needs and requirements of the user.
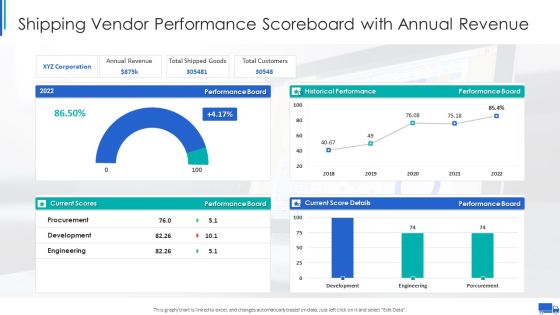
Shipping Vendor Performance Scoreboard With Annual Revenue Ppt Infographics Graphics PDF
This graph or chart is linked to excel, and changes automatically based on data. Just left click on it and select Edit Data. Deliver an awe inspiring pitch with this creative Shipping Vendor Performance Scoreboard With Annual Revenue Ppt Infographics Graphics PDF bundle. Topics like Annual Revenue Board, Total Shipped Goods, Total Customers Performance can be discussed with this completely editable template. It is available for immediate download depending on the needs and requirements of the user.

Shipping Vendor Spend Scorecard Summary In Graph Ppt Pictures Introduction PDF
This graph or chart is linked to excel, and changes automatically based on data. Just left click on it and select Edit Data. Deliver and pitch your topic in the best possible manner with this Shipping Vendor Spend Scorecard Summary In Graph Ppt Pictures Introduction PDF. Use them to share invaluable insights on Vendor Scorecard Summary, Vendor Spend Shipping, Actual Spend Vs and impress your audience. This template can be altered and modified as per your expectations. So, grab it now.
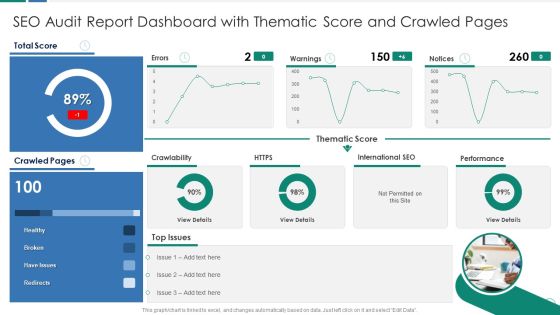
SEO Audit Report Dashboard With Thematic Score And Crawled Pages Download PDF
This graph or chart is linked to excel, and changes automatically based on data. Just left click on it and select Edit Data. Deliver and pitch your topic in the best possible manner with this SEO Audit Report Dashboard With Thematic Score And Crawled Pages Download PDF. Use them to share invaluable insights on Thematic Score Warnings, International SEO Performance, Total Score Healthy and impress your audience. This template can be altered and modified as per your expectations. So, grab it now.

IT Security Evaluation Scorecard With Bar Graph Ppt Gallery Design Templates PDF
This graph or chart is linked to excel, and changes automatically based on data. Just left click on it and select Edit Data. Deliver and pitch your topic in the best possible manner with this IT Security Evaluation Scorecard With Bar Graph Ppt Gallery Design Templates PDF. Use them to share invaluable insights on CPU Utilization Memory, Utilization Packet Loss and impress your audience. This template can be altered and modified as per your expectations. So, grab it now.
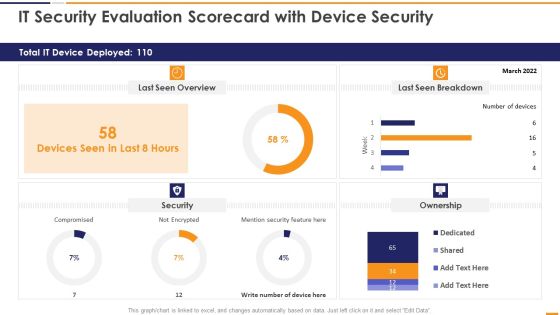
IT Security Evaluation Scorecard With Device Security Ppt Slides Good PDF
This graph or chart is linked to excel, and changes automatically based on data. Just left click on it and select Edit Data. Deliver an awe inspiring pitch with this creative IT Security Evaluation Scorecard With Device Security Ppt Slides Good PDF bundle. Topics like Total IT Device, Last Seen Overview, Last Seen Breakdown, Mention Security Feature can be discussed with this completely editable template. It is available for immediate download depending on the needs and requirements of the user.

IT Security Evaluation Scorecard With Impact Status Ppt Portfolio Guidelines PDF
This graph or chart is linked to excel, and changes automatically based on data. Just left click on it and select Edit Data. Deliver and pitch your topic in the best possible manner with this IT Security Evaluation Scorecard With Impact Status Ppt Portfolio Guidelines PDF. Use them to share invaluable insights on Device Availability Application, Performance Port Health, Devices Reference Firmware and impress your audience. This template can be altered and modified as per your expectations. So, grab it now.
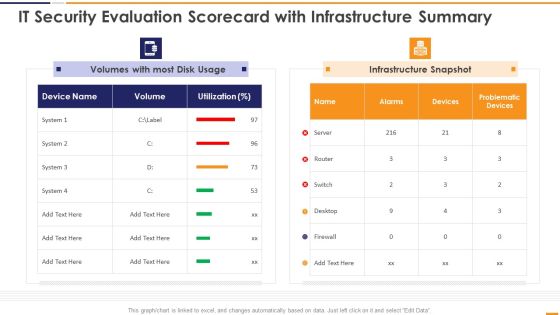
IT Security Evaluation Scorecard With Infrastructure Summary Ppt Slides Portrait PDF
This graph or chart is linked to excel, and changes automatically based on data. Just left click on it and select Edit Data. Deliver an awe inspiring pitch with this creative IT Security Evaluation Scorecard With Infrastructure Summary Ppt Slides Portrait PDF bundle. Topics like Volumes Most Disk, Usage Infrastructure Snapshot can be discussed with this completely editable template. It is available for immediate download depending on the needs and requirements of the user.

IT Security Evaluation Scorecard With Ip Availability Ppt Pictures Portrait PDF
This graph or chart is linked to excel, and changes automatically based on data. Just left click on it and select Edit Data. Deliver and pitch your topic in the best possible manner with this IT Security Evaluation Scorecard With Ip Availability Ppt Pictures Portrait PDF. Use them to share invaluable insights on Devices Memory Utilization, Interfaces Errors Discards, IP Availability Summary and impress your audience. This template can be altered and modified as per your expectations. So, grab it now.

IT Security Evaluation Scorecard With It Cost Break Down Ppt Infographics Slideshow PDF
This graph or chart is linked to excel, and changes automatically based on data. Just left click on it and select Edit Data. Deliver an awe inspiring pitch with this creative IT Security Evaluation Scorecard With It Cost Break Down Ppt Infographics Slideshow PDF bundle. Topics like Spend Vs Budget, Return On Investment, IT Department Revenue, IT Costs Vs can be discussed with this completely editable template. It is available for immediate download depending on the needs and requirements of the user.
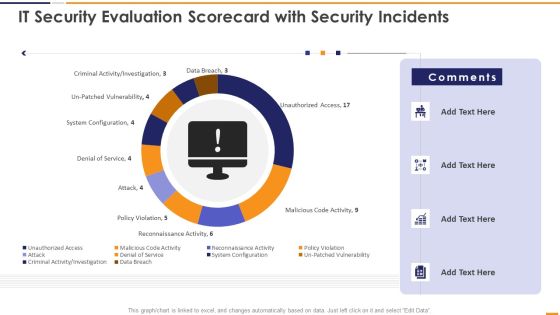
IT Security Evaluation Scorecard With Security Incidents Ppt Pictures Vector PDF
This graph or chart is linked to excel, and changes automatically based on data. Just left click on it and select Edit Data. Deliver and pitch your topic in the best possible manner with this IT Security Evaluation Scorecard With Security Incidents Ppt Pictures Vector PDF. Use them to share invaluable insights on Unauthorized Access Sales, Malicious Code Activity, Reconnaissance Activity Attack and impress your audience. This template can be altered and modified as per your expectations. So, grab it now.

IT Security Evaluation Scorecard With Server Status Ppt Professional Images PDF
This graph or chart is linked to excel, and changes automatically based on data. Just left click on it and select Edit Data. Deliver an awe inspiring pitch with this creative IT Security Evaluation Scorecard With Server Status Ppt Professional Images PDF bundle. Topics like Operations Status Tool, Management Services Managed can be discussed with this completely editable template. It is available for immediate download depending on the needs and requirements of the user.

IT Security Evaluation Scorecard With System Details Ppt Inspiration Vector PDF
This graph or chart is linked to excel, and changes automatically based on data. Just left click on it and select Edit Data. Deliver and pitch your topic in the best possible manner with this IT Security Evaluation Scorecard With System Details Ppt Inspiration Vector PDF. Use them to share invaluable insights on System Details Availability, System Metrics Memory, Pressure Memory Leak and impress your audience. This template can be altered and modified as per your expectations. So, grab it now.
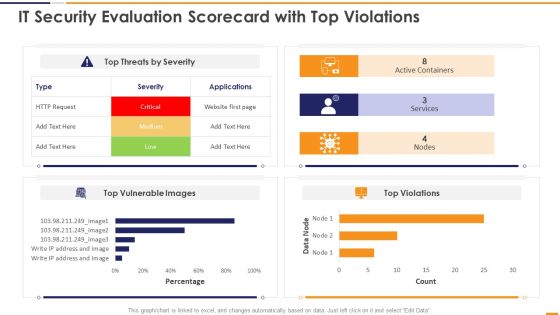
IT Security Evaluation Scorecard With Top Violations Ppt Portfolio Deck PDF
This graph or chart is linked to excel, and changes automatically based on data. Just left click on it and select Edit Data. Deliver an awe inspiring pitch with this creative IT Security Evaluation Scorecard With Top Violations Ppt Portfolio Deck PDF bundle. Topics like Top Threats Severity, Active Containers Services, Top Vulnerable Images can be discussed with this completely editable template. It is available for immediate download depending on the needs and requirements of the user.
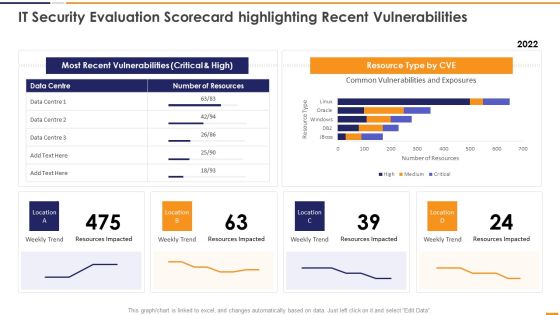
IT Security Evaluation Scorecard Highlighting Recent Vulnerabilities Introduction PDF
This graph or chart is linked to excel, and changes automatically based on data. Just left click on it and select Edit Data. Deliver an awe inspiring pitch with this creative IT Security Evaluation Scorecard Highlighting Recent Vulnerabilities Introduction PDF bundle. Topics like Most Recent Vulnerabilities, Resource Type CVE, Weekly Trend Location can be discussed with this completely editable template. It is available for immediate download depending on the needs and requirements of the user.

IT Security Evaluation Scorecard With Recent Alarms Raised By Devices Guidelines PDF
This graph or chart is linked to excel, and changes automatically based on data. Just left click on it and select Edit Data. Deliver an awe inspiring pitch with this creative IT Security Evaluation Scorecard With Recent Alarms Raised By Devices Guidelines PDF bundle. Topics like Devices CPU Utilization, Device Details Raised can be discussed with this completely editable template. It is available for immediate download depending on the needs and requirements of the user.
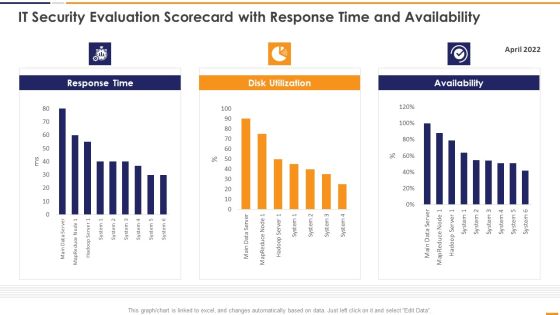
IT Security Evaluation Scorecard With Response Time And Availability Brochure PDF
This graph or chart is linked to excel, and changes automatically based on data. Just left click on it and select Edit Data. Deliver and pitch your topic in the best possible manner with this IT Security Evaluation Scorecard With Response Time And Availability Brochure PDF. Use them to share invaluable insights on Response Time 2022, Disk Utilization Availability and impress your audience. This template can be altered and modified as per your expectations. So, grab it now.

BANT Sales Lead Qualification Model Our Financial Highlights Background PDF
This graph or chart is linked to excel and change automatically based on data. Just left click on it and select Edit Data. Deliver an awe inspiring pitch with this creative BANT Sales Lead Qualification Model Our Financial Highlights Background PDF bundle. Topics like Gross Profit, Net Profit, Earnings Per can be discussed with this completely editable template. It is available for immediate download depending on the needs and requirements of the user.

BANT Sales Lead Qualification Model Our Revenue For The Future Mockup PDF
This graph or chart is linked to excel and change automatically based on data. Just left click on it and select Edit Data. Deliver an awe inspiring pitch with this creative BANT Sales Lead Qualification Model Our Revenue For The Future Mockup PDF bundle. Topics like Continues Decline, Marketing Strategy, 2017 To 2022 can be discussed with this completely editable template. It is available for immediate download depending on the needs and requirements of the user.

Openfin Capital Raising Understanding The Competitive Landscape Ppt Portfolio Layouts PDF
This graph or chart is linked to excel, and changes automatically based on data. Just left click on it and select Edit Data. Deliver and pitch your topic in the best possible manner with this Openfin Capital Raising Understanding The Competitive Landscape Ppt Portfolio Layouts PDF. Use them to share invaluable insights on Usage Application, Food Ordering, Food Blogging and impress your audience. This template can be altered and modified as per your expectations. So, grab it now.

Company Daily Sales Performance Scorecard With Target Download PDF
This graph or chart is linked to excel, and changes automatically based on data. Just left click on it and select Edit Data. Deliver an awe inspiring pitch with this creative Company Daily Sales Performance Scorecard With Target Download PDF bundle. Topics like Sales Target can be discussed with this completely editable template. It is available for immediate download depending on the needs and requirements of the user.

Company Monthly Sales Performance Scorecard With Region Sample PDF
This graph or chart is linked to excel, and changes automatically based on data. Just left click on it and select Edit Data. Deliver and pitch your topic in the best possible manner with this Company Monthly Sales Performance Scorecard With Region Sample PDF. Use them to share invaluable insights on Company Monthly, Sales Performance, Scorecard Region and impress your audience. This template can be altered and modified as per your expectations. So, grab it now.

Company Yearly Sales Performance Scorecard With Cost Breakdown Elements PDF
This graph or chart is linked to excel, and changes automatically based on data. Just left click on it and select Edit Data. Deliver an awe inspiring pitch with this creative Company Yearly Sales Performance Scorecard With Cost Breakdown Elements PDF bundle. Topics like Sales Revenue, Incremental Sales, Cost Breakdown can be discussed with this completely editable template. It is available for immediate download depending on the needs and requirements of the user.

Current Year Sales Performance Scorecard With Profits Structure PDF
This graph or chart is linked to excel, and changes automatically based on data. Just left click on it and select Edit Data. Deliver and pitch your topic in the best possible manner with this Current Year Sales Performance Scorecard With Profits Structure PDF. Use them to share invaluable insights on Current Year, YTD Sales, Previous Year and impress your audience. This template can be altered and modified as per your expectations. So, grab it now.
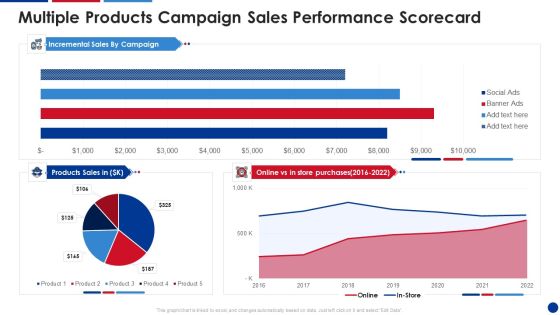
Multiple Products Campaign Sales Performance Scorecard Download PDF
This graph or chart is linked to excel, and changes automatically based on data. Just left click on it and select Edit Data. Deliver an awe inspiring pitch with this creative Multiple Products Campaign Sales Performance Scorecard Download PDF bundle. Topics like Incremental Sales, Products Sales, Store Purchases can be discussed with this completely editable template. It is available for immediate download depending on the needs and requirements of the user.

State And Product Wise Sales Performance Scorecard Summary PDF
This graph or chart is linked to excel, and changes automatically based on data. Just left click on it and select Edit Data. Deliver an awe inspiring pitch with this creative State And Product Wise Sales Performance Scorecard Summary PDF bundle. Topics like State Wise Sales, Products Sale, Region Wise Sales can be discussed with this completely editable template. It is available for immediate download depending on the needs and requirements of the user.

SEO Audit Summary To Increase SEO Audit Report Dashboard With Thematic Score Download PDF
This graph or chart is linked to excel, and changes automatically based on data. Just left click on it and select Edit Data. Deliver an awe inspiring pitch with this creative SEO Audit Summary To Increase SEO Audit Report Dashboard With Thematic Score Download PDF bundle. Topics like Total Score, Crawled Pages, Top Issues can be discussed with this completely editable template. It is available for immediate download depending on the needs and requirements of the user.
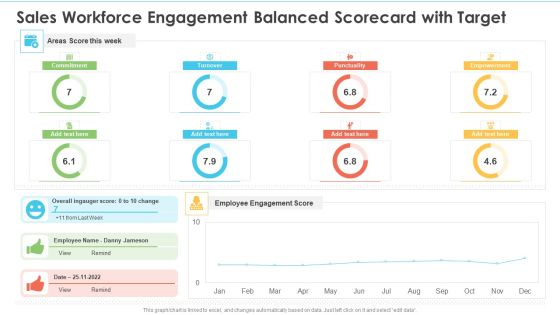
Sales Workforce Engagement Balanced Scorecard With Target Ppt Professional Designs Download PDF
This graph or chart is linked to excel, and changes automatically based on data. Just left click on it and select edit data. Deliver an awe inspiring pitch with this creative Sales Workforce Engagement Balanced Scorecard With Target Ppt Professional Designs Download PDF bundle. Topics like Areas Score Week, Employee Engagement Score, Overall Ingauger Score can be discussed with this completely editable template. It is available for immediate download depending on the needs and requirements of the user.
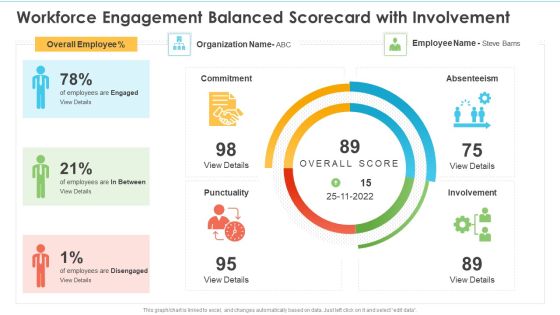
Workforce Engagement Balanced Scorecard With Involvement Ppt Portfolio Background Images PDF
This graph or chart is linked to excel, and changes automatically based on data. Just left click on it and select edit data. Deliver and pitch your topic in the best possible manner with this Workforce Engagement Balanced Scorecard With Involvement Ppt Portfolio Background Images PDF. Use them to share invaluable insights on Employee, Organization, Overall Employee and impress your audience. This template can be altered and modified as per your expectations. So, grab it now.
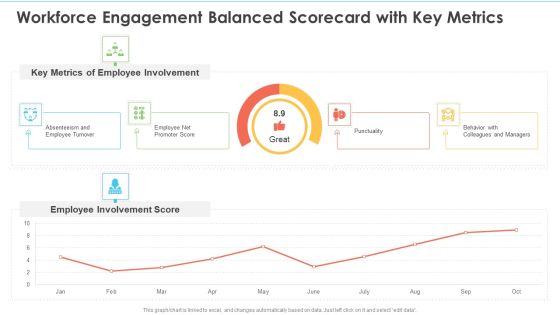
Workforce Engagement Balanced Scorecard With Key Metrics Ppt Inspiration Deck PDF
This graph or chart is linked to excel, and changes automatically based on data. Just left click on it and select edit data. Deliver an awe inspiring pitch with this creative Workforce Engagement Balanced Scorecard With Key Metrics Ppt Inspiration Deck PDF bundle. Topics like Key Metrics, Employee Involvement, Employee Involvement Score can be discussed with this completely editable template. It is available for immediate download depending on the needs and requirements of the user.
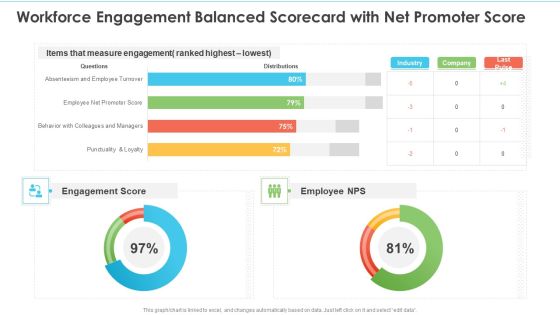
Workforce Engagement Balanced Scorecard With Net Promoter Score Ppt Slides Display PDF
This graph or chart is linked to excel, and changes automatically based on data. Just left click on it and select edit data. Deliver an awe inspiring pitch with this creative Workforce Engagement Balanced Scorecard With Net Promoter Score Ppt Slides Display PDF bundle. Topics like Measure Engagement, Engagement Score, Employee NPS can be discussed with this completely editable template. It is available for immediate download depending on the needs and requirements of the user.

Workforce Engagement Balanced Scorecard With Response Rate Ppt Deck PDF
This graph or chart is linked to excel, and changes automatically based on data. Just left click on it and select edit data. Deliver an awe inspiring pitch with this creative Workforce Engagement Balanced Scorecard With Response Rate Ppt Deck PDF bundle. Topics like Engagement Score Teams, Engagement Score Levels, Net Promoter Score can be discussed with this completely editable template. It is available for immediate download depending on the needs and requirements of the user.
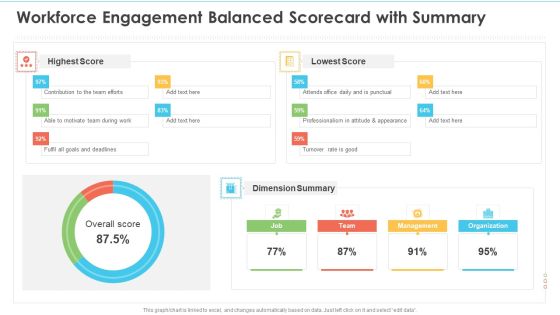
Workforce Engagement Balanced Scorecard With Summary Ppt Layouts Template PDF
This graph or chart is linked to excel, and changes automatically based on data. Just left click on it and select edit data. Deliver and pitch your topic in the best possible manner with this Workforce Engagement Balanced Scorecard With Summary Ppt Layouts Template PDF. Use them to share invaluable insights on Highest Score, Lowest Score, Dimension Summary and impress your audience. This template can be altered and modified as per your expectations. So, grab it now.

Workforce Engagement Scorecard With Net Promoter Score Ppt Portfolio Images PDF
This graph or chart is linked to excel, and changes automatically based on data. Just left click on it and select edit data. Deliver and pitch your topic in the best possible manner with this Workforce Engagement Scorecard With Net Promoter Score Ppt Portfolio Images PDF. Use them to share invaluable insights on Employee Involvement, Punctuality Involvement, Absenteeism and impress your audience. This template can be altered and modified as per your expectations. So, grab it now.

Workforce Engagement Balanced Scorecard With Loyalty Ppt Styles Good PDF
This graph or chart is linked to excel, and changes automatically based on data. Just left click on it and select edit data. Deliver an awe inspiring pitch with this creative Workforce Engagement Balanced Scorecard With Loyalty Ppt Styles Good PDF bundle. Topics like Involvement Score, Key Metrics, Employee Turnover can be discussed with this completely editable template. It is available for immediate download depending on the needs and requirements of the user.

Quarterly Resource Administration Accounting Scorecard With Average Finished Goods Value Introduction PDF
This graph or chart is linked to excel, and changes automatically based on data. Just left click on it and select Edit Data. Deliver an awe inspiring pitch with this creative Quarterly Resource Administration Accounting Scorecard With Average Finished Goods Value Introduction PDF bundle. Topics like Inventory Turns, Average WIP Value, Total Cost Goods can be discussed with this completely editable template. It is available for immediate download depending on the needs and requirements of the user.

Resource Administration Accounting Scorecard With Average Purchase Cost Structure PDF
This graph or chart is linked to excel, and changes automatically based on data. Just left click on it and select Edit Data. Deliver and pitch your topic in the best possible manner with this Resource Administration Accounting Scorecard With Average Purchase Cost Structure PDF. Use them to share invaluable insights on Stock Balance, Stock Quantity, Average Cost and impress your audience. This template can be altered and modified as per your expectations. So, grab it now.

Resource Administration Accounting Scorecard With Cost Of Purchase Order Download PDF
This graph or chart is linked to excel, and changes automatically based on data. Just left click on it and select Edit Data. Deliver an awe inspiring pitch with this creative Resource Administration Accounting Scorecard With Cost Of Purchase Order Download PDF bundle. Topics like Cost Reduction, Cost Avoidance, Procurement ROI can be discussed with this completely editable template. It is available for immediate download depending on the needs and requirements of the user.
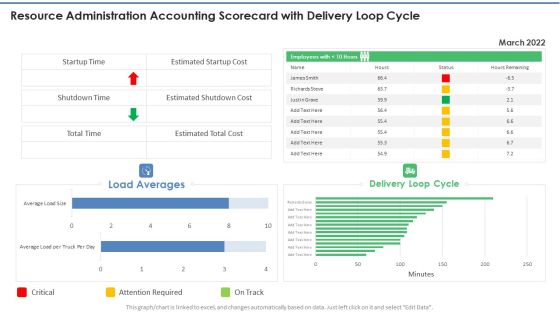
Resource Administration Accounting Scorecard With Delivery Loop Cycle Graphics PDF
This graph or chart is linked to excel, and changes automatically based on data. Just left click on it and select Edit Data. Deliver an awe inspiring pitch with this creative Resource Administration Accounting Scorecard With Delivery Loop Cycle Graphics PDF bundle. Topics like Load Averages, Delivery Loop Cycle, Attention Required can be discussed with this completely editable template. It is available for immediate download depending on the needs and requirements of the user.

Resource Administration Accounting Scorecard With Inventory Summary Designs PDF
This graph or chart is linked to excel, and changes automatically based on data. Just left click on it and select Edit Data. Deliver and pitch your topic in the best possible manner with this Resource Administration Accounting Scorecard With Inventory Summary Designs PDF. Use them to share invaluable insights on Product Details, Top Selling Item, Purchase Order and impress your audience. This template can be altered and modified as per your expectations. So, grab it now.

Resource Administration Accounting Scorecard With Inventory Turnover Microsoft PDF
This graph or chart is linked to excel, and changes automatically based on data. Just left click on it and select Edit Data. Deliver an awe inspiring pitch with this creative Resource Administration Accounting Scorecard With Inventory Turnover Microsoft PDF bundle. Topics like Inventory Turnover, Inventory Accuracy, Back Order Rate can be discussed with this completely editable template. It is available for immediate download depending on the needs and requirements of the user.
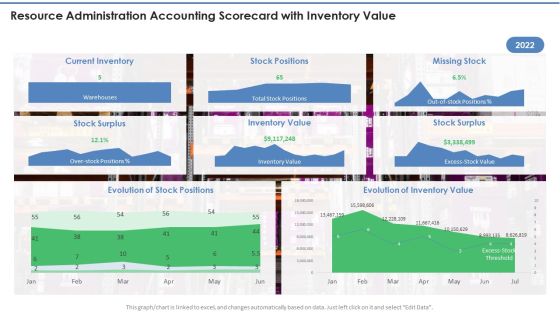
Resource Administration Accounting Scorecard With Inventory Value Infographics PDF
This graph or chart is linked to excel, and changes automatically based on data. Just left click on it and select Edit Data. Deliver and pitch your topic in the best possible manner with this Resource Administration Accounting Scorecard With Inventory Value Infographics PDF. Use them to share invaluable insights on Current Inventory, Stock Positions, Missing Stock and impress your audience. This template can be altered and modified as per your expectations. So, grab it now.
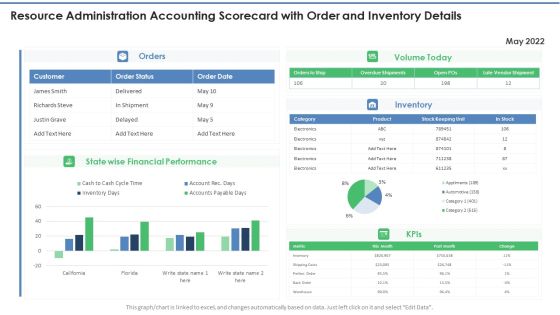
Resource Administration Accounting Scorecard With Order And Inventory Details Mockup PDF
This graph or chart is linked to excel, and changes automatically based on data. Just left click on it and select Edit Data. Deliver and pitch your topic in the best possible manner with this Resource Administration Accounting Scorecard With Order And Inventory Details Mockup PDF. Use them to share invaluable insights on Volume Today, Financial Performance, State wise and impress your audience. This template can be altered and modified as per your expectations. So, grab it now.
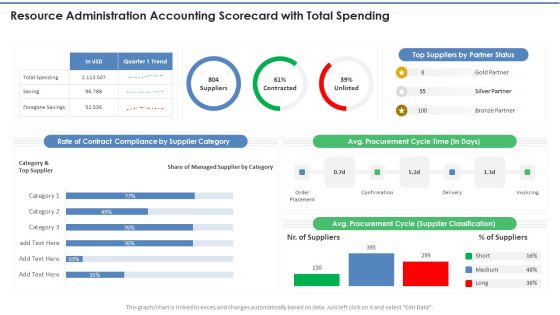
Resource Administration Accounting Scorecard With Total Spending Professional PDF
This graph or chart is linked to excel, and changes automatically based on data. Just left click on it and select Edit Data. Deliver and pitch your topic in the best possible manner with this Resource Administration Accounting Scorecard With Total Spending Professional PDF. Use them to share invaluable insights on Supplier Category, Cycle Time, Top Suppliers and impress your audience. This template can be altered and modified as per your expectations. So, grab it now.

Yearly Resource Administration Accounting Scorecard With Carrying Cost Of Inventory Slides PDF
This graph or chart is linked to excel, and changes automatically based on data. Just left click on it and select Edit Data. Deliver an awe inspiring pitch with this creative Yearly Resource Administration Accounting Scorecard With Carrying Cost Of Inventory Slides PDF bundle. Topics like Carrying Cost Inventory, Inventory Shrinkage can be discussed with this completely editable template. It is available for immediate download depending on the needs and requirements of the user.

Monthly Resource Administration Accounting Scorecard Template PDF
This graph or chart is linked to excel, and changes automatically based on data. Just left click on it and select Edit Data. Deliver and pitch your topic in the best possible manner with this Monthly Resource Administration Accounting Scorecard Template PDF. Use them to share invaluable insights on Revenue Vs Costs, Total Profit, Number Units Sold and impress your audience. This template can be altered and modified as per your expectations. So, grab it now.

Playbook For Sales Growth Strategies Digital Marketing Dashboard For Organic Growth Designs PDF
This graph or chart is linked to excel, and changes automatically based on data. Just left click on it and select Edit Data. Deliver and pitch your topic in the best possible manner with this Playbook For Sales Growth Strategies Digital Marketing Dashboard For Organic Growth Designs PDF. Use them to share invaluable insights on Unique Visitors, Sessions, Bounce Rate and impress your audience. This template can be altered and modified as per your expectations. So, grab it now.

Organization Transition Cloud Computing Service Usage Ppt PowerPoint Presentation File Outfit PDF
This graph or chart is linked to excel, and changes automatically based on data. Just left click on it and select Edit Data. Deliver an awe inspiring pitch with this creative Organization Transition Cloud Computing Service Usage Ppt PowerPoint Presentation File Outfit PDF bundle. Topics like Cloud Storage, Cloud Backup, Cloud Hosting can be discussed with this completely editable template. It is available for immediate download depending on the needs and requirements of the user.
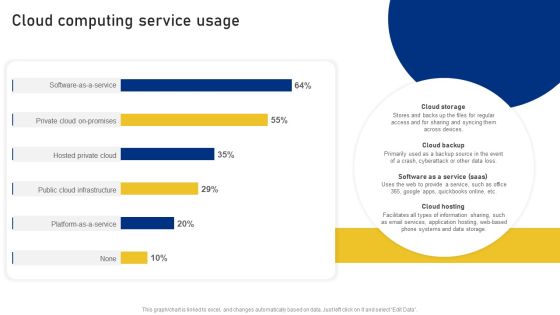
Reshaping Business In Digital Cloud Computing Service Usage Formats PDF
This graph or chart is linked to excel, and changes automatically based on data. Just left click on it and select Edit Data. Deliver an awe inspiring pitch with this creative Reshaping Business In Digital Cloud Computing Service Usage Formats PDF bundle. Topics like Private Cloud Promises, Hosted Private Cloud, Public Cloud Infrastructure can be discussed with this completely editable template. It is available for immediate download depending on the needs and requirements of the user.
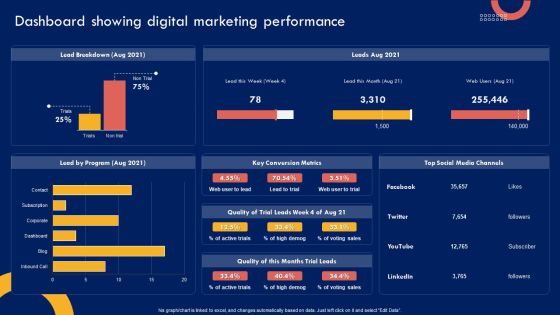
Product Marketing Leadership Dashboard Showing Digital Marketing Performance Download PDF
This graph OR chart is linked to excel, and changes automatically based on data. Just left click on it and select Edit Data. There are so many reasons you need a Product Marketing Leadership Dashboard Showing Digital Marketing Performance Download PDF. The first reason is you cant spend time making everything from scratch, Thus, Slidegeeks has made presentation templates for you too. You can easily download these templates from our website easily.

Product Marketing Leadership Product Marketing Dashboard For Pay Per Microsoft PDF
This graph or chart is linked to excel, and changes automatically based on data. Just left click on it and select Edit Data. Find a pre-designed and impeccable Product Marketing Leadership Product Marketing Dashboard For Pay Per Microsoft PDF. The templates can ace your presentation without additional effort. You can download these easy-to-edit presentation templates to make your presentation stand out from others. So, what are you waiting for Download the template from Slidegeeks today and give a unique touch to your presentation.
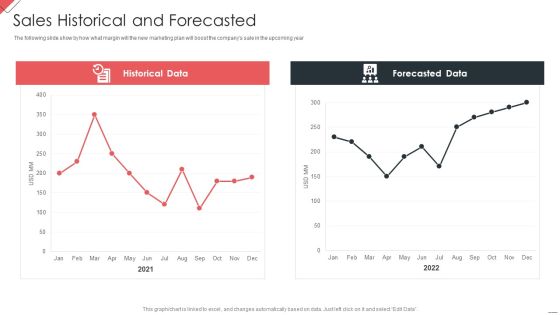
New Commodity Market Viability Review Sales Historical And Forecasted Background PDF
The following slide show by how what margin will the new marketing plan will boost the companys sale in the upcoming year Deliver and pitch your topic in the best possible manner with this New Commodity Market Viability Review Sales Historical And Forecasted Background PDF Use them to share invaluable insights on Historical Data, Forecasted Data, Historical Forecasted and impress your audience. This template can be altered and modified as per your expectations. So, grab it now.

BANT Sales Lead Qualification Model Forecasting The Sales Portrait PDF
Purpose of the following slide is to show the sales forecasting for the organization as it displays the sales for the current and forecasted year. Deliver and pitch your topic in the best possible manner with this BANT Sales Lead Qualification Model Forecasting The Sales Portrait PDF. Use them to share invaluable insights on Historical Data, Forecasted Data, 2021 To 2022 and impress your audience. This template can be altered and modified as per your expectations. So, grab it now.
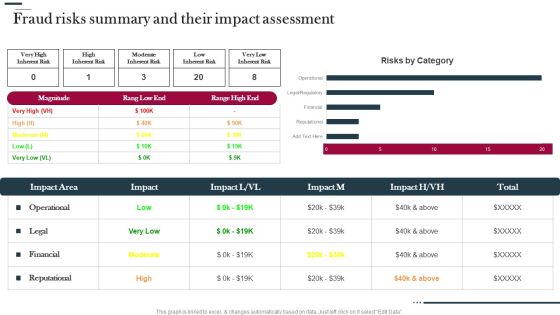
Various Strategies To Prevent Business Fraud Risks Summary And Their Impact Assessment Download PDF
This graph is linked to excel, and changes automatically based on data. Just left click on it select Edit Data. Deliver an awe inspiring pitch with this creative Various Strategies To Prevent Business Fraud Risks Summary And Their Impact Assessment Download PDF bundle. Topics like Risks Category, Operational, Legal can be discussed with this completely editable template. It is available for immediate download depending on the needs and requirements of the user.
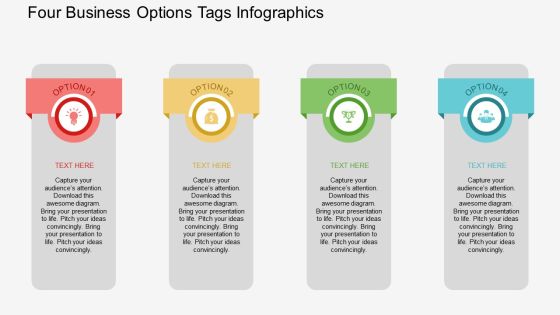
Four Business Options Tags Infographics Powerpoint Template
The above PowerPoint slide displays four options tags infographic. This PowerPoint diagram helps to summarize complex business data. Adjust the above diagram in your business presentations to visually support your content.
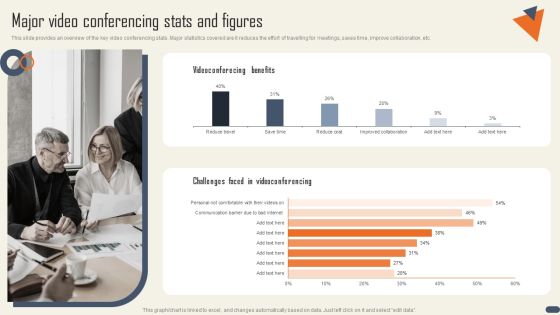
Networking Events Major Video Conferencing Stats And Figures Summary PDF
This slide provides an overview of the key video conferencing stats. Major statistics covered are it reduces the effort of travelling for meetings, saves time, improve collaboration, etc. The best PPT templates are a great way to save time, energy, and resources. Slidegeeks have 100 percent editable powerpoint slides making them incredibly versatile. With these quality presentation templates, you can create a captivating and memorable presentation by combining visually appealing slides and effectively communicating your message. Download Networking Events Major Video Conferencing Stats And Figures Summary PDF from Slidegeeks and deliver a wonderful presentation.

Category Acquisition Program Phases With Key Activities Demonstration PDF
This slide mentions a four-phase approach of implementing category procurement plan with corresponding key activities. The phases include assessment snapshot, spend analysis, category sourcing and implementation. Presenting Category Acquisition Program Phases With Key Activities Demonstration PDF to dispense important information. This template comprises four stages. It also presents valuable insights into the topics including Project Kick Off, Determine Primary Source Data, Assess Quality Data. This is a completely customizable PowerPoint theme that can be put to use immediately. So, download it and address the topic impactfully.

PowerPoint Design Gear Process Success Ppt Slide
PowerPoint Design Gear Process Success PPT Slide-If you need to create advanced, completely customizable diagrams for your data, Use this diagram with excellent graphics that help you convey your ideas successfully.-PowerPoint Design Gear Process Success PPT Slide
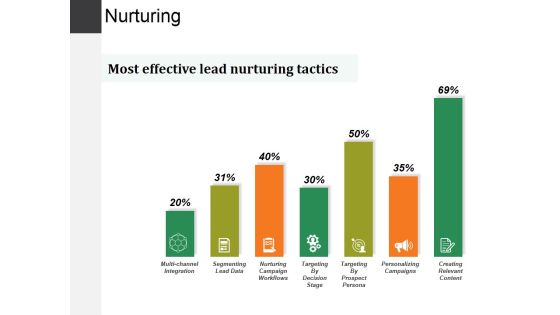
Nurturing Ppt PowerPoint Presentation Summary Brochure
This is a nurturing ppt powerpoint presentation summary brochure. This is a seven stage process. The stages in this process are segmenting lead data, nurturing campaign workflows, targeting by prospect persona, personalizing campaigns, creating relevant content.
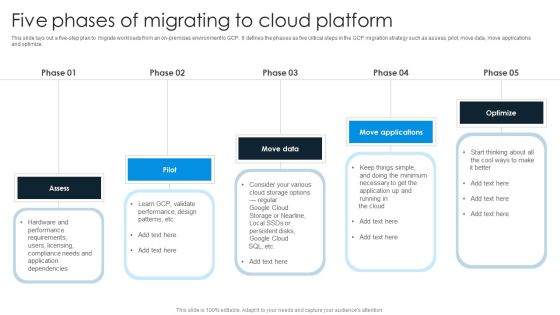
Five Phases Of Migrating To Cloud Platform Portrait PDF
This slide lays out a five-step plan to migrate workloads from an on-premises environment to GCP. It defines the phases as five critical steps in the GCP migration strategy such as assess, pilot, move data, move applications and optimize. Presenting Five Phases Of Migrating To Cloud Platform Portrait PDF to dispense important information. This template comprises five stages. It also presents valuable insights into the topics including Assess, Pilot, Move Data. This is a completely customizable PowerPoint theme that can be put to use immediately. So, download it and address the topic impactfully.
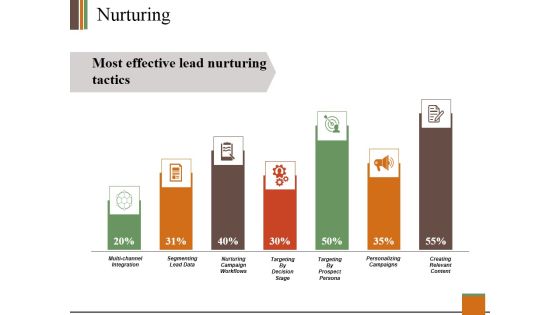
Nurturing Ppt PowerPoint Presentation Show Smartart
This is a nurturing ppt powerpoint presentation show smartart. This is a seven stage process. The stages in this process are segmenting lead data, personalizing campaigns, multi channel integration.
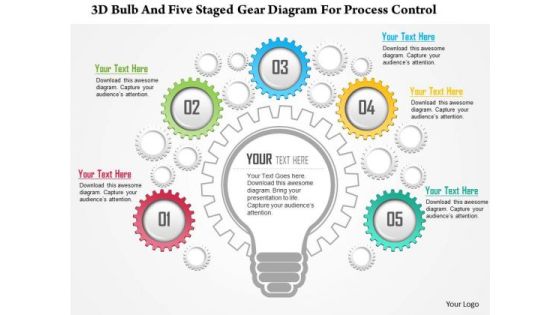
Business Diagram 3d Bulb And Five Staged Gear Diagram For Process Control Presentation Template
This business slide has been designed with graphic of 3d bulb and five staged gear diagram. This business disarm is helpful to depict process controls. Download our above diagram to express information in a visual way.

Telemarketing Report Template 1 Ppt PowerPoint Presentation Show Structure
This is a telemarketing report template 1 ppt powerpoint presentation show structure. This is a four stage process. The stages in this process are inbound calls connected, appointment requested, appointment results, key data, daily connected calls.

Four Circular Steps Process Infographics Powerpoint Template
This PowerPoint slide contains circular steps process infographic. This professional slide may be used for visual explanation of data. Adjust the above diagram in your business presentations to give professional impact.
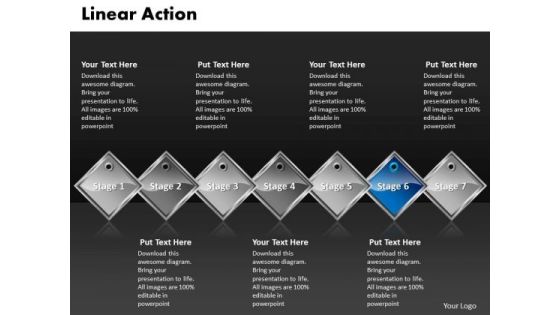
Ppt Blue Diamond Linear Action 7 Phase Diagram PowerPoint Templates
PPT blue diamond linear action 7 phase diagram PowerPoint Templates-Use this Diamond based Operation Chart Diagram to explore seven stages of a Linear Process. This chart visualize the process steps, reoccurrences and components or of your company structure or product features.-PPT blue diamond linear action 7 phase diagram PowerPoint Templates-Abstract, Action, Artwork, Beam, Blue, Concept, Conceptual, Contemporary, Core, Cyberspace, Data, Depth, Dimension, Dynamic, Field, Form, Geometric, Glow, Glowing, Graphic, Hi-Tech, Idea, Illumination, Inner, Inside, Linear, Lines
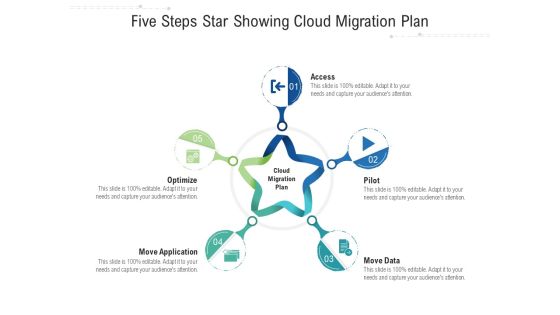
Five Steps Star Showing Cloud Migration Plan Ppt PowerPoint Presentation Visual Aids Summary PDF
Presenting this set of slides with name five steps star showing cloud migration plan ppt powerpoint presentation visual aids summary pdf. This is a five stage process. The stages in this process are access, pilot, move data, optimize, move application. This is a completely editable PowerPoint presentation and is available for immediate download. Download now and impress your audience.

Six Hands Around Bulb For Idea Planning Powerpoint Templates
This business diagram has been crafted with graphic of five tags icons. This slide helps to display business steps in visual manner. Download this PowerPoint template to build unique presentations.

FMEA To Determine Potential Dashboard Design Failure Mode And Effect Analysis DFMEA Ppt Show Styles PDF
This graph or chart is linked to excel, and changes automatically based on data. Just left click on it and select Edit Data. Deliver an awe inspiring pitch with this creative FMEA To Determine Potential Dashboard Design Failure Mode And Effect Analysis DFMEA Ppt Show Styles PDF bundle. Topics like Target Completion, Recommended Action, RPN Breakdown can be discussed with this completely editable template. It is available for immediate download depending on the needs and requirements of the user.

Ppt Animate Text PowerPoint 2007 Circles Downward Arrow 6 Steps Business Templates
PPT animate text powerpoint 2007 circles downward arrow 6 steps Business Templates-Arrows PowerPoint Diagram is nice for financial PowerPoint Diagram presentations as well as other analysis or business PowerPoint diagram needs. Use this graphical approach to represent global business issues such as financial data, stock market Exchange, increase in sales, corporate presentations and more.-PPT animate text powerpoint 2007 circles downward arrow 6 steps Business Templates-Add, Aqua, Arrows, Badges, Bar, Blend, Blue, Bright, Bubbles, Buttons, Caution, Circle, Drop, Elements, Glossy, Glowing, Graphic, Heart, Help, Icons, Idea, Illustration, Navigation, Oblong, Plus, Round, Service, Shadow, Shiny, Sign, Speech, Squares

Service Level Agreement KPI Dashboard With Sales And Product Report Clipart PDF
This graph or chart is linked to excel, and changes automatically based on data. Just left click on it and select Edit Data. Showcasing this set of slides titled Service Level Agreement KPI Dashboard With Sales And Product Report Clipart PDF. The topics addressed in these templates are Total Accounts YTD, Conversion Rate, Mthly MRR Retention. All the content presented in this PPT design is completely editable. Download it and make adjustments in color, background, font etc. as per your unique business setting.
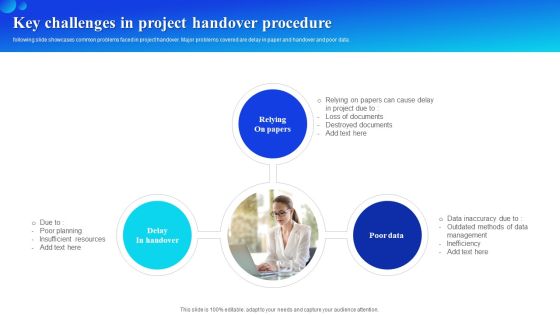
Key Challenges In Project Handover Procedure Designs PDF
following slide showcases common problems faced in project handover. Major problems covered are delay in paper and handover and poor data. Presenting Key Challenges In Project Handover Procedure Designs PDF to dispense important information. This template comprises three stages. It also presents valuable insights into the topics including Relying On Papers, Delay In Handover, Poor Data. This is a completely customizable PowerPoint theme that can be put to use immediately. So, download it and address the topic impactfully.

Business Phase Ands Customer Partnership Formats PDF
Pitch your topic with ease and precision using this Business Phase Ands Customer Partnership Formats PDF. This layout presents information on Supplier, Cross Functional Communication, Operating Data. It is also available for immediate download and adjustment. So, changes can be made in the color, design, graphics or any other component to create a unique layout.
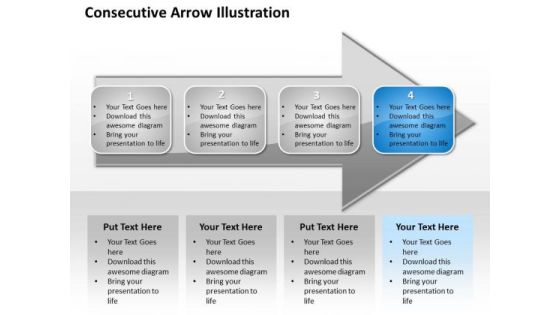
Ppt Consecutive Illustration Of 4 Concepts An Arrow PowerPoint Templates
PPT consecutive illustration of 4 concepts an arrow PowerPoint Templates-Use this Diagram to display the data. It make easier for the analysts to visualize and interpret the data-PPT consecutive illustration of 4 concepts an arrow PowerPoint Templates-3d, Abstract, Around, Arrows, Blue, Border, Business, Center, Circle, Circular, Concept, Connections, Copy, Curve, Cycle, Directions, Distribution, Illustration, Management, Middle, Objects, Pieces, Plan, Pointing, Process, Recycle, Rounded, Shadows, Space, System
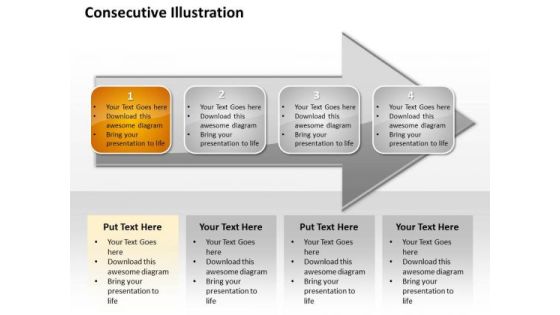
Ppt Consecutive Mobile Marketing PowerPoint Presentation Steps An Arrow Templates
PPT consecutive mobile marketing powerpoint presentation steps an arrow Templates-Use this Diagram to display the data. It makes easier for the analysts to visualize and interpret the data-PPT consecutive mobile marketing powerpoint presentation steps an arrow Templates-3d, Abstract, Around, Arrows, Blue, Border, Business, Center, Circle, Circular, Concept, Connections, Copy, Curve, Cycle, Directions, Distribution, Illustration, Management, Middle, Objects, Pieces, Plan, Pointing, Process, Recycle, Rounded, Shadows, Space, System

Brand Tracking Info Graphics Ppt PowerPoint Presentation Model Example
This is a brand tracking info graphics ppt powerpoint presentation model example. This is a four stage process. The stages in this process are finance, marketing, percentage, business, icons.

Managing Artificial Intelligence Project Framework Ppt Ideas Backgrounds PDF
This slide exhibits information about self driving car project using anonymizing faces to protect individual privacy. It includes elements such as data, skills, value proposition, integration, stakeholders, revenue etc. Presenting Managing Artificial Intelligence Project Framework Ppt Ideas Backgrounds PDF to dispense important information. This template comprises four stages. It also presents valuable insights into the topics including Data, Value Proposition, Integration. This is a completely customizable PowerPoint theme that can be put to use immediately. So, download it and address the topic impactfully.

Business Diagram Circles Around Gears For Process Control Presentation Template
This power point template has been designed with graphic of multiple gears and text circles. This PPT diagram contains the concept of process control Develop your marketing strategy with this diagram.

Five Levels Pyramid Layout For Success Of Financial Planning Ppt PowerPoint Presentation Gallery Topics PDF
Presenting five levels pyramid layout for success of financial planning ppt powerpoint presentation gallery topics pdf to dispense important information. This template comprises five stages. It also presents valuable insights into the topics including develop financial plan, analyse the data, collect financial data. This is a completely customizable PowerPoint theme that can be put to use immediately. So, download it and address the topic impactfully.
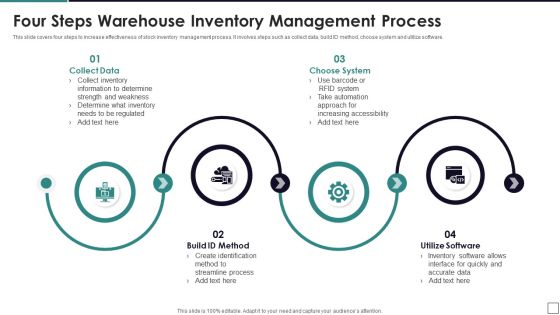
Four Steps Warehouse Inventory Management Process Demonstration PDF
This slide covers four steps to increase effectiveness of stock inventory management process. It involves steps such as collect data, build ID method, choose system and utilize software. Presenting Four Steps Warehouse Inventory Management Process Demonstration PDF to dispense important information. This template comprises four stages. It also presents valuable insights into the topics including Collect Data, Choose System, Utilize Software. This is a completely customizable PowerPoint theme that can be put to use immediately. So, download it and address the topic impactfully.

Employee Community Engagement Principles With Management Role Inspiration PDF
The slide highlights the employee engagement principles with management role illustrating recognition, real time data, appreciation gesture, management role and engagement structure. Presenting Employee Community Engagement Principles With Management Role Inspiration PDF to dispense important information. This template comprises five stages. It also presents valuable insights into the topics including Recognition, Real Time Data, Appreciation Gesture, Management Role. This is a completely customizable PowerPoint theme that can be put to use immediately. So, download it and address the topic impactfully.
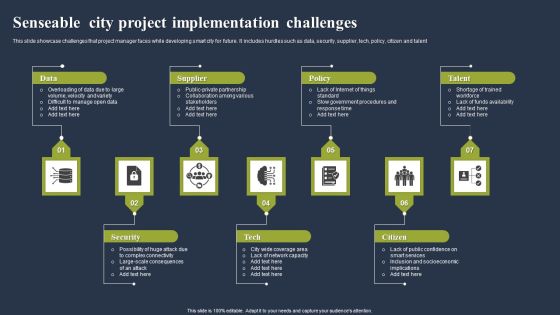
Senseable City Project Implementation Challenges Topics PDF
This slide showcase challenges that project manager faces while developing smart city for future. It includes hurdles such as data, security, supplier, tech, policy, citizen and talent. Presenting Senseable City Project Implementation Challenges Topics PDF to dispense important information. This template comprises seven stages. It also presents valuable insights into the topics including Data, Supplier, Policy. This is a completely customizable PowerPoint theme that can be put to use immediately. So, download it and address the topic impactfully.

Best Practices For New Client Onboarding Procedure Slides PDF
This slide covers best practices for new customer onboarding process. It involves measures such as onboard team, gather data, communicate and regularly assess customer needs. Presenting Best Practices For New Client Onboarding Procedure Slides PDF to dispense important information. This template comprises four stages. It also presents valuable insights into the topics including Onboard Team, Gather Data, Communicate Effectively, Regularly Assess. This is a completely customizable PowerPoint theme that can be put to use immediately. So, download it and address the topic impactfully.
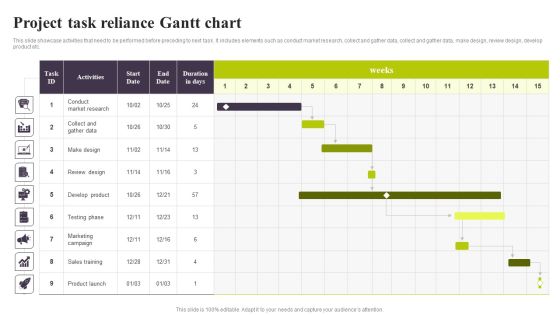
Project Task Reliance Gantt Chart Ppt PowerPoint Presentation Diagram PDF
This slide showcase activities that need to be performed before preceding to next task. It includes elements such as conduct market research, collect and gather data, collect and gather data, make design, review design, develop product etc. Showcasing this set of slides titled Project Task Reliance Gantt Chart Ppt PowerPoint Presentation Diagram PDF. The topics addressed in these templates are Conduct Market Research, Marketing Campaign, Sales Training. All the content presented in this PPT design is completely editable. Download it and make adjustments in color, background, font etc. as per your unique business setting.
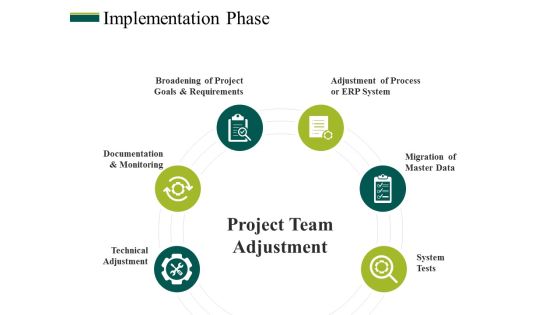
Implementation Phase Ppt PowerPoint Presentation Show Visuals
This is a implementation phase ppt powerpoint presentation show visuals. This is a six stage process. The stages in this process are technical adjustment, documentation and monitoring, broadening of project goals and requirements, adjustment of process or erp system, migration of master data.
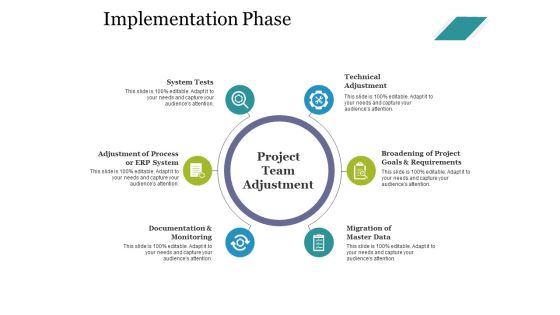
Implementation Phase Ppt PowerPoint Presentation Examples
This is a implementation phase ppt powerpoint presentation examples. This is a six stage process. The stages in this process are migration of master data, broadening of project goals and requirements, technical adjustment, system tests, adjustment of process or erp syst.

Implementation Phase Ppt PowerPoint Presentation Outline Deck
Presenting this set of slides with name implementation phase ppt powerpoint presentation outline deck. This is a six stage process. The stages in this process are broadening project goals and requirements, documentation and monitoring, technical adjustment, system tests, migration master data, adjustment process, erp system. This is a completely editable PowerPoint presentation and is available for immediate download. Download now and impress your audience.
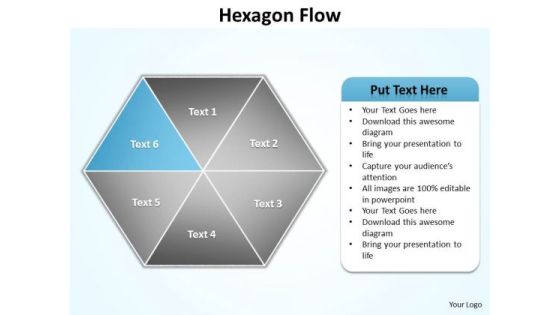
Ppt Blue Factor Hexagon Angles Spider Diagram PowerPoint Template Editable Templates
PPT blue factor hexagon angles spider diagram PowerPoint template editable Templates-You can easily collaborate this PowerPoint diagram with colleagues to create detailed process diagrams and use them as a key element in streamlining your processes. Use this graphical approach to represent global business issues such as financial data, stock market Exchange, increase in sales, corporate presentations and more. -PPT blue factor hexagon angles spider diagram PowerPoint template editable Templates-attached, backgrounds, blue, cell, color, component, connect, connection, diagram, elements, geometric, graphic, group, hexagon, honeycomb, icon, illustration, intricacy, lines, link, map, mesh, model, network, science, shape, shiny, strategy, structure, symbol, teamwork, technology
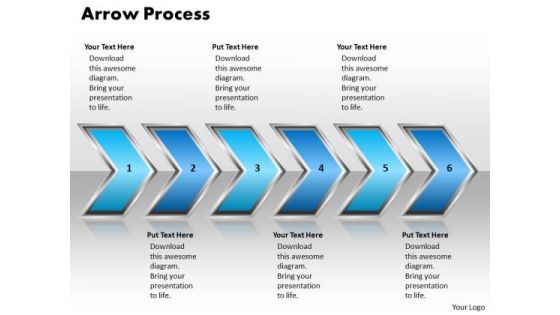
Ppt Pointing Curved Arrow Forging Process PowerPoint Slides 6 State Diagram Templates
PPT pointing curved arrow forging process powerpoint slides 6 state diagram Templates-This diagram is an amazing tool to ensure that strategic planning sessions contribute to teambuilding. Use this graphical approach to represent global business issues such as financial data, stock market Exchange, increase in sales, corporate presentations and more.-PPT pointing curved arrow forging process powerpoint slides 6 state diagram Templates-Aim, Arrow, Arrowheads, Badge, Border, Click, Connection, Curve, Design, Direction, Download, Element, Fuchsia, Icon, Illustration, Indicator, Internet, Magenta, Mark, Object, Orientation, Pointer, Shadow, Shape, Sign
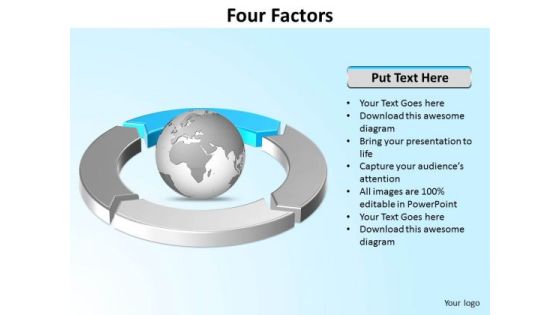
Ppt Four Segments Around Globe PowerPoint Presentation Circle Blue Templates
PPT four segments around globe powerpoint presentation circle blue Templates-This PowerPoint Diagram can be used to represent worldwide business issues such as financial data, stock market Exchange, increase in sales, corporate presentations and more. It illustrates the blue component of this worldwide PowerPoint Diagram.-Can be used for presentations on abstract, achievement, aim, arrow, background, business, chart, communication, company, competition, concept, design, development, diagram, direction, finance, financial, forecast, forward, goal, graph, graphic, growth, icon, illustration, increase, investment, leader, leadership, marketing, motion, moving, path, price, process, profit, progress, progress bar, shape, sign, success, symbol, target, team, teamwork, turquoise blue, up, upward-PPT four segments around globe powerpoint presentation circle blue Templates
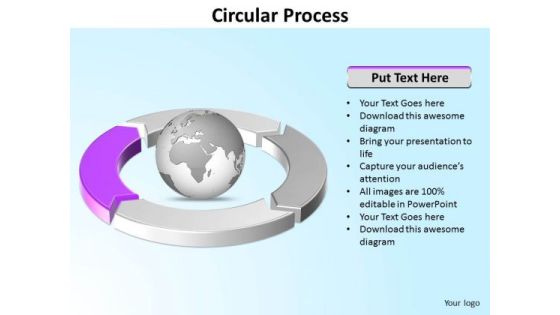
Ppt Four Segments Around Microsoft PowerPoint Backgrounds Circle Purple Templates
PPT four segments around microsoft powerpoint backgrounds circle purple Templates-This PowerPoint Diagram can be used to represent worldwide business issues such as financial data, stock market Exchange, increase in sales, corporate presentations and more. It illustrates the purple component. This Diagram will fit for Business Presentations.-Can be used for presentations on abstract, achievement, aim, arrow, background, business, chart, communication, company, competition, concept, design, development, diagram, direction, finance, financial, forecast, forward, goal, graph, graphic, growth, icon, illustration, increase, investment, leader, leadership, marketing, motion, moving, path, price, process, profit, progress, progress bar, shape, sign, success, symbol, target, team, teamwork, turquoise blue, up, upward-PPT four segments around microsoft powerpoint backgrounds circle purple Templates

Ppt Arrows PowerPoint 2010 Pointing Vertical Downwards Templates
PPT arrows powerpoint 2010 pointing vertical downwards Templates-Arrows PowerPoint Diagram is nice for financial PowerPoint Diagram presentations as well as other analysis or business PowerPoint diagram needs. Use this graphical approach to represent global business issues such as financial data, stock market Exchange, increase in sales, corporate presentations and more.-PPT arrows powerpoint 2010 pointing vertical downwards Templates-advertising, arrow, bend, black, blue, bookmark, business, collection, control, corner, curl, customer, design, down, element, gold, green, icon, illustration, label, mark, marketing, message, new, origami, paper, product, service, set, shadow, shiny, shop, sign, site, sticker, symbol, tag

Ppt Four Segments Around Globe In Circle PowerPoint Presentation Templates
PPT four segments around globe in circle powerpoint presentation Templates-Use this graphical approach to represent global business issues such as financial data, stock market Exchange, increase in sales, corporate presentations and more. It Signifies common, comprehensive, extensive, global, international, multinational, omnipresent, planetary, ubiquitous, universal etc.-Can be used for presentations on abstract, achievement, aim, arrow, background, business, chart, communication, company, competition, concept, design, development, diagram, direction, finance, financial, forecast, forward, goal, graph, graphic, growth, icon, illustration, increase, investment, leader, leadership, marketing, motion, moving, path, price, process, profit, progress, progress bar, shape, sign, success, symbol, target, team, teamwork, turquoise blue, up, upward-PPT four segments around globe in circle powerpoint presentation Templates
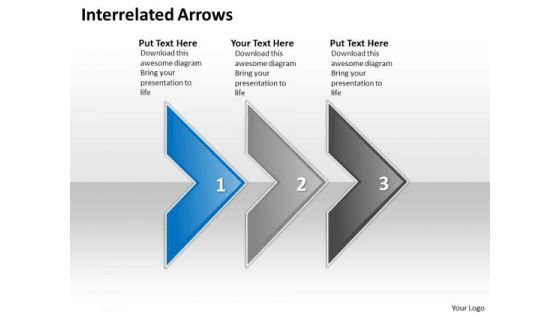
Ppt Interrelated Arrows Three Practice The PowerPoint Macro Steps Business Templates
PPT interrelated arrows three practice the powerpoint macro steps Business Templates-Use this graphical approach to represent global business issues such as financial data, stock market Exchange, increase in sales, corporate presentations and more. This image has been conceived to enable you to emphatically communicate your ideas in your Business, Marketing PPT presentation.-PPT interrelated arrows three practice the powerpoint macro steps Business Templates-Aim, Arrow, Arrowheads, Badge, Border, Click, Connection, Curve, Design, Direction, Download, Element, Fuchsia, Icon, Illustration, Indicator, Internet, Magenta, Mark, Object, Orientation, Pointer, Shadow, Shape, Sign

Key Statistics Management Ppt PowerPoint Presentation Professional Graphics Tutorials
This is a key statistics management ppt powerpoint presentation professional graphics tutorials. This is a five stage process. The stages in this process are strategy, marketing, business, management, icons.

Key Stats And Figure Movie Editing Company Outline Ideas PDF
This slide showcases the statistics associated with film production house which includes global box office collection, revenue, number of released movies, average hours of production, number of crew members, etc. Retrieve professionally designed Key Stats And Figure Movie Editing Company Outline Ideas PDF to effectively convey your message and captivate your listeners. Save time by selecting pre-made slideshows that are appropriate for various topics, from business to educational purposes. These themes come in many different styles, from creative to corporate, and all of them are easily adjustable and can be edited quickly. Access them as PowerPoint templates or as Google Slides themes. You donot have to go on a hunt for the perfect presentation because Slidegeeks got you covered from everywhere.
Business Diagram Banner Style Text Boxes Diagram PowerPoint Ppt Presentation
This diagram displays banner style text boxes. It contains three text boxes with icons.You may use this layout to display business process in an interesting, eye-catching manner.
Project Information Analysis Powerpoint Slide Introduction
This is a project information analysis powerpoint slide introduction. This is a five stage process. The stages in this process are gears, business, icons, strategy, industrial, marketing.

Continuous Process Product Quality Improvement Action Plan Phases Introduction PDF
The slide involves different phases of quality improvement plan to increase customer satisfaction and raise the value of business. It includes three phases such as phase 1 team development, concept definition, etc, phase 2 presentation of data, problem identification, etc and phase 3 plan analysis, etc.

PowerPoint Process Rings Business Ppt Theme
PowerPoint Process Rings Business PPT Theme-This PowerPoint Diagram Shows the Colorful Interconnected Rings. SmartArt graphics add color, shape, and emphasis to your text and data, and they're a snap to use. This PowerPoint Template Signifies the Strategy, Planning required for Business.-PowerPoint Process Rings Business PPT Theme

Business Diagram Business Diagram 3d Bulb With Stair Design For Idea Generation Presentation Templat
This business diagram has been designed with graphic of light bulb and stairs and icons. These stairs contains various business icons. This professional slide depicts innovative business ideas. Use this PPT slide for your business presentations.

Benefits Of Using Digital Loans Platform Ppt Diagram Graph Charts PDF
This slide contains the benefits of using the platform for digitally lending money to the borrowers. It includes optimize loan cycle, consistent, easy collection of applicant data, quicker decision making, etc. Persuade your audience using this Benefits Of Using Digital Loans Platform Ppt Diagram Graph Charts PDF. This PPT design covers three stages, thus making it a great tool to use. It also caters to a variety of topics including Optimize Loan Cycle, Easy Collection, Candidate Data. Download this PPT design now to present a convincing pitch that not only emphasizes the topic but also showcases your presentation skills.

Business Diagram Thumbs Up For Save The World Campaign Presentation Template
This Power Point diagram has been crafted with graphic of text boxes with icons. It contains diagram of thumb up hand graphics with communication icons. Use this diagram to build professional presentation for your viewers.
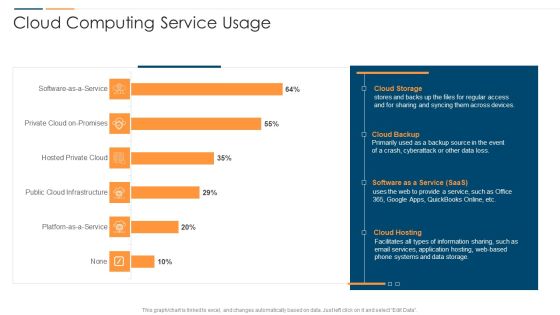
Revolution In Online Business Cloud Computing Service Usage Ppt PowerPoint Presentation File Themes PDF
This graph or chart is linked to excel, and changes automatically based on data. Just left click on it and select Edit Data. Deliver and pitch your topic in the best possible manner with this Revolution In Online Business Cloud Computing Service Usage Ppt PowerPoint Presentation File Themes PDF. Use them to share invaluable insights on Cloud Storage System, Cloud Backup Saas, Cloud Hosting Storage and impress your audience. This template can be altered and modified as per your expectations. So, grab it now.
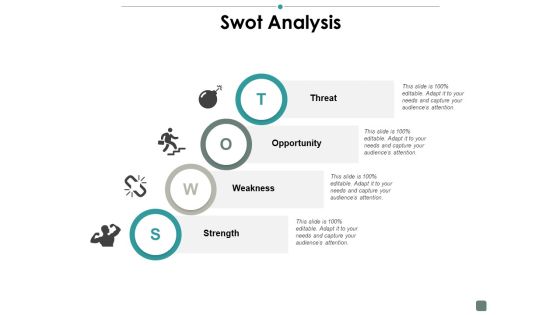
Swot Analysis Contribution Ppt PowerPoint Presentation Pictures Information
This is a swot analysis contribution ppt powerpoint presentation pictures information. This is a four stage process. The stages in this process are marketing, icons, business, management, strategy.

Service Level Agreement KPI Dashboard Indicating Violation Count And Overdue Requests Diagrams PDF
This graph or chart is linked to excel, and changes automatically based on data. Just left click on it and select Edit Data. Showcasing this set of slides titled Service Level Agreement KPI Dashboard Indicating Violation Count And Overdue Requests Diagrams PDF. The topics addressed in these templates are Total Requests Category, Total Requests Status, Urgent Requests. All the content presented in this PPT design is completely editable. Download it and make adjustments in color, background, font etc. as per your unique business setting.

CRM For Online Business Ppt PowerPoint Presentation Pictures Microsoft
Presenting this set of slides with name crm for online business ppt powerpoint presentation pictures microsoft. This is a four stage process. The stages in this process are customer service icon, crm icon, customer relationship management icon. This is a completely editable PowerPoint presentation and is available for immediate download. Download now and impress your audience.
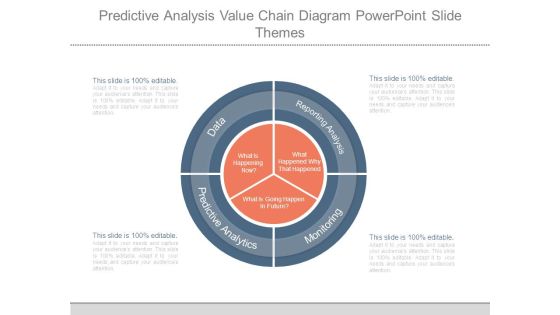
Predictive Analysis Value Chain Diagram Powerpoint Slide Themes
This is a predictive analysis value chain diagram powerpoint slide themes. This is a four stage process. The stages in this process are what is happening now, what is going happen in future, what happened why that happened, data, predictive analytics, reporting analysis, monitoring.
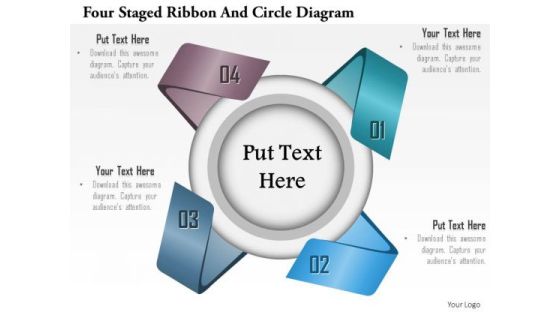
Business Diagram Four Staged Ribbon And Circle Diagram Presentation Template
This Power Point template slide has been crafted with graphic of four staged ribbon diagram. This exclusive graphic diagram template slide can be used to show the concept of business data. Use this slide and build a creative presentation for your viewers.

Content Advertising Campaign Key Stats And Figures For Content Marketing Summary PDF
This slide provides an overview of the key statistics about content marketing. Major stats covered are most businesses invest in organic research, pandemic led to rise in content usage, most marketers outsource their content marketing, etc. Want to ace your presentation in front of a live audience Our Content Advertising Campaign Key Stats And Figures For Content Marketing Summary PDF can help you do that by engaging all the users towards you. Slidegeeks experts have put their efforts and expertise into creating these impeccable powerpoint presentations so that you can communicate your ideas clearly. Moreover, all the templates are customizable, and easy to edit and downloadable. Use these for both personal and commercial use.
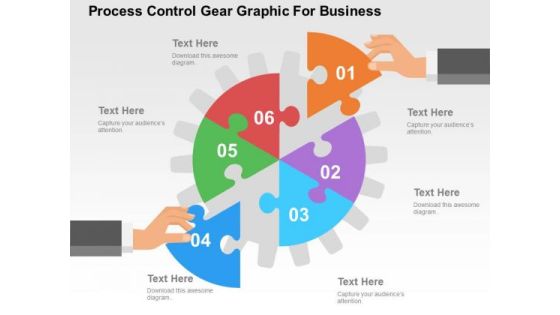
Process Control Gear Graphic For Business PowerPoint Template
Our professionally designed gear diagram is as an effective tool for communicating ideas. It contains graphics of gear with six segments. Convey your views with this diagram slide. It will amplify the strength of your logic.
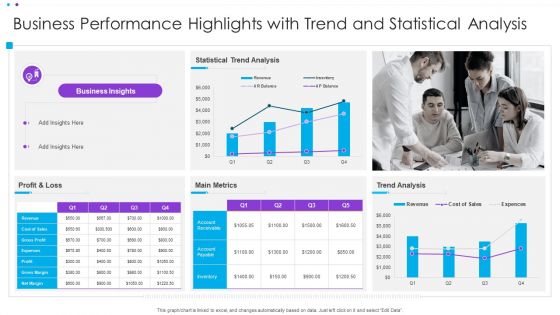
Business Performance Highlights With Trend And Statistical Analysis Ppt Infographic Template Display PDF
This graph or chart is linked to excel, and changes automatically based on data. Just left click on it and select Edit Data. Pitch your topic with ease and precision using this Business Performance Highlights With Trend And Statistical Analysis Ppt Infographic Template Display PDF. This layout presents information on Statistical Trend Analysis, Main Metrics, Profit And Loss. It is also available for immediate download and adjustment. So, changes can be made in the color, design, graphics or any other component to create a unique layout.

Power Plant Energy Production Dashboard For Consumption Statistics Download PDF
This graph or chart is linked to excel, and changes automatically based on data. Just left click on it and select edit data. Pitch your topic with ease and precision using this Multiple Country Energy Consumption Statistics Comparison Dashboard Formats PDF. This layout presents information on August Year 2022, Return on Investments, Power Plan Detail . It is also available for immediate download and adjustment. So, changes can be made in the color, design, graphics or any other component to create a unique layout.

Steps To Conduct Competitor Analysis Column Chart Ppt Model Gridlines PDF
This graph or chart is linked to excel, and changes automatically based on data. Just left click on it and select edit data. If your project calls for a presentation, then Slidegeeks is your go-to partner because we have professionally designed, easy-to-edit templates that are perfect for any presentation. After downloading, you can easily edit Steps To Conduct Competitor Analysis Column Chart Ppt Model Gridlines PDF and make the changes accordingly. You can rearrange slides or fill them with different images. Check out all the handy templates

Prevention Of Information Key Statistics Showing The Impact Of Security Awareness Infographics PDF
This graph or chart is linked to excel, and changes automatically based on data. Just left click on it and select Edit Data. This modern and well-arranged Prevention Of Information Key Statistics Showing The Impact Of Security Awareness Infographics PDF provides lots of creative possibilities. It is very simple to customize and edit with the Powerpoint Software. Just drag and drop your pictures into the shapes. All facets of this template can be edited with Powerpoint, no extra software is necessary. Add your own material, put your images in the places assigned for them, adjust the colors, and then you can show your slides to the world, with an animated slide included.
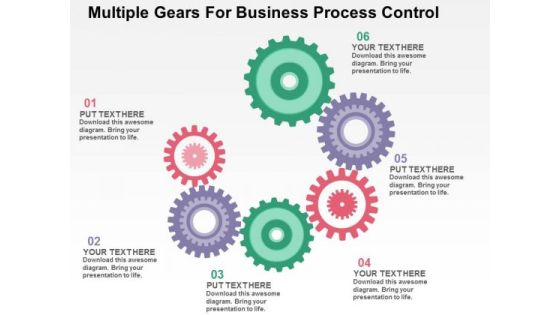
Multiple Gears For Business Process Control PowerPoint Template
This business diagram has been designed with multiple gears. It may use to display task management and process control. Prove the viability of your ideas to help your organization to achieve the quality and success required.

Quarterly Timeline Template Ppt PowerPoint Presentation Ideas Background Images
This is a quarterly timeline template ppt powerpoint presentation ideas background images. This is a four stage process. The stages in this process are icons, years, marketing, strategy, planning.
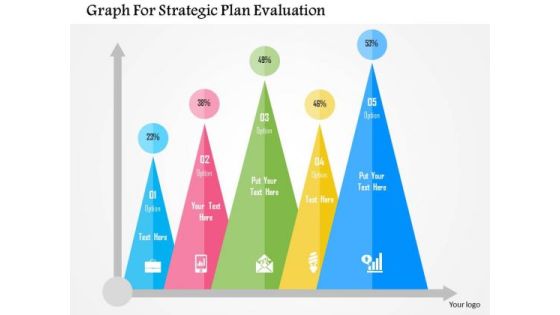
Business Diagram Graph For Strategic Plan Evaluation Presentation Template
Strategic plan evaluation can be explained with this diagram. It contains business statistics graph with icons. Download this diagram slide to make impressive presentations.

Multiaccess Edge Computing Mec Overview 5G Functional Architecture Themes PDF
This slide represents the overview of multi-access edge computing, including its characteristics, such as low latency, high bandwidth, and real-time access to RAN. This method eliminates the lengthy network channel that separates the user and host while transferring data.This is a Multiaccess Edge Computing Mec Overview 5G Functional Architecture Themes PDF template with various stages. Focus and dispense information on six stages using this creative set, that comes with editable features. It contains large content boxes to add your information on topics like Previously Separated, Centralized Data, Low Latency. You can also showcase facts, figures, and other relevant content using this PPT layout. Grab it now.

Content Execution Ppt PowerPoint Presentation Outline Vector
This is a content execution ppt powerpoint presentation outline vector. This is a seven stage process. The stages in this process are icons, planning, strategy, analysis, marketing.

Service Level Agreement KPI Dashboard With Current Risk Statistics Topics PDF
This graph or chart is linked to excel, and changes automatically based on data. Just left click on it and select Edit Data. Pitch your topic with ease and precision using this Service Level Agreement KPI Dashboard With Current Risk Statistics Topics PDF. This layout presents information on Current Risk SLAS, Current Breached Slas, Personal Active SLA It is also available for immediate download and adjustment. So, changes can be made in the color, design, graphics or any other component to create a unique layout.
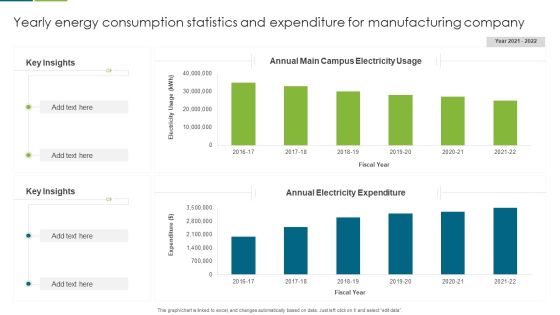
Yearly Energy Consumption Statistics And Expenditure For Manufacturing Company Guidelines PDF
This graph or chart is linked to excel, and changes automatically based on data. Just left click on it and select edit data. Pitch your topic with ease and precision using this Yearly Energy Consumption Statistics And Expenditure For Manufacturing Company Guidelines PDF. This layout presents information on Key Insights, Annual Electricity Expenditure, Annual Main Campus, Electricity Usage. It is also available for immediate download and adjustment. So, changes can be made in the color, design, graphics or any other component to create a unique layout.

Strategic Management Figure Chart Consulting Diagram
Good Camaraderie Is A Key To Teamwork. Our Strategic Management Figure Chart Consulting Diagram Powerpoint Templates Can Be A Cementing Force.
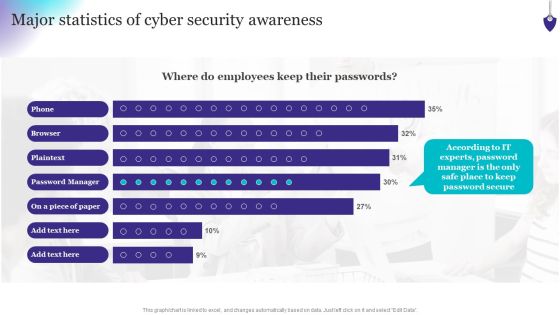
Organizing Security Awareness Major Statistics Of Cyber Security Awareness Formats PDF
This graph or chart is linked to excel, and changes automatically based on data. Just left click on it and select Edit Data. Welcome to our selection of the Organizing Security Awareness Major Statistics Of Cyber Security Awareness Formats PDF. These are designed to help you showcase your creativity and bring your sphere to life. Planning and Innovation are essential for any business that is just starting out. This collection contains the designs that you need for your everyday presentations. All of our PowerPoints are 100 percent editable, so you can customize them to suit your needs. This multi-purpose template can be used in various situations. Grab these presentation templates today.
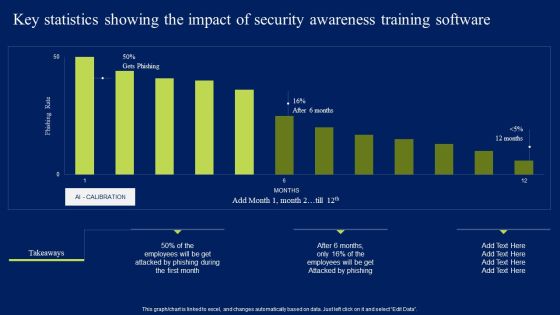
Key Statistics Showing The Impact Of Security Awareness Training Software Elements PDF
This graph or chart is linked to excel, and changes automatically based on data. Just left click on it and select Edit Data. Slidegeeks is one of the best resources for PowerPoint templates. You can download easily and regulate Key Statistics Showing The Impact Of Security Awareness Training Software Elements PDF for your personal presentations from our wonderful collection. A few clicks is all it takes to discover and get the most relevant and appropriate templates. Use our Templates to add a unique zing and appeal to your presentation and meetings. All the slides are easy to edit and you can use them even for advertisement purposes.

Five Steps To Conduct Quantitative Market Research Themes PDF
This slide covers steps for organizations to perform successful market research in order to achieve their targets. It includes specifying goals, creating a plan, collecting, analyzing and compiling data. Presenting Five Steps To Conduct Quantitative Market Research Themes PDF to dispense important information. This template comprises five stages. It also presents valuable insights into the topics including Specify Goal, Create Plan, Collect Data. This is a completely customizable PowerPoint theme that can be put to use immediately. So, download it and address the topic impactfully.

Six Staged Business Growth Analysis PowerPoint Template
Growth analysis of business can be explained with this diagram. It contains graphics of bars with icons. You can use this design to complement your idea themed presentation.

Best Practices To Raise Money Through Welfare Fundraising Diagrams PDF
This slide showcases ideas to initiate effectively fundraising plan. This template focuses on encouraging people to donate for causes they care about. It includes information related to collecting data, determining charity goals, etc. Presenting Best Practices To Raise Money Through Welfare Fundraising Diagrams PDF to dispense important information. This template comprises four stages. It also presents valuable insights into the topics including Fundraising Goals, Donor Data, Mission. This is a completely customizable PowerPoint theme that can be put to use immediately. So, download it and address the topic impactfully.
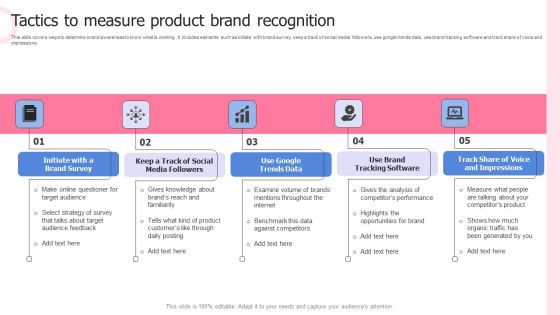
Tactics To Measure Product Brand Recognition Diagrams PDF
This slide covers ways to determine brand awareness to know what is working . It includes elements such as initiate with brand survey, keep a track of social media followers, use google trends data, use brand tracking software and track share of voice and impressions. Presenting Tactics To Measure Product Brand Recognition Diagrams PDF to dispense important information. This template comprises five stages. It also presents valuable insights into the topics including Use Google Trends Data, Use Brand Tracking Software, Brand Survey. This is a completely customizable PowerPoint theme that can be put to use immediately. So, download it and address the topic impactfully.

Process Of Consumer Partition Using Machine Learning Diagrams PDF
This slide presents process of customer segmentation using machine learning to improve marketing strategies. The steps include design business case, prepare data, develop segments, tune hyperparameters and visualization of results. Presenting Process Of Consumer Partition Using Machine Learning Diagrams PDF to dispense important information. This template comprises five stages. It also presents valuable insights into the topics including Design Business Case, Prepare Data, Develop Segments, Tune Hyperparameters, Visualization Of Results. This is a completely customizable PowerPoint theme that can be put to use immediately. So, download it and address the topic impactfully.

Colorful Infographic For Text Representation Powerpoint Templates
Our above business diagram has been designed with colorful circular tags with icons. This slide is suitable for text representation in visual manner. Use this business diagram to present your work in a more smart and precise manner.
