AI PPT Maker
Templates
PPT Bundles
Design Services
Business PPTs
Business Plan
Management
Strategy
Introduction PPT
Roadmap
Self Introduction
Timelines
Process
Marketing
Agenda
Technology
Medical
Startup Business Plan
Cyber Security
Dashboards
SWOT
Proposals
Education
Pitch Deck
Digital Marketing
KPIs
Project Management
Product Management
Artificial Intelligence
Target Market
Communication
Supply Chain
Google Slides
Research Services
 One Pagers
All Categories
-
Home
- Customer Favorites
- Data Icon
Data Icon

Jigsaw Depicting 8 Stages Of Continual Service Improvement Process Inspiration PDF
Presenting Jigsaw Depicting 8 Stages Of Continual Service Improvement Process Inspiration PDF to dispense important information. This template comprises eight stages. It also presents valuable insights into the topics including Gather Data, Analyze Data, Implement Corrective Action. This is a completely customizable PowerPoint theme that can be put to use immediately. So, download it and address the topic impactfully.

Jigsaw Depicting 9 Stages Of Continual Service Improvement Process Slides PDF
Presenting Jigsaw Depicting 9 Stages Of Continual Service Improvement Process Slides PDF to dispense important information. This template comprises nine stages. It also presents valuable insights into the topics including Gather Data, Analyze Data, Implement. This is a completely customizable PowerPoint theme that can be put to use immediately. So, download it and address the topic impactfully.

Jigsaw Depicting 11 Stages Of Continual Service Improvement Process Topics PDF
Presenting Jigsaw Depicting 11 Stages Of Continual Service Improvement Process Topics PDF to dispense important information. This template comprises eleven stages. It also presents valuable insights into the topics including Analyze Data, Implement Corrective Action, Analyze Data. This is a completely customizable PowerPoint theme that can be put to use immediately. So, download it and address the topic impactfully.

Jigsaw Depicting 12 Stages Of Continual Service Improvement Process Structure PDF
Presenting Jigsaw Depicting 12 Stages Of Continual Service Improvement Process Structure PDF to dispense important information. This template comprises tweleve stages. It also presents valuable insights into the topics including Analyze Data, Implement Corrective Action, Gather Data. This is a completely customizable PowerPoint theme that can be put to use immediately. So, download it and address the topic impactfully.
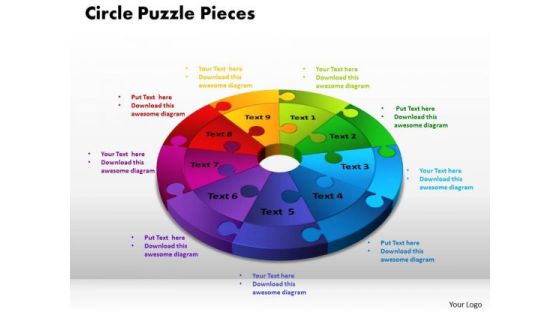
PowerPoint Process Circle Puzzle Pieces Business Ppt Theme
PowerPoint Process Circle Puzzle Pieces Business PPT Theme-This diagram is a graphical illustration of the relationships between and among sets of data, groups of objects.-PowerPoint Process Circle Puzzle Pieces Business PPT Theme

Ppt Arrow Illustration Of 4 Concepts PowerPoint Templates
PPT arrow illustration of 4 concepts PowerPoint Templates-Use this Diagram to display the data. It make easier for the analysts to visualize and interpret the data-PPT arrow illustration of 4 concepts PowerPoint Templates-3d, Abstract, Around, Arrows, Blue, Border, Business, Center, Circle, Circular, Concept, Connections, Copy, Curve, Cycle, Directions, Distribution, Illustration, Management, Middle, Objects, Pieces, Plan, Pointing, Process, Recycle, Rounded, Shadows, Space, System
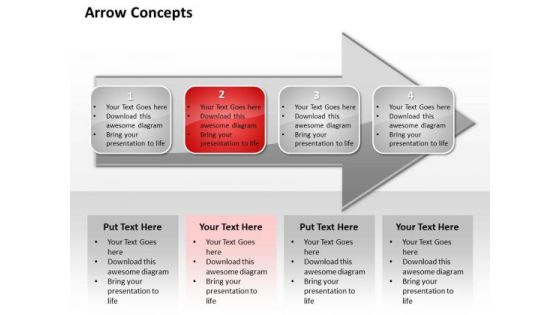
Ppt Illustration Of Concept Free Download Concepts PowerPoint Templates
PPT illustration of concept free download concepts PowerPoint Templates-Use this Diagram to display the data. It makes easier for the analysts to visualize and interpret the data-PPT illustration of concept free download concepts PowerPoint Templates-3d, Abstract, Around, Arrows, Blue, Border, Business, Center, Circle, Circular, Concept, Connections, Copy, Curve, Cycle, Directions, Distribution, Illustration, Management, Middle, Objects, Pieces, Plan, Pointing, Process, Recycle, Rounded, Shadows, Space, System
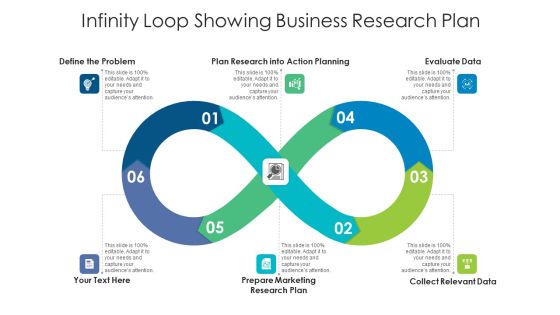
Infinity Loop Showing Business Research Plan Ppt PowerPoint Presentation File Design Templates PDF
Presenting infinity loop showing business research plan ppt powerpoint presentation file design templates pdf to dispense important information. This template comprises six stages. It also presents valuable insights into the topics including action planning, evaluate data, collect relevant data. This is a completely customizable PowerPoint theme that can be put to use immediately. So, download it and address the topic impactfully.

5 Piece Wheel For Organization Market Research Ppt Model Styles PDF
Presenting 5 Piece Wheel For Organization Market Research Ppt Model Styles PDF to dispense important information. This template comprises five stages. It also presents valuable insights into the topics including Analyze Your Data, Interpretation Your Result, Visualize Your Data. This is a completely customizable PowerPoint theme that can be put to use immediately. So, download it and address the topic impactfully.

6 Piece Wheel For Organization Market Research Ppt Inspiration Graphic Tips PDF
Presenting 6 Piece Wheel For Organization Market Research Ppt Inspiration Graphic Tips PDF to dispense important information. This template comprises six stages. It also presents valuable insights into the topics including Analyze Your Data, Interpretation Your Result, Visualize Your Data. This is a completely customizable PowerPoint theme that can be put to use immediately. So, download it and address the topic impactfully.

7 Piece Wheel For Organization Market Research Ppt Infographic Template Design Templates PDF
Presenting 7 Piece Wheel For Organization Market Research Ppt Infographic Template Design Templates PDF to dispense important information. This template comprises seven stages. It also presents valuable insights into the topics including Analyze Your Data, Interpretation Your Result, Visualize Your Data. This is a completely customizable PowerPoint theme that can be put to use immediately. So, download it and address the topic impactfully.

8 Piece Wheel For Organization Market Research Ppt Ideas Shapes PDF
Presenting 8 Piece Wheel For Organization Market Research Ppt Ideas Shapes PDF to dispense important information. This template comprises eight stages. It also presents valuable insights into the topics including Analyze Your Data, Interpretation Your Result, Visualize Your Data. This is a completely customizable PowerPoint theme that can be put to use immediately. So, download it and address the topic impactfully.

9 Piece Wheel For Organization Market Research Ppt Portfolio Layouts PDF
Presenting 9 Piece Wheel For Organization Market Research Ppt Portfolio Layouts PDF to dispense important information. This template comprises nine stages. It also presents valuable insights into the topics including Analyze Your Data, Interpretation Your Result, Visualize Your Data. This is a completely customizable PowerPoint theme that can be put to use immediately. So, download it and address the topic impactfully.

10 Piece Wheel For Organization Market Research Ppt File Samples PDF
Presenting 10 Piece Wheel For Organization Market Research Ppt File Samples PDF to dispense important information. This template comprises ten stages. It also presents valuable insights into the topics including Analyze Your Data, Interpretation Your Result, Visualize Your Data. This is a completely customizable PowerPoint theme that can be put to use immediately. So, download it and address the topic impactfully.

11 Piece Wheel For Organization Market Research Ppt Styles Graphics Example PDF
Presenting 11 Piece Wheel For Organization Market Research Ppt Styles Graphics Example PDF to dispense important information. This template comprises eleven stages. It also presents valuable insights into the topics including Analyze Your Data, Interpretation Your Result, Visualize Your Data. This is a completely customizable PowerPoint theme that can be put to use immediately. So, download it and address the topic impactfully.

12 Piece Wheel For Organization Market Research Ppt Layouts Layout PDF
Presenting 12 Piece Wheel For Organization Market Research Ppt Layouts Layout PDF to dispense important information. This template comprises tweleve stages. It also presents valuable insights into the topics including Analyze Your Data, Interpretation Your Result, Visualize Your Data. This is a completely customizable PowerPoint theme that can be put to use immediately. So, download it and address the topic impactfully.

Business Diagram Four Options Layout Diagram For Business Presentation Template
Four options circular diagram is used to design this power point template. This business diagram can be used to compare and present data. Use this diagram to make your presentations more effective.

Planned Statistics Assessment Template Powerpoint Themes
This is a planned statistics assessment template powerpoint themes. This is a eight stage process. The stages in this process are cleanse, group, stakeholder and users, technology and infrastructure, process and data, analyze, validate, collect.

Business Diagram Four Staged Gears Process Diagram Presentation Template
This business slide depicts four staged gears process diagram. This diagram can help by summarizing the key features of the data. Use this editable diagram for your business and management related presentations.

Mobile Relationship Management Diagram Presentation Powerpoint Templates
This is a mobile relationship management diagram presentation powerpoint templates. This is a four stage process. The stages in this process are strategy, execution, data, transaction, engagement, awareness, loyalty.

Chart Illustrating Manufacturing Plant Energy Consumption Statistics Slides PDF
This graph or chart is linked to excel, and changes automatically based on data. Just left click on it and select edit data. Pitch your topic with ease and precision using this Chart Illustrating Manufacturing Plant Energy Consumption Statistics Slides PDF. This layout presents information on Equipment Inefficiency, Process Heating, Energy Export. It is also available for immediate download and adjustment. So, changes can be made in the color, design, graphics or any other component to create a unique layout.
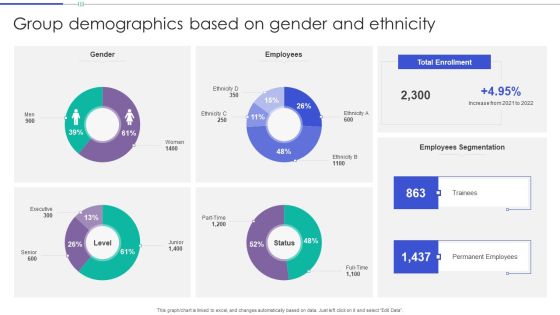
Group Demographics Based On Gender And Ethnicity Themes PDF
This graph or chart is linked to excel, and changes automatically based on data. Just left click on it and select Edit Data. Showcasing this set of slides titled Group Demographics Based On Gender And Ethnicity Themes PDF. The topics addressed in these templates are Gender, Employees, Total Enrollment. All the content presented in this PPT design is completely editable. Download it and make adjustments in color, background, font etc. as per your unique business setting.

Construction Management Dashboard With Productivity And Worked Hours Themes PDF
This graph for chart is linked to excel, and changes automatically based on data. Just left click on it and select Edit Data. Deliver an awe inspiring pitch with this creative Construction Management Dashboard With Productivity And Worked Hours Themes PDF bundle. Topics like Teams, Employees, Overall Construction Management Efficiency, Remuneration, Work Environment can be discussed with this completely editable template. It is available for immediate download depending on the needs and requirements of the user.

Automobile Sales Scorecard Scorecard For Global Auto Sales Themes PDF
This graph or chart is linked to excel, and changes automatically based on data. Just left click on it and select Edit Data. Deliver and pitch your topic in the best possible manner with this Automobile Sales Scorecard Scorecard For Global Auto Sales Themes PDF. Use them to share invaluable insights on Scorecard For Global, Auto Sales Global and impress your audience. This template can be altered and modified as per your expectations. So, grab it now.

Business Diagram Four Staged Circular Gear Diagram For Process Control Presentation Template
This business slide depicts four staged circular gears diagram. This diagram can help by summarizing the key features of the data. Use this editable diagram for your business and management related presentations.

Planned Statistics Assessment Template Ppt Diagrams
This is a planned statistics assessment template ppt diagrams. This is a eight stage process. The stages in this process are quality context, competitors, stakeholders and users, processes and data, resources, evaluation, tools and techniques, structure.
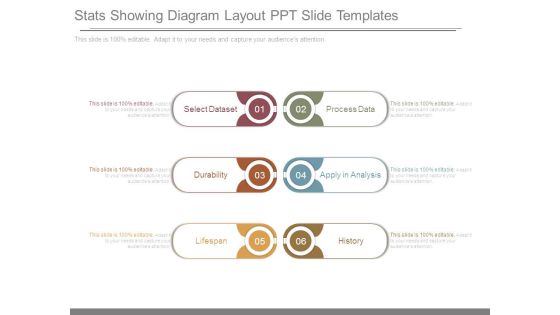
Stats Showing Diagram Layout Ppt Slide Templates
This is a stats showing diagram layout ppt slide templates. This is a six stage process. The stages in this process are select dataset, durability, lifespan, process data, apply in analysis, history.
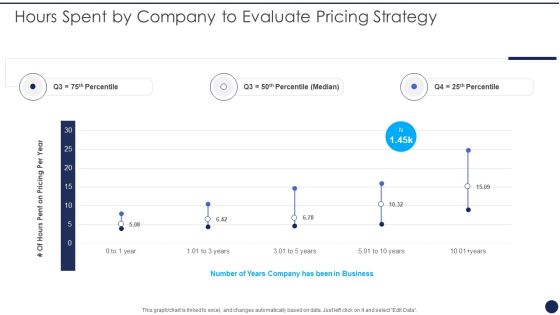
Hours Spent By Company To Evaluate Pricing Strategy Product Pricing Strategies Analysis Themes PDF
This graph or chart is linked to excel, and changes automatically based on data. Just left click on it and select Edit Data. Deliver and pitch your topic in the best possible manner with this Hours Spent By Company To Evaluate Pricing Strategy Product Pricing Strategies Analysis Themes PDF. Use them to share invaluable insights on Pricing Per Year, Number Years Business and impress your audience. This template can be altered and modified as per your expectations. So, grab it now.
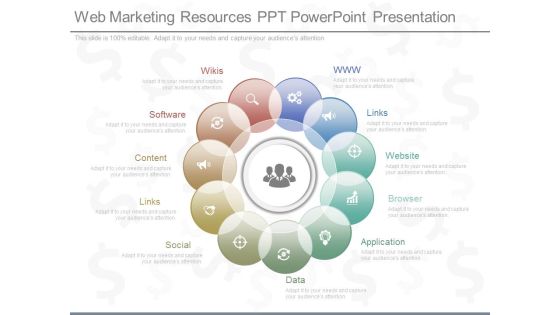
Web Marketing Resources Ppt Powerpoint Presentation
This is a web marketing resources ppt powerpoint presentation. This is a eleven stage process. The stages in this process are www, links, website, browser, application, data, social, links, content, software, wikis.
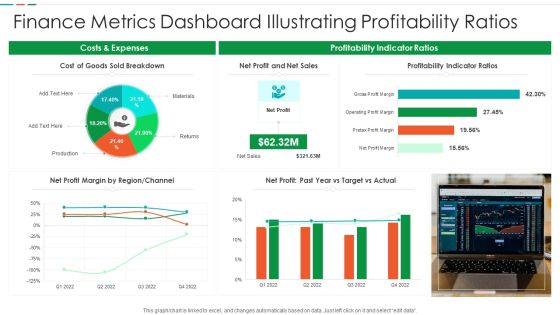
Finance Metrics Dashboard Illustrating Profitability Ratios Diagrams PDF
This graph or chart is linked to excel, and changes automatically based on data. Just left click on it and select edit data. Pitch your topic with ease and precision using this Finance Metrics Dashboard Illustrating Profitability Ratios Diagrams PDF. This layout presents information on Cost Goods Sold, Net Profit Net, Sales Profitability Indicator. It is also available for immediate download and adjustment. So, changes can be made in the color, design, graphics or any other component to create a unique layout.
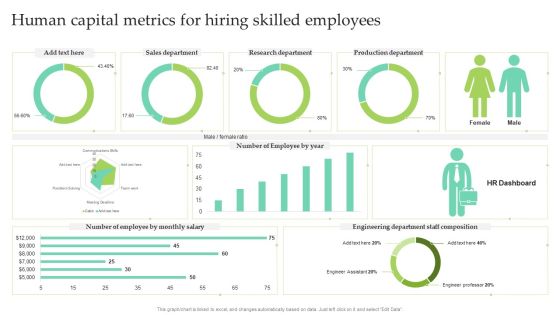
Human Capital Metrics For Hiring Skilled Employees Ppt Slides Themes PDF
This graph or chart is linked to excel, and changes automatically based on data. Just left click on it and select Edit Data. Showcasing this set of slides titled Human Capital Metrics For Hiring Skilled Employees Ppt Slides Themes PDF. The topics addressed in these templates are Sales Department, Research Department, Production Department. All the content presented in this PPT design is completely editable. Download it and make adjustments in color, background, font etc. as per your unique business setting.

Active Approval Salesforce Layout Powerpoint Themes
This is a active approval salesforce layout powerpoint themes. This is a five stage process. The stages in this process are proposal management, vision and strategy, technology and data, configuration and pricing, approvals management.
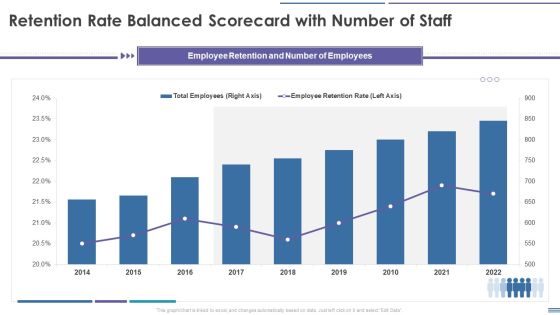
Staff Retention Balanced Scorecard Retention Rate Balanced Scorecard With Number Of Staff Diagrams PDF
This graph or chart is linked to excel, and changes automatically based on data. Just left click on it and select Edit Data. Deliver an awe inspiring pitch with this creative Staff Retention Balanced Scorecard Retention Rate Balanced Scorecard With Number Of Staff Diagrams PDF bundle. Topics like Total Employees, Employee Retention Rate, 2014 To 2022 can be discussed with this completely editable template. It is available for immediate download depending on the needs and requirements of the user.

Hr Accomplishment Framework Template Powerpoint Slide Themes
This is a hr accomplishment framework template powerpoint slide themes. This is a six stage process. The stages in this process are meet with org leadership, assimilate, analyze data, implement, collaborate and discuss, discover.

Comprehensive Guide For Launch Sales By Lead Source Performance Indicator Inspiration PDF
This graph or chart is linked to excel, and changes automatically based on data. Just left click on it and select Edit Data. The Comprehensive Guide For Launch Sales By Lead Source Performance Indicator Inspiration PDF is a compilation of the most recent design trends as a series of slides. It is suitable for any subject or industry presentation, containing attractive visuals and photo spots for businesses to clearly express their messages. This template contains a variety of slides for the user to input data, such as structures to contrast two elements, bullet points, and slides for written information. Slidegeeks is prepared to create an impression.

Business Diagram Five Staged Business Points Display Text Box Diagram Presentation Template
This Power Point template slide has been designed with graphic of five staged text box diagrams. This PPT slide can be used for displaying business data. Use this PPT slide for your business presentations and get good remarks.

Chart Showing Food Branding Platforms Ppt Summary Gridlines PDF
This graph or chart is linked to excel, and changes automatically based on data. Just left click on it and select Edit Data. Showcasing this set of slides titled chart showing food branding platforms ppt summary gridlines pdf. The topics addressed in these templates are chart showing food branding platforms. All the content presented in this PPT design is completely editable. Download it and make adjustments in color, background, font etc. as per your unique business setting.

Hiring Agency Profile With Financial Charts Ppt Model Example PDF
This graph or chart is linked to excel, and changes automatically based on data. Just left click on it and select edit data. Pitch your topic with ease and precision using this hiring agency profile with financial charts ppt model example pdf. This layout presents information on revenue, operating income, operating margin, satisfaction rate. It is also available for immediate download and adjustment. So, changes can be made in the color, design, graphics or any other component to create a unique layout.

Web Mapping Diagram Powerpoint Templates
This is a web mapping diagram powerpoint templates. This is a six stage process. The stages in this process are spatial data, prepare response, user request, information, geography, web mapping.
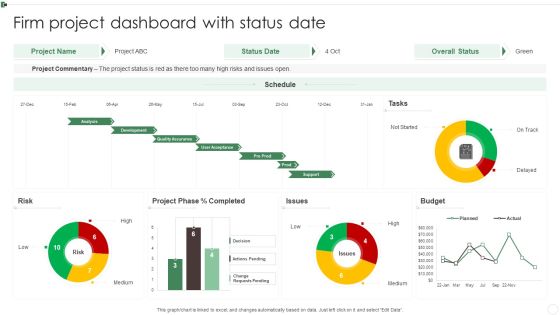
Firm Project Dashboard With Status Date Ppt Infographics Slides PDF
This graph or chart is linked to excel, and changes automatically based on data. Just left click on it and select Edit Data. Pitch your topic with ease and precision using this Firm Project Dashboard With Status Date Ppt Infographics Slides PDF. This layout presents information on Project Commentary, Budget, Project Phase, Risk. It is also available for immediate download and adjustment. So, changes can be made in the color, design, graphics or any other component to create a unique layout.

Professional Services Support Diagram Presentation Visual Aids
This is a professional services support diagram presentation visual aids. This is a five stage process. The stages in this process are statistical models, gather data, enrollment, capacity, boundaries.
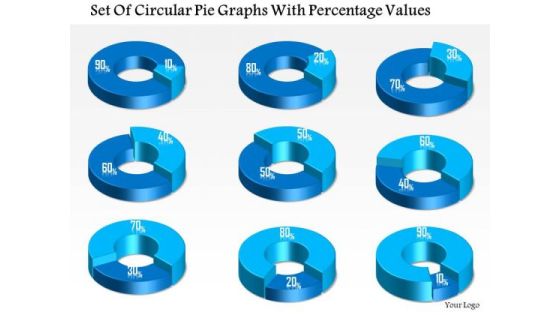
Business Diagram Set Of Circular Pie Graphs With Percentage Values Presentation Template
This business diagram displays set of pie charts. This Power Point template has been designed to compare and present business data. Download this diagram to represent stages of business growth.
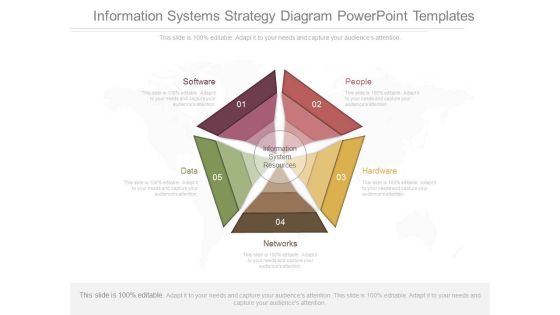
Information Systems Strategy Diagram Powerpoint Templates
This is a information systems strategy diagram powerpoint templates. This is a five stage process. The stages in this process are software, people, hardware, data, networks, information system resources.

Website Traffic Analysis Diagram Presentation Layouts
This is a website traffic analysis diagram presentation layouts. This is a four stage process. The stages in this process are keywords used, design analysis, define goals, collect data, web analysis process.
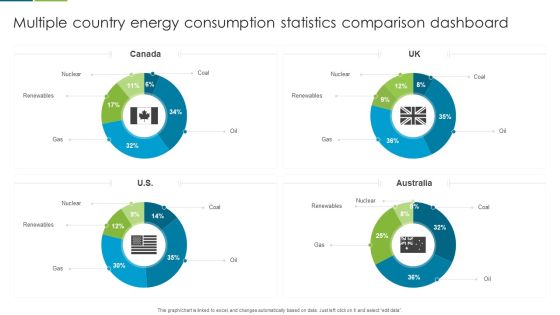
Multiple Country Energy Consumption Statistics Comparison Dashboard Formats PDF
This graph or chart is linked to excel, and changes automatically based on data. Just left click on it and select edit data. Pitch your topic with ease and precision using this Multiple Country Energy Consumption Statistics Comparison Dashboard Formats PDF. This layout presents information on Nuclear, Renewables, Gas. It is also available for immediate download and adjustment. So, changes can be made in the color, design, graphics or any other component to create a unique layout.

Local Level Intelligence Diagram Powerpoint Slide Download
This is a local level intelligence diagram powerpoint slide download. This is a six stage process. The stages in this process are technology variables, site specific, data, local level intelligence, technology infrastructure, product service category, competitive landscape study.
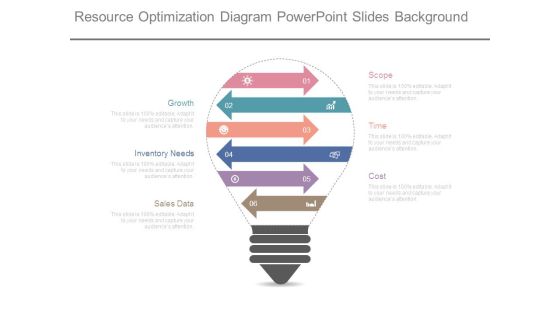
Resource Optimization Diagram Powerpoint Slides Background
This is a resource optimization diagram powerpoint slides background. This is a six stage process. The stages in this process are scope, time, cost, growth, inventory needs, sales data.
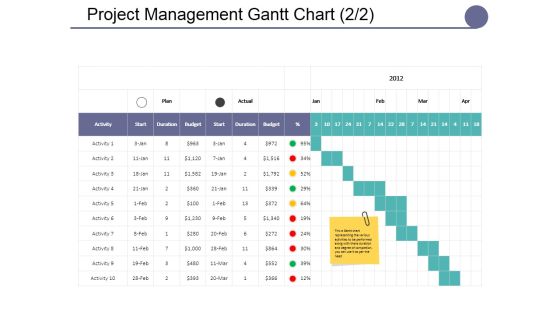
Project Management Gantt Chart Template Ppt PowerPoint Presentation Summary Master Slide
This is a project management gantt chart template ppt powerpoint presentation summary master slide. This is a seven stage process. The stages in this process are lists, table, data, management, marketing.

Cyber Security Response Sample Diagram Powerpoint Images
This is a cyber security response sample diagram powerpoint images. This is a eight stage process. The stages in this process are preparation, containment and remediation, malware analysis, campaigns, cyber security, log and event data, advertise, tools and tactics.
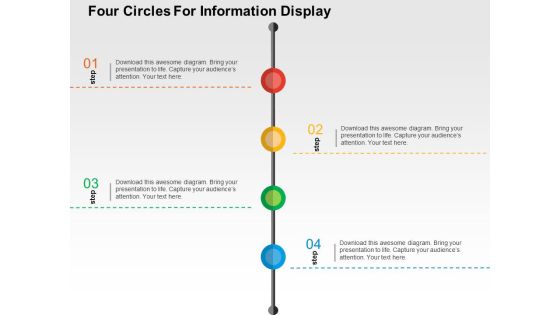
Four Circles For Information Display Powerpoint Templates
This PowerPoint slide contains graphics of four circles. This professional slide may be used for visual explanation of data. Adjust the above diagram in your business presentations to give professional impact.
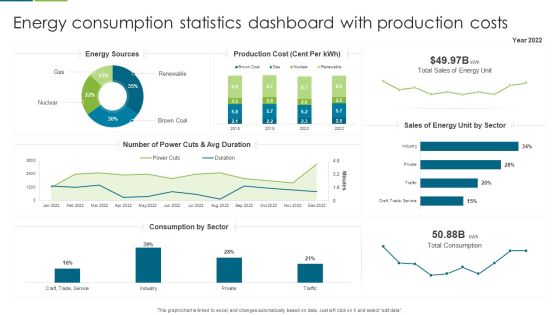
Energy Consumption Statistics Dashboard With Production Costs Slides PDF
This graph or chart is linked to excel, and changes automatically based on data. Just left click on it and select edit data. Showcasing this set of slides titled Energy Consumption Statistics Dashboard With Production Costs Slides PDF. The topics addressed in these templates are Production Cost, Sales Energy, Number Power. All the content presented in this PPT design is completely editable. Download it and make adjustments in color, background, font etc. as per your unique business setting.

Energy Consumption Statistics Dashboard With Yearly Savings Guidelines PDF
This graph or chart is linked to excel, and changes automatically based on data. Just left click on it and select edit data. Showcasing this set of slides titled Energy Consumption Statistics Dashboard With Yearly Savings Guidelines PDF. The topics addressed in these templates are Production Consumption, Energy Savings, Performance Ratio. All the content presented in this PPT design is completely editable. Download it and make adjustments in color, background, font etc. as per your unique business setting.

Business Administration Diagram Ppt Background Template
This is a business administration diagram ppt background template. This is a eight stage process. The stages in this process are business, consumer, knowledge, data, wisdom, information, administration, increased complexity.
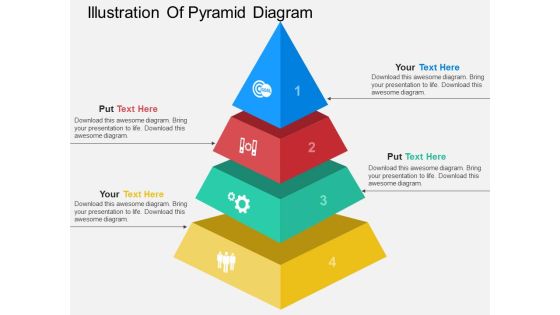
Illustration Of Pyramid Diagram Powerpoint Template
This PowerPoint slide contains illustration of pyramid diagram. This professional slide may be used for visual explanation of data. Adjust the above diagram in your business presentations to give professional impact.
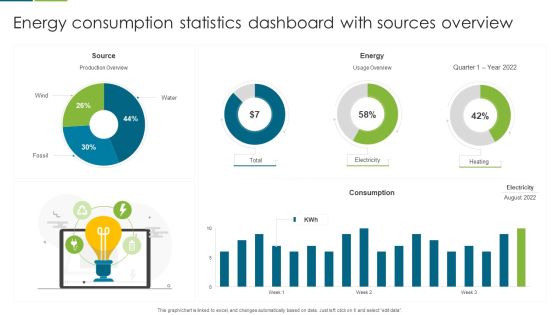
Energy Consumption Statistics Dashboard With Sources Overview Template PDF
This graph or chart is linked to excel, and changes automatically based on data. Just left click on it and select edit data. Pitch your topic with ease and precision using this Energy Consumption Statistics Dashboard With Sources Overview Template PDF. This layout presents information on Source, Energy, Consumption. It is also available for immediate download and adjustment. So, changes can be made in the color, design, graphics or any other component to create a unique layout.

Prevention Of Information Major Statistics Of Cyber Security Awareness Pictures PDF
This graph or chart is linked to excel, and changes automatically based on data. Just left click on it and select Edit Data. There are so many reasons you need a Prevention Of Information Major Statistics Of Cyber Security Awareness Pictures PDF. The first reason is you cant spend time making everything from scratch, Thus, Slidegeeks has made presentation templates for you too. You can easily download these templates from our website easily.
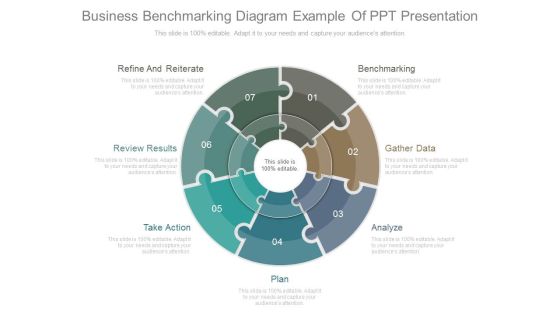
Business Benchmarking Diagram Example Of Ppt Presentation
This is a business benchmarking diagram example of ppt presentation. This is a seven stage process. The stages in this process are refine and reiterate, review results, take action, plan, analyze, gather data, benchmarking.
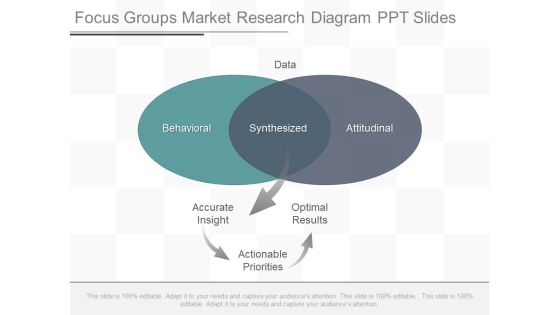
Focus Groups Market Research Diagram Ppt Slides
This is a focus groups market research diagram ppt slides. This is a two stage process. The stages in this process are data, behavioral, synthesized, attitudinal, accurate insight, optimal results, actionable priorities.
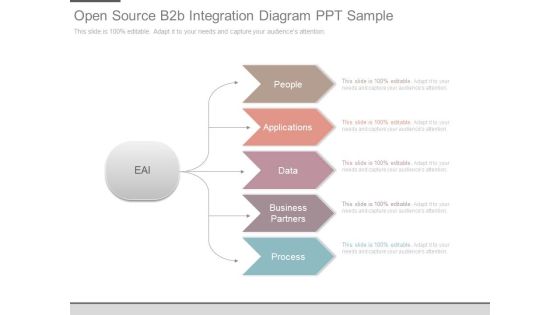
Open Source B2b Integration Diagram Ppt Sample
This is a open source b2b integration diagram ppt sample. This is a five stage process. The stages in this process are eai, people, applications, data, business partners, process.
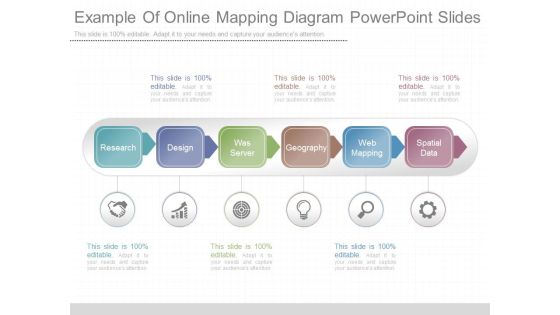
Example Of Online Mapping Diagram Powerpoint Slides
This is a example of online mapping diagram powerpoint slides. This is a six stage process. The stages in this process are research, design, was server, geography, web mapping, spatial data.

Production Process Management Flow Diagram Presentation Layouts
This is a production process management flow diagram presentation layouts. This is a six stage process. The stages in this process are report result, report collect scrap data, receiving, customer, purchasing, shipping, process flow.

Strategic Promotions Ppt Diagram Powerpoint Topics
This is a strategic promotions ppt diagram powerpoint topics. This is a seven stage process. The stages in this process are brand identity, new market penetration, develop vision, research best practices, long term planning, short term planning, synthesize data.
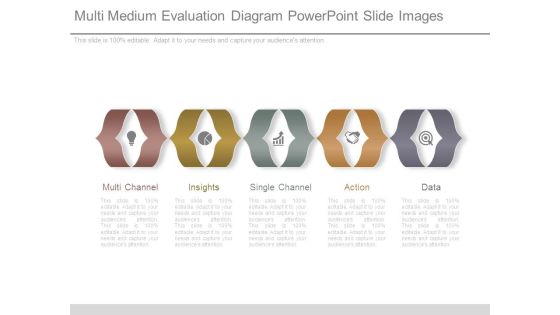
Multi Medium Evaluation Diagram Powerpoint Slide Images
This is a multi medium evaluation diagram powerpoint slide images. This is a five stage process. The stages in this process are multi channel, insights, single channel, action, data.
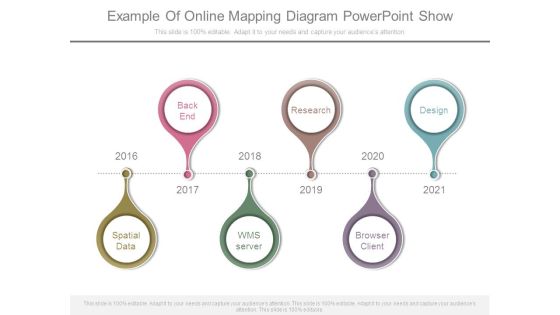
Example Of Online Mapping Diagram Powerpoint Show
This is a example of online mapping diagram powerpoint show. This is a six stage process. The stages in this process are back end, research, design, spatial data, wms server, browser client.

Moving Inventory Checklist Diagram Presentation Pictures
This is a moving inventory checklist diagram presentation pictures. This is a five stage process. The stages in this process are store inventory data, set order quantities, logistics, consumer, supplier.

Sop Strategic Plan Ppt Diagram Ppt Example
This is a sop strategic plan ppt diagram ppt example. This is a six stage process. The stages in this process are demand planning, inventory and supply planning, strategic plans, broad capacity planning, master planning, gather data.

Alertness Establishment Strategy Diagram Sample Ppt Files
This is a alertness establishment strategy diagram sample ppt files. This is a five stage process. The stages in this process are self awareness, sensory data, feeling, thoughts, areas of development.

Automating Process Diagram Example Of Ppt
This is a automating process diagram example of ppt. This is a five stage process. The stages in this process are manage and control, capture data, define scope of automation, test tools selection, test execution.
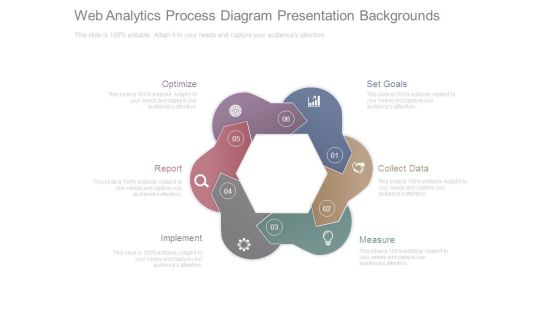
Web Analytics Process Diagram Presentation Backgrounds
This is a web analytics process diagram presentation backgrounds. This is a six stage process. The stages in this process are optimize, report, implement, measure, collect data, set goals.

Graphical Assessment Diagram Powerpoint Slide Show
This is a graphical assessment diagram powerpoint slide show. This is a five stage process. The stages in this process are deliver, business problem, get data, find structure, develop insight.

Chart Showing Outline Of Online Drug Delivery Systems Market Ppt PowerPoint Presentation File Clipart PDF
This graph or chart is linked to excel, and changes automatically based on data. Just left click on it and select edit data. Showcasing this set of slides titled chart showing outline of online drug delivery systems market ppt powerpoint presentation file clipart pdf. The topics addressed in these templates are technological, development, growth. All the content presented in this PPT design is completely editable. Download it and make adjustments in color, background, font etc. as per your unique business setting.
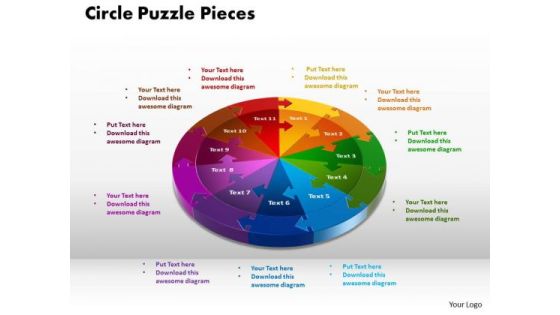
PowerPoint Designs Circle Puzzle Pieces Education Ppt Presentation
PowerPoint Designs Circle Puzzle Pieces Education PPT Presentation-This diagram is a graphical illustration of the relationships between and among sets of data, groups of objects.-PowerPoint Designs Circle Puzzle Pieces Education PPT Presentation
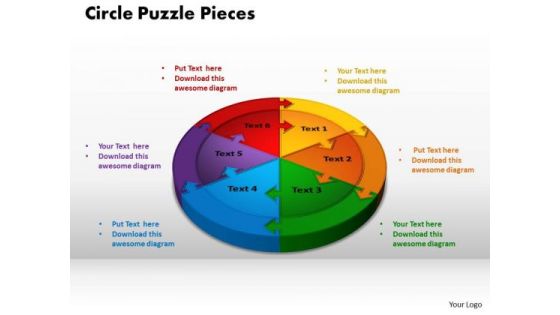
PowerPoint Process Circle Puzzle Pieces Success Ppt Presentation
PowerPoint Process Circle Puzzle Pieces Success PPT Presentation-This diagram is a graphical illustration of the relationships between and among sets of data, groups of objects.-PowerPoint Process Circle Puzzle Pieces Success PPT Presentation

PowerPoint Process Circle Puzzle Pieces Success Ppt Template
PowerPoint Process Circle Puzzle Pieces Success PPT Template-This diagram is a graphical illustration of the relationships between and among sets of data, groups of objects.-PowerPoint Process Circle Puzzle Pieces Success PPT Template
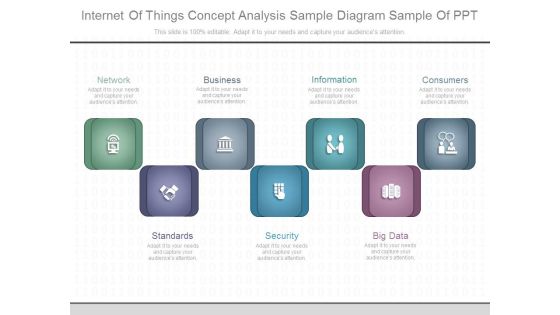
Internet Of Things Concept Analysis Sample Diagram Sample Of Ppt
This is a internet of things concept analysis sample diagram sample of ppt. This is a seven stage process. The stages in this process are network, business, information, consumers, standards, security, big data.

Construction Management Dashboard With Project Phases And Performance Inspiration PDF
This graph for chart is linked to excel, and changes automatically based on data. Just left click on it and select Edit Data. Deliver and pitch your topic in the best possible manner with this Construction Management Dashboard With Project Phases And Performance Inspiration PDF. Use them to share invaluable insights on Project Cost Performance, Actual Cost, Project Performance, Timeline VS Resource Capacity, Time vs Project Phase and impress your audience. This template can be altered and modified as per your expectations. So, grab it now.

Annual Training Schedule Bar Chart For Business Ppt PowerPoint Presentation File Infographics PDF
This graph chart is linked to excel, and changes automatically based on data. Just left click on it and select Edit Data. Showcasing this set of slides titled annual training schedule bar chart for business ppt powerpoint presentation file infographics pdf. The topics addressed in these templates are trainings, employees, competent officers. All the content presented in this PPT design is completely editable. Download it and make adjustments in color, background, font etc. as per your unique business setting.
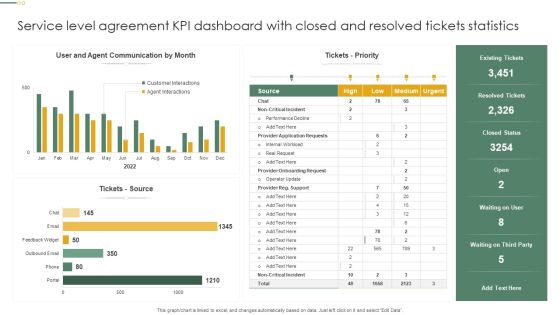
Service Level Agreement KPI Dashboard With Closed And Resolved Tickets Statistics Inspiration PDF
This graph or chart is linked to excel, and changes automatically based on data. Just left click on it and select Edit Data. Showcasing this set of slides titled Service Level Agreement KPI Dashboard With Closed And Resolved Tickets Statistics Inspiration PDF. The topics addressed in these templates are Tickets Priority, Tickets Source, Resolved Tickets. All the content presented in this PPT design is completely editable. Download it and make adjustments in color, background, font etc. as per your unique business setting.
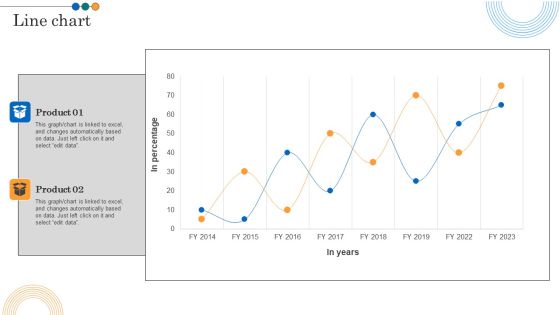
Implementing Marketing Strategies Line Chart Ppt PowerPoint Presentation File Mockup PDF
This graph or chart is linked to excel, and changes automatically based on data. Just left click on it and select edit data. There are so many reasons you need a Implementing Marketing Strategies Line Chart Ppt PowerPoint Presentation File Mockup PDF. The first reason is you can not spend time making everything from scratch, Thus, Slidegeeks has made presentation templates for you too. You can easily download these templates from our website easily.
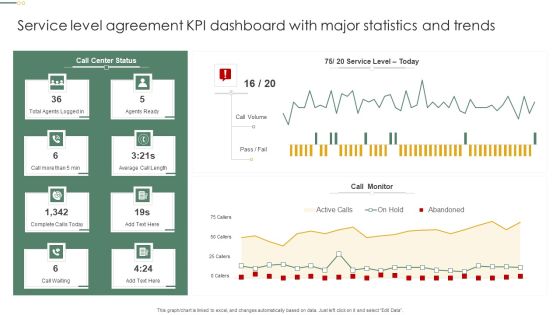
Service Level Agreement KPI Dashboard With Major Statistics And Trends Pictures PDF
This graph or chart is linked to excel, and changes automatically based on data. Just left click on it and select Edit Data. Pitch your topic with ease and precision using this Service Level Agreement KPI Dashboard With Major Statistics And Trends Pictures PDF. This layout presents information on Call Monitor, Call Volume, Agents Ready. It is also available for immediate download and adjustment. So, changes can be made in the color, design, graphics or any other component to create a unique layout.

Automobile Sales Scorecard With Unit Sold And Average Price Statistics Formats PDF
This graph or chart is linked to excel, and changes automatically based on data. Just left click on it and select Edit Data. Deliver an awe inspiring pitch with this creative Automobile Sales Scorecard With Unit Sold And Average Price Statistics Formats PDF bundle. Topics like Automobile Sales Scorecard, Unit Sold Revenue, Average Price Statistics can be discussed with this completely editable template. It is available for immediate download depending on the needs and requirements of the user.

Security Monitoring Dashboard With Application Control And Operating System Statistics Template PDF
This graph or chart is linked to excel, and changes automatically based on data. Just left click on it and select Edit Data. Deliver and pitch your topic in the best possible manner with this security monitoring dashboard with application control and operating system statistics template pdf. Use them to share invaluable insights on application control, restrict office macros, application patching, application hardening and impress your audience. This template can be altered and modified as per your expectations. So, grab it now.

Sales Process Workflow Funnel Diagram Ppt PowerPoint Presentation Microsoft
This is a sales process workflow funnel diagram ppt powerpoint presentation microsoft. This is a three stage process. The stages in this process are html, click stream, social, email, sensor data, database, location, images.

Analysis Plan For E Commerce Promotion Tactics Multistep Process To Conduct Social Media Audit Themes PDF
This slide reflects the multistep process to effectively conduct the social media audit. The major steps discussed here gather data, set performance benchmarks, analyze data, highlight gaps and recommendations for improvements. This slide reflects the multistep process to effectively conduct the social media audit. The major steps discussed here gather data, set performance benchmarks, analyze data, highlight gaps and recommendations for improvements. Want to ace your presentation in front of a live audience Our Analysis Plan For E Commerce Promotion Tactics Multistep Process To Conduct Social Media Audit Themes PDF can help you do that by engaging all the users towards you. Slidegeeks experts have put their efforts and expertise into creating these impeccable powerpoint presentations so that you can communicate your ideas clearly. Moreover, all the templates are customizable, and easy to edit and downloadable. Use these for both personal and commercial use.

Set Of Seven Vertical Steps Powerpoint Templates
This PowerPoint slide contains graphics of seven vertical steps. This professional slide may be used for visual explanation of data. Adjust the above diagram in your business presentations to give professional impact.

Set Of Six Vertical Steps Powerpoint Templates
This PowerPoint slide contains graphics of six vertical steps. This professional slide may be used for visual explanation of data. Adjust the above diagram in your business presentations to give professional impact.
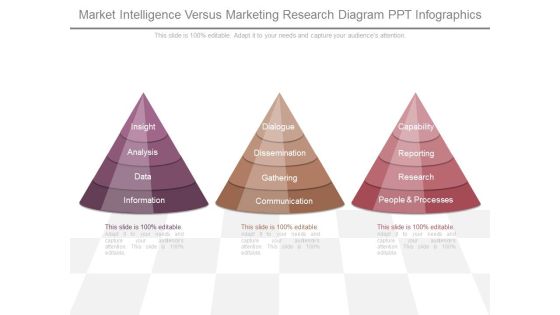
Market Intelligence Versus Marketing Research Diagram Ppt Infographics
This is a market intelligence versus marketing research diagram ppt infographics. This is a three stage process. The stages in this process are insight, analysis, data, information, dialogue, dissemination, gathering, communication, capability, reporting, research, people and processes.
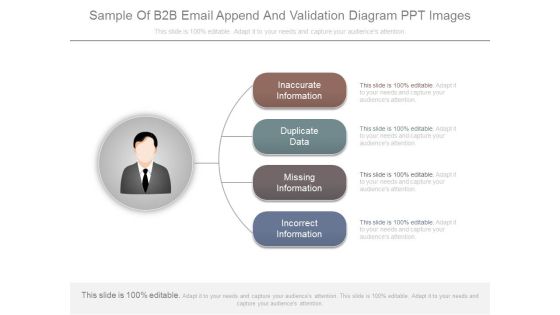
Sample Of B2b Email Append And Validation Diagram Ppt Images
This is a sample of b2b email append and validation diagram ppt images. This is a four stage process. The stages in this process are inaccurate information, duplicate data, missing information, incorrect information.

Standards For Web Intelligence Sample Diagram Ppt Powerpoint Slides
This is a standards for web intelligence sample diagram ppt powerpoint slides. This is a five stage process. The stages in this process are web, web data, information, knowledge, wisdom.

Business Diagram Business Plan With Five Options Presentation Template
This business slide helps to displays business plan with five options. This diagram can help by summarizing the key features of the data. Use this editable diagram for your business and management related presentations.
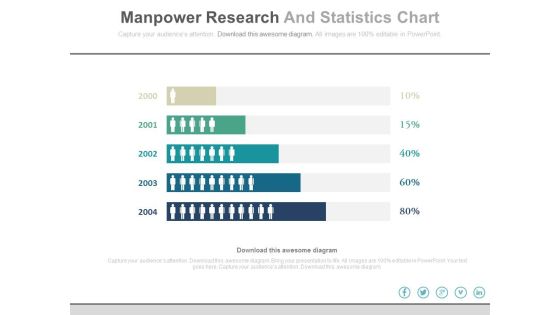
Manpower Research And Statistics Chart Powerpoint Slides
This PowerPoint template has been designed with yearly statistical chart with men icons. This PPT slide may be used for manpower research. Download this slide to build unique presentation.

Business Diagram Circles For Percentage Growth Presentation Template
This business slide has been designed with graphics of circles. You may download this diagram to display percentage growth data. This template is innovatively designed to highlight your worthy views
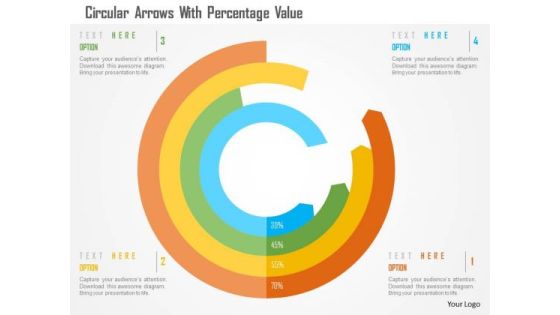
Business Diagram Circular Arrows With Percentage Value Presentation Template
This business slide has been designed with circular arrows. You may download this diagram to display percentage growth data. This template is innovatively designed to highlight your worthy views
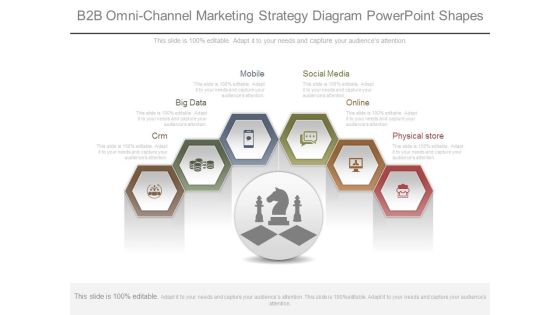
B2b Omni Channel Marketing Strategy Diagram Powerpoint Shapes
This is a b2b omni channel marketing strategy diagram powerpoint shapes. This is a six stage process. The stages in this process are crm, big data, mobile, social media, online, physical store.
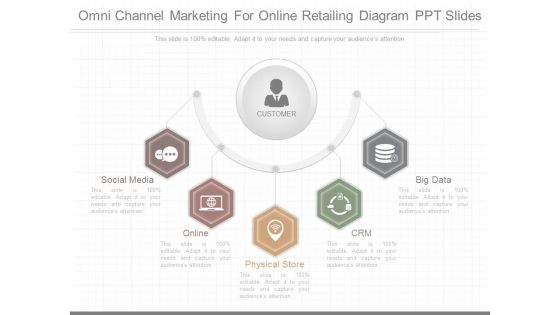
Omni Channel Marketing For Online Retailing Diagram Ppt Slides
This is a omni channel marketing for online retailing diagram ppt slides. This is a five stage process. The stages in this process are social media, online, physical store, crm, big data.
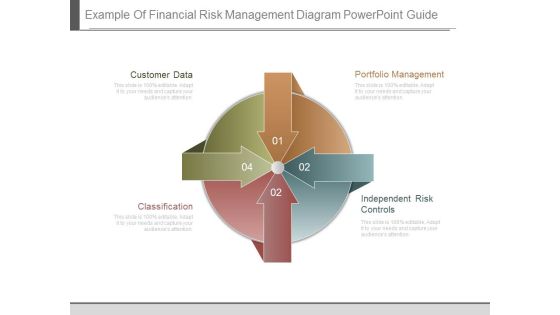
Example Of Financial Risk Management Diagram Powerpoint Guide
This is a example of financial risk management diagram powerpoint guide. This is a four stage process. The stages in this process are customer data, portfolio management, classification, independent risk controls.

Customer Value Management Framework Diagram Ppt Example 2015
This is a customer value management framework diagram ppt example 2015. This is a seven stage process. The stages in this process are closed loop cvm process, evaluate campaigns, generate insights, price, analyze data, service, product, execute campaigns.
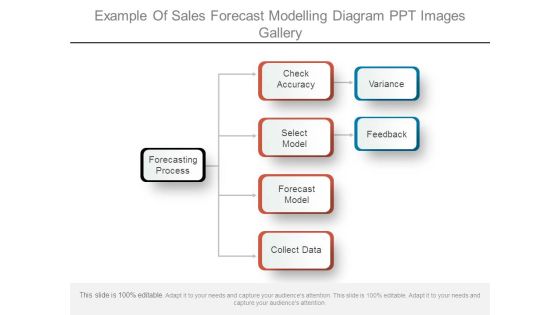
Example Of Sales Forecast Modelling Diagram Ppt Images Gallery
This is a example of sales forecast modelling diagram ppt images gallery. This is a three stage process. The stages in this process are forecasting process, check accuracy, select model, forecast model, collect data, variance, feedback.
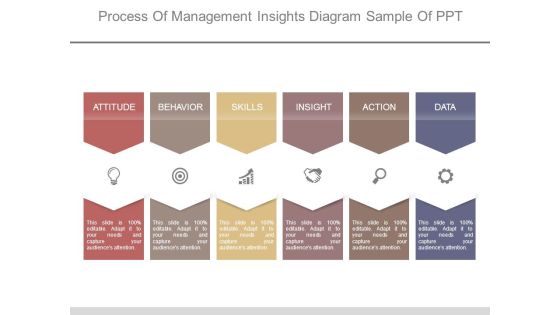
Process Of Management Insights Diagram Sample Of Ppt
This is a process of management insights diagram sample of ppt. This is a six stage process. The stages in this process are attitude, behavior, skills, insight, action, data.
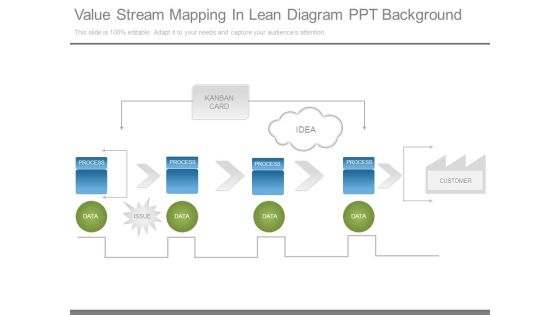
Value Stream Mapping In Lean Diagram Ppt Background
This is a value stream mapping in lean diagram ppt background. This is a four stage process. The stages in this process are kanban card, idea, process, customer, data, issue.

Appliances Energy And Cost Consumption Statistics Dashboard Download PDF
This graph or chart is linked to excel, and changes automatically based on data. Just left click on it and select edit data. Presenting Appliances Energy And Cost Consumption Statistics Dashboard Download PDF to dispense important information. This template comprises ten stages. It also presents valuable insights into the topics including Water Heater, Electric Vehicle, Pool Pump. This is a completely customizable PowerPoint theme that can be put to use immediately. So, download it and address the topic impactfully.
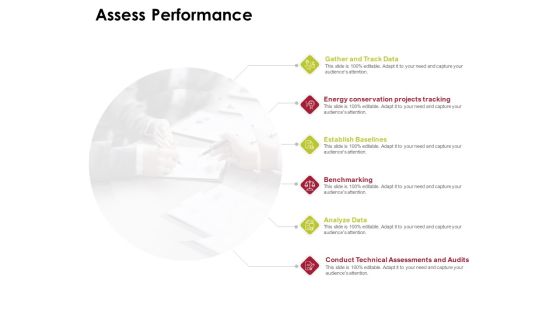
Power Management System And Technology Assess Performance Diagrams PDF
Presenting this set of slides with name power management system and technology assess performance diagrams pdf. This is a six stage process. The stages in this process are gather and track data, energy conservation projects tracking, establish baselines, benchmarking, analyze data, conduct technical assessments and audits. This is a completely editable PowerPoint presentation and is available for immediate download. Download now and impress your audience.
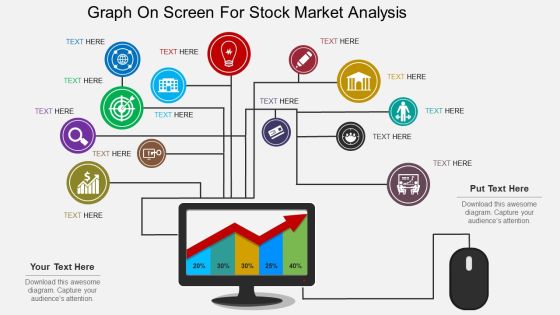
Graph On Screen For Stock Market Analysis Powerpoint Template
This PowerPoint slide contains computer screen with business graph. This professional slide may be used for visual explanation of data. Adjust the above diagram in your business presentations to give professional impact.
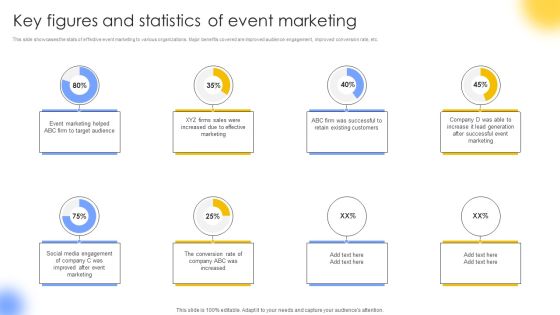
Key Figures And Statistics Of Event Marketing Portrait PDF
This slide showcases the stats of effective event marketing to various organizations. Major benefits covered are improved audience engagement, improved conversion rate, etc. If you are looking for a format to display your unique thoughts, then the professionally designed Key Figures And Statistics Of Event Marketing Portrait PDF is the one for you. You can use it as a Google Slides template or a PowerPoint template. Incorporate impressive visuals, symbols, images, and other charts. Modify or reorganize the text boxes as you desire. Experiment with shade schemes and font pairings. Alter, share or cooperate with other people on your work. Download Key Figures And Statistics Of Event Marketing Portrait PDF and find out how to give a successful presentation. Present a perfect display to your team and make your presentation unforgettable.
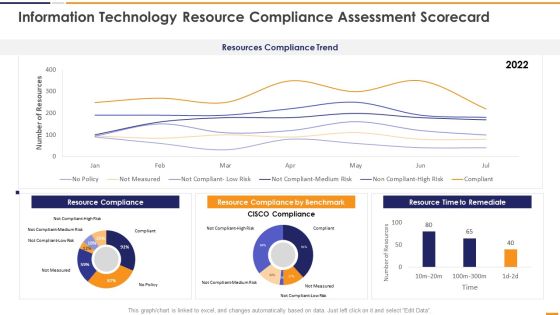
IT Security Evaluation Scorecard Information Technology Resource Compliance Background PDF
This graph or chart is linked to excel, and changes automatically based on data. Just left click on it and select Edit Data. Deliver and pitch your topic in the best possible manner with this IT Security Evaluation Scorecard Information Technology Resource Compliance Background PDF. Use them to share invaluable insights on Resources Compliance Trend, Resource Compliance 2022, Resource Compliance Benchmark, Resource Time Remediate and impress your audience. This template can be altered and modified as per your expectations. So, grab it now.

Approach For Undertaking Commercial Verification System Projects Guidelines PDF
This slide covers hypothesis approach for undertaking commercial due diligence projects which focuses on framing problem, developing working hypothesis, identifying key assumptions, collecting data, analyzing data, drawing conclusions, refining hypothesis, etc. Presenting Approach For Undertaking Commerc Approach For Undertaking Commercial Verification System Projects Guidelines PDF to dispense important information. This template comprises one stages. It also presents valuable insights into the topics including Collecting Information, Analyzing Data, Required. This is a completely customizable PowerPoint theme that can be put to use immediately. So, download it and address the topic impactfully

Circle Of Eight Human Hands With Text Holders Ppt PowerPoint Presentation Pictures Graphics Example
This is a circle of eight human hands with text holders ppt powerpoint presentation pictures graphics example. This is a eight stage process. The stages in this process are human hand with circle of icons, unity hand circle icons, teamwork hand circle of icons.

Circle Of Handprint Signs With Text Holders Ppt PowerPoint Presentation Pictures Template
This is a circle of handprint signs with text holders ppt powerpoint presentation pictures template. This is a four stage process. The stages in this process are human hand with circle of icons, unity hand circle icons, teamwork hand circle of icons.

Three Ways To Manage Trader Risk In Enrollment Summary PDF
This slide contains the information related to the ways of managing merchant risk that he may face during onboarding as well as for the monitoring purpose. It includes gathering actionable data, leverage analytics and rules and ensure comprehensive monitoring approach. Presenting Three Ways To Manage Trader Risk In Enrollment Summary PDF to dispense important information. This template comprises three stages. It also presents valuable insights into the topics including Leverage Analytics, Application Data, External Data. This is a completely customizable PowerPoint theme that can be put to use immediately. So, download it and address the topic impactfully.
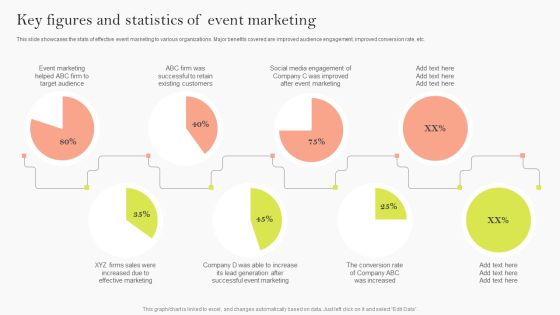
Key Figures And Statistics Of Event Marketing Ppt Backgrounds PDF
This slide showcases the stats of effective event marketing to various organizations. Major benefits covered are improved audience engagement, improved conversion rate, etc. Are you in need of a template that can accommodate all of your creative concepts This one is crafted professionally and can be altered to fit any style. Use it with Google Slides or PowerPoint. Include striking photographs, symbols, depictions, and other visuals. Fill, move around, or remove text boxes as desired. Test out color palettes and font mixtures. Edit and save your work, or work with colleagues. Download Key Figures And Statistics Of Event Marketing Ppt Backgrounds PDF and observe how to make your presentation outstanding. Give an impeccable presentation to your group and make your presentation unforgettable.

Best Practices For Permission Advertising Campaign Mockup PDF
This slide exhibits permission marketing practices to increase customer engagement and conversion rates. It includes four points clearly state privacy policy, prioritize customer data, understand target audience and secure consumer data. Presenting Best Practices For Permission Advertising Campaign Mockup PDF to dispense important information. This template comprises four stages. It also presents valuable insights into the topics including Understand Target Audience, Secure Consumer Data, Prioritize Customer Choice. This is a completely customizable PowerPoint theme that can be put to use immediately. So, download it and address the topic impactfully.

NIST Cybersecurity Framework Compliance Checklist For Organizations Inspiration PDF
The slide showcases a compliance checklist for adhering to standards and regulation. It includes identify relevant data, classify data, develop baseline control, test baseline control, assess for risk control, develop a plan, roll out plan and monitor. Presenting NIST Cybersecurity Framework Compliance Checklist For Organizations Inspiration PDF to dispense important information. This template comprises eight stages. It also presents valuable insights into the topics including Develop Baseline Control, Monitor, Classify Data. This is a completely customizable PowerPoint theme that can be put to use immediately. So, download it and address the topic impactfully.

Kanban Structure For Task Management Ppt Summary Information PDF
This graph or chart is linked to excel, and changes automatically based on data. Just left click on it and select Edit Data. Showcasing this set of slides titled Kanban Structure For Task Management Ppt Summary Information PDF. The topics addressed in these templates are Backlog, In Progress, New Epic Added. All the content presented in this PPT design is completely editable. Download it and make adjustments in color, background, font etc. as per your unique business setting.
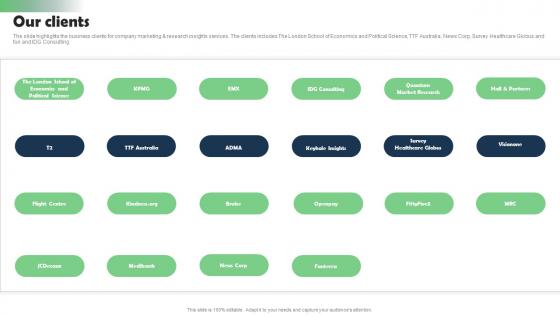
Our Clients Marketing Research Services Management Business Information Pdf
The slide highlights the business clients for company marketing and research insights services. The clients includes The London School of Economics and Political Science, TTF Australia, News Corp, Survey Healthcare Globus and fun and IDG Consulting. Retrieve professionally designed Our Clients Marketing Research Services Management Business Information Pdf to effectively convey your message and captivate your listeners. Save time by selecting pre-made slideshows that are appropriate for various topics, from business to educational purposes. These themes come in many different styles, from creative to corporate, and all of them are easily adjustable and can be edited quickly. Access them as PowerPoint templates or as Google Slides themes. You do not have to go on a hunt for the perfect presentation because Slidegeeks got you covered from everywhere.

BANT Sales Lead Qualification Model Training Budget Template PDF
This graph or chart is linked to excel and change automatically based on data. Just left click on it and select Edit Data. Deliver an awe inspiring pitch with this creative BANT Sales Lead Qualification Model Training Budget Template PDF bundle. Topics like Content Development, Learning Management, Online Learning can be discussed with this completely editable template. It is available for immediate download depending on the needs and requirements of the user.
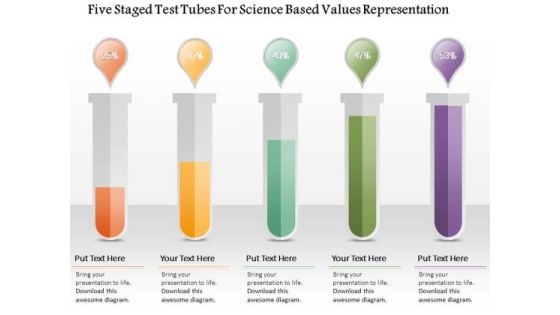
Busines Diagram Five Staged Test Tubes For Science Based Values Representation Ppt Template
Five staged test tubes are used to design this business diagram. This business slide contains the concept of value representation based on scientific data. Ideas are best expressed easily with the help of this diagram slide

Monthly Company Performance Analysiscompetitor Analysis Pictures PDF
This graph or chart is linked to excel, and changes automatically based on data. Just left click on it and select Edit Data. Deliver and pitch your topic in the best possible manner with this monthly company performance analysiscompetitor analysis pictures pdf. Use them to share invaluable insights on revenue, competitor analysis and impress your audience. This template can be altered and modified as per your expectations. So, grab it now.
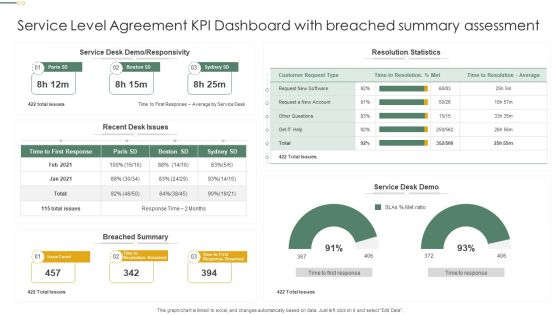
Service Level Agreement KPI Dashboard With Breached Summary Assessment Professional PDF
This graph or chart is linked to excel, and changes automatically based on data. Just left click on it and select Edit Data. Pitch your topic with ease and precision using this Service Level Agreement KPI Dashboard With Breached Summary Assessment Professional PDF. This layout presents information on Resolution Statistics, Service Desk Demo, Breached Summary. It is also available for immediate download and adjustment. So, changes can be made in the color, design, graphics or any other component to create a unique layout.
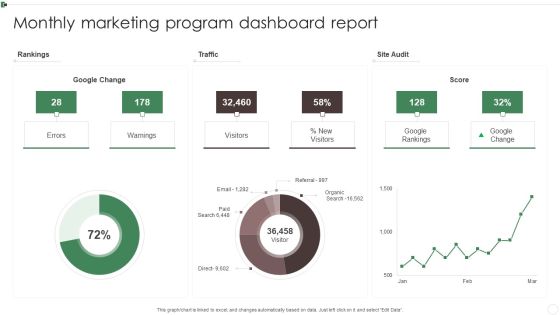
Monthly Marketing Program Dashboard Report Ppt Inspiration Information PDF
This graph or chart is linked to excel, and changes automatically based on data. Just left click on it and select Edit Data. Pitch your topic with ease and precision using this Monthly Marketing Program Dashboard Report Ppt Inspiration Information PDF. This layout presents information on Rankings, Traffic, Site Audit, Warnings. It is also available for immediate download and adjustment. So, changes can be made in the color, design, graphics or any other component to create a unique layout.
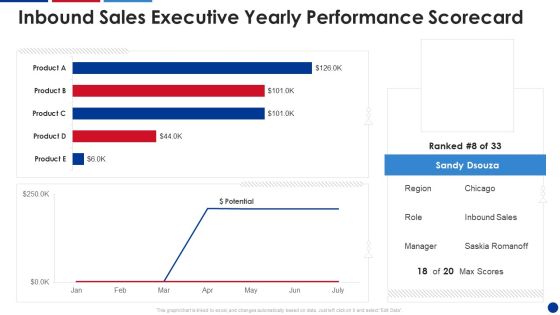
Inbound Sales Executive Yearly Performance Scorecard Information PDF
This graph or chart is linked to excel, and changes automatically based on data. Just left click on it and select Edit Data. Deliver and pitch your topic in the best possible manner with this Inbound Sales Executive Yearly Performance Scorecard Information PDF. Use them to share invaluable insights on Inbound Sales, Executive Yearly, Performance Scorecard and impress your audience. This template can be altered and modified as per your expectations. So, grab it now.
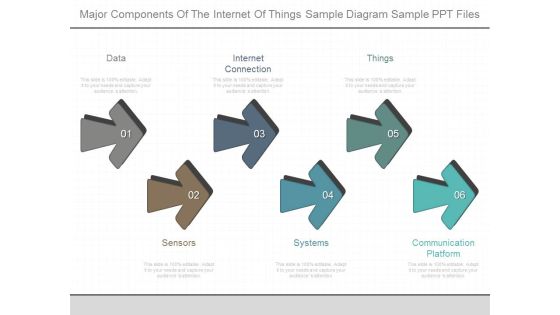
Major Components Of The Internet Of Things Sample Diagram Sample Ppt Files
This is a major components of the internet of things sample diagram sample ppt files. This is a six stage process. The stages in this process are data, internet connection, things, sensors, systems, communication platform.
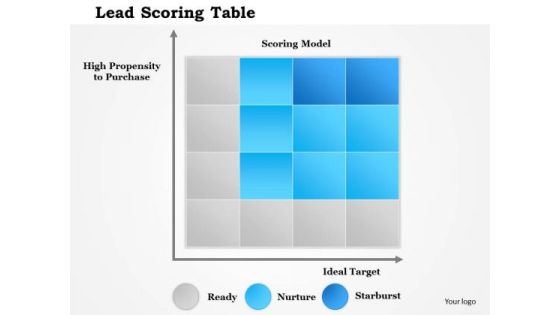
Business Framework Lead Scoring Table PowerPoint Presentation
A graph style cubical chart has been used to decorate this power point template slide. This PPT slide contains the concept of explaining score. Use this score table for displaying any data.

Global Auto Sales Scorecard By Market Share Ideas PDF
This graph or chart is linked to excel, and changes automatically based on data. Just left click on it and select Edit Data. Deliver an awe inspiring pitch with this creative Global Auto Sales Scorecard By Market Share Ideas PDF bundle. Topics like 2022 Sales Statistics, Global Auto Sales, Scorecard Market Share can be discussed with this completely editable template. It is available for immediate download depending on the needs and requirements of the user.
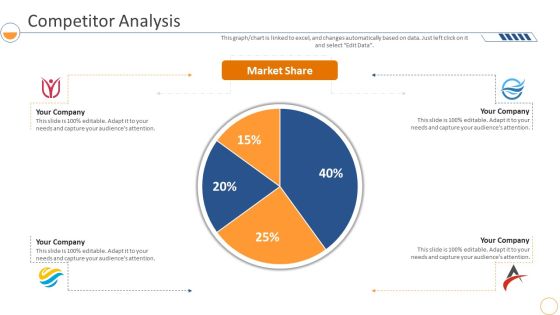
Monthly Company Performance Analysiscompetitor Analysis Market Formats PDF
This graph or chart is linked to excel, and changes automatically based on data. Just left click on it and select Edit Data. Deliver an awe inspiring pitch with this creative monthly company performance analysiscompetitor analysis market formats pdf bundle. Topics like competitor analysis, market share can be discussed with this completely editable template. It is available for immediate download depending on the needs and requirements of the user.

Healthcare Financial Analysis Scorecard With Country Revenue Ppt Layouts PDF
This graph or chart is linked to excel, and changes automatically based on data. Just left click on it and select Edit Data. Deliver an awe inspiring pitch with this creative Healthcare Financial Analysis Scorecard With Country Revenue Ppt Layouts PDF bundle. Topics like Revenue Generated Departments, Country Revenue Current can be discussed with this completely editable template. It is available for immediate download depending on the needs and requirements of the user.

Weekly Sales Performance Highlights With Product Share Ppt File Information PDF
This graph or chart is linked to excel, and changes automatically based on data. Just left click on it and select Edit Data. Pitch your topic with ease and precision using this Weekly Sales Performance Highlights With Product Share Ppt File Information PDF. This layout presents information on Dashboard Summary, Weekly Sale, Product Share. It is also available for immediate download and adjustment. So, changes can be made in the color, design, graphics or any other component to create a unique layout.
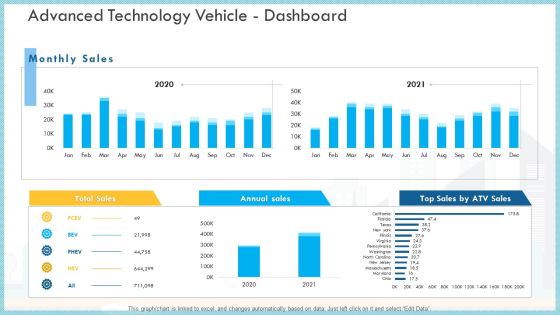
Loss Of Income And Financials Decline In An Automobile Organization Case Study Advanced Technology Vehicle Dashboard Infographics PDF
This graph or chart is linked to excel, and changes automatically based on data. Just left click on it and select Edit Data.Deliver an awe inspiring pitch with this creative loss of income and financials decline in an automobile organization case study advanced technology vehicle dashboard infographics pdf bundle. Topics like total sales, annual sales, monthly sales can be discussed with this completely editable template. It is available for immediate download depending on the needs and requirements of the user.

Summary Financial Accounting Statement Profit And Loss Analysis Dashboard Elements PDF
This graph or chart is linked to excel, and changes automatically based on data. Just left click on it and select Edit Data. Deliver an awe inspiring pitch with this creative Summary Financial Accounting Statement Profit And Loss Analysis Dashboard Elements PDF bundle. Topics like P And L Structure Dynamics, Dupont Rations, Debt Coverage Ratios, Creditworthiness Assessment can be discussed with this completely editable template. It is available for immediate download depending on the needs and requirements of the user.

Healthcare Financial Analysis Scorecard Cost And Patient Ppt Pictures Rules PDF
This graph or chart is linked to excel, and changes automatically based on data. Just left click on it and select Edit Data. Deliver an awe inspiring pitch with this creative Healthcare Financial Analysis Scorecard Cost And Patient Ppt Pictures Rules PDF bundle. Topics like Total Patient Admissions, Average Stay Hosp, Cardiac Arrest Revenue, Total Patient Admitted can be discussed with this completely editable template. It is available for immediate download depending on the needs and requirements of the user.
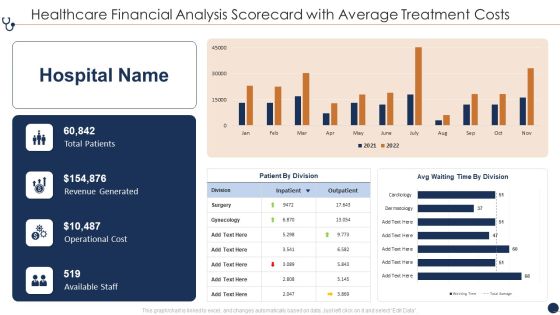
Healthcare Financial Analysis Scorecard With Average Treatment Costs Ppt Gallery Inspiration PDF
This graph or chart is linked to excel, and changes automatically based on data. Just left click on it and select Edit Data. Deliver and pitch your topic in the best possible manner with this Healthcare Financial Analysis Scorecard With Average Treatment Costs Ppt Gallery Inspiration PDF. Use them to share invaluable insights on Total Patients Revenue, Generated Operational Cost, Available Staff Outpatient and impress your audience. This template can be altered and modified as per your expectations. So, grab it now.

Healthcare Financial Analysis Scorecard With Outpatient Satisfaction Ppt Professional Background Image PDF
This graph or chart is linked to excel, and changes automatically based on data. Just left click on it and select Edit Data. Deliver and pitch your topic in the best possible manner with this Healthcare Financial Analysis Scorecard With Outpatient Satisfaction Ppt Professional Background Image PDF. Use them to share invaluable insights on Net Promoter Score, Outpatient Satisfaction Employee, Revenue Satisfaction Patients and impress your audience. This template can be altered and modified as per your expectations. So, grab it now.

Healthcare Financial Analysis Scorecard With Overall Patient Satisfaction Ppt File Graphics PDF
This graph or chart is linked to excel, and changes automatically based on data. Just left click on it and select Edit Data. Deliver an awe inspiring pitch with this creative Healthcare Financial Analysis Scorecard With Overall Patient Satisfaction Ppt File Graphics PDF bundle. Topics like Average Wait Times, Admission By Division, Admission Vs Cost, Overall Patient Satisfaction can be discussed with this completely editable template. It is available for immediate download depending on the needs and requirements of the user.
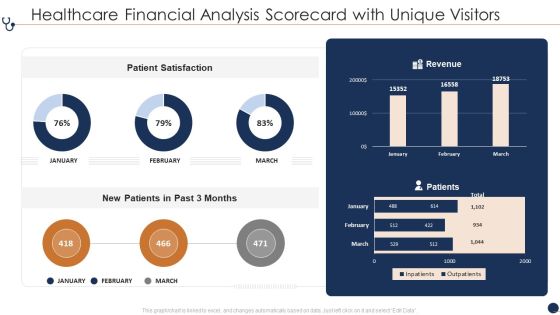
Healthcare Financial Analysis Scorecard With Unique Visitors Ppt File Visuals PDF
This graph or chart is linked to excel, and changes automatically based on data. Just left click on it and select Edit Data. Deliver an awe inspiring pitch with this creative Healthcare Financial Analysis Scorecard With Unique Visitors Ppt File Visuals PDF bundle. Topics like Patient Satisfaction Revenue, New Patients Past can be discussed with this completely editable template. It is available for immediate download depending on the needs and requirements of the user.

Product Pricing Strategies Analysis Business Conversion Due To Improved Pricing Strategy Slides PDF
This graph or chart is linked to excel, and changes automatically based on data. Just left click on it and select Edit Data. Deliver an awe inspiring pitch with this creative Product Pricing Strategies Analysis Business Conversion Due To Improved Pricing Strategy Slides PDF bundle. Topics like Increase Conversion Rate, Keep Expected Profit, Reduce Conversion Rate, Improve Expected Profit can be discussed with this completely editable template. It is available for immediate download depending on the needs and requirements of the user.

Product Pricing Strategies Analysis Hours Spent By Company To Evaluate Pricing Strategy Professional PDF
This graph or chart is linked to excel, and changes automatically based on data. Just left click on it and select Edit Data. Deliver an awe inspiring pitch with this creative Product Pricing Strategies Analysis Hours Spent By Company To Evaluate Pricing Strategy Professional PDF bundle. Topics like Pricing Per Year, Number Years Business can be discussed with this completely editable template. It is available for immediate download depending on the needs and requirements of the user.

Product Pricing Strategies Analysis Trade Off Between Profit And Demand For Optimal Price Portrait PDF
This graph or chart is linked to excel, and changes automatically based on data. Just left click on it and select Edit Data. Deliver and pitch your topic in the best possible manner with this Product Pricing Strategies Analysis Trade Off Between Profit And Demand For Optimal Price Portrait PDF. Use them to share invaluable insights on Potential Profit Premium, Demand Function Premium and impress your audience. This template can be altered and modified as per your expectations. So, grab it now.
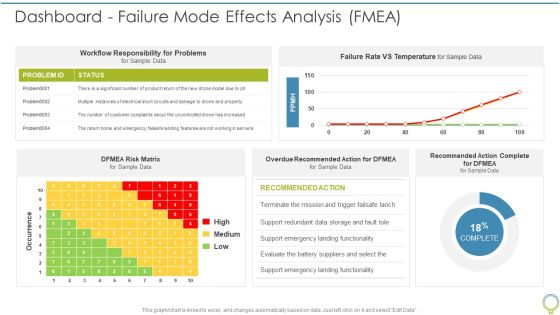
FMEA To Determine Potential Dashboard Failure Mode Effects Analysis FMEA Brochure PDF
This graph or chart is linked to excel, and changes automatically based on data. Just left click on it and select Edit Data. Deliver an awe inspiring pitch with this creative FMEA To Determine Potential Dashboard Failure Mode Effects Analysis FMEA Brochure PDF bundle. Topics like Workflow Responsibility, High Medium, Recommended Action can be discussed with this completely editable template. It is available for immediate download depending on the needs and requirements of the user.
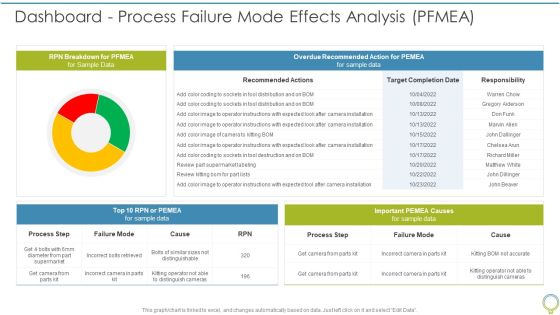
FMEA To Determine Potential Dashboard Process Failure Mode Effects Analysis PFMEA Elements PDF
This graph or chart is linked to excel, and changes automatically based on data. Just left click on it and select Edit Data. Deliver and pitch your topic in the best possible manner with this FMEA To Determine Potential Dashboard Process Failure Mode Effects Analysis PFMEA Elements PDF. Use them to share invaluable insights on RPN Breakdown, Overdue Recommended, Process Step and impress your audience. This template can be altered and modified as per your expectations. So, grab it now.
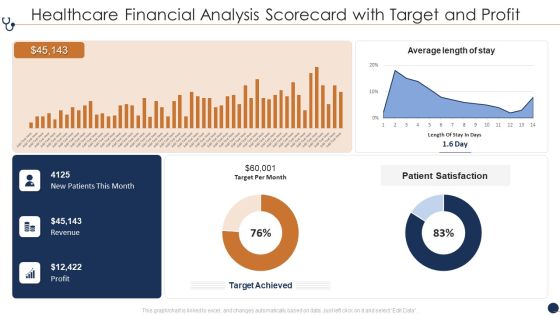
Healthcare Financial Analysis Scorecard With Target And Profit Ppt Gallery Example File PDF
This graph or chart is linked to excel, and changes automatically based on data. Just left click on it and select Edit Data. Deliver an awe inspiring pitch with this creative Avg Nurse Patient, Revenue And Expenses, Avg Treatment Costs bundle. Topics like Average Length Stay, Patient Satisfaction Target, Target Per Month can be discussed with this completely editable template. It is available for immediate download depending on the needs and requirements of the user.

Business Framework Shed Light On Topic Flashlight PowerPoint Presentation
This Power Point template slide has been designed with graphic of torch. This flash light has been used to display the concept of highlighting the any business data. Use this business slide for your technical presentation.
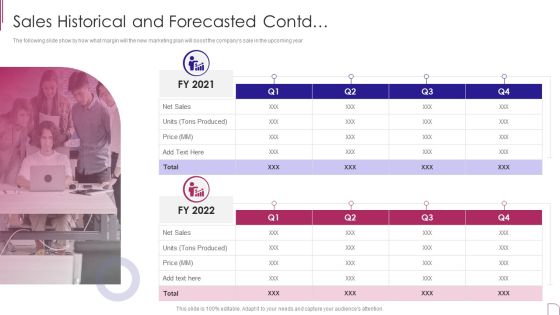
Yearly Product Performance Assessment Repor Sales Historical And Forecasted Contd Information PDF
The following slide show by how what margin will the new marketing plan will boost the companys sale in the upcoming year.Deliver an awe inspiring pitch with this creative Yearly Product Performance Assessment Repor Sales Historical And Forecasted Contd Information PDF bundle. Topics like Historical Data, Forecasted Data, Tons Produced can be discussed with this completely editable template. It is available for immediate download depending on the needs and requirements of the user.
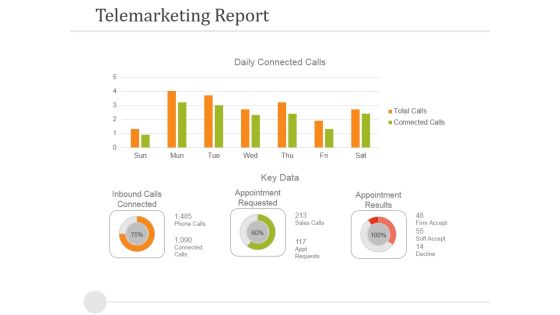
Telemarketing Report Template 1 Ppt PowerPoint Presentation Model Model
This is a telemarketing report template 1 ppt powerpoint presentation model model. This is a two stage process. The stages in this process are inbound calls connected, appointment requested, appointment results, key data.

Why Is Agile Cost Effective IT Determining The Software Development Cost Agile Demonstration PDF
This graph or chart is linked to excel, and changes automatically based on data. Just left click on it and select Edit Data. Deliver and pitch your topic in the best possible manner with this Why Is Agile Cost Effective IT Determining The Software Development Cost Agile Demonstration PDF. Use them to share invaluable insights on Analysis And Design, Development, Project Management, Quality Assurance and impress your audience. This template can be altered and modified as per your expectations. So, grab it now.

Resource Administration Accounting Scorecard With Defects And Fill Rate Mockup PDF
This graph or chart is linked to excel, and changes automatically based on data. Just left click on it and select Edit Data. Deliver and pitch your topic in the best possible manner with this Resource Administration Accounting Scorecard With Defects And Fill Rate Mockup PDF. Use them to share invaluable insights on Total Order Amount, Raw Material, Quantity Analysis and impress your audience. This template can be altered and modified as per your expectations. So, grab it now.

Bar Graph Showing Revenues Generated By Sales Department Ppt Portfolio Graphics Example PDF
This graph or chart is linked to excel, and changes automatically based on data. Just left click on it and select edit data. Showcasing this set of slides titled bar graph showing revenues generated by sales department ppt portfolio graphics example pdf. The topics addressed in these templates are yearly sales revenues, sales team, profits. All the content presented in this PPT design is completely editable. Download it and make adjustments in color, background, font etc. as per your unique business setting.

Online Advertising And Promotion Plan Management Dashboard Ppt PowerPoint Presentation Show Tips PDF
This graph chart is linked to excel, and changes automatically based on data. Just left click on it and select Edit Data. Showcasing this set of slides titled online advertising and promotion plan management dashboard ppt powerpoint presentation show tips pdf. The topics addressed in these templates are source techniques, social media channels, traffic targets. All the content presented in this PPT design is completely editable. Download it and make adjustments in color, background, font etc. as per your unique business setting.

Finance Metrics Dashboard Illustrating Monthly Gross Profit Formats PDF
This graph or chart is linked to excel, and changes automatically based on data. Just left click on it and select edit data. Showcasing this set of slides titled Finance Metrics Dashboard Illustrating Monthly Gross Profit Formats PDF. The topics addressed in these templates are Profit Metrics Gross, Profit Target Cum, Actual Cum Target. All the content presented in this PPT design is completely editable. Download it and make adjustments in color, background, font etc. as per your unique business setting.
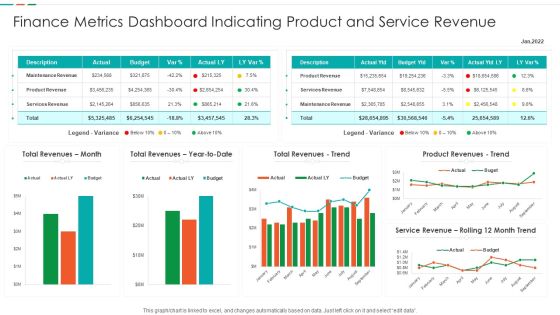
Finance Metrics Dashboard Indicating Product And Service Revenue Designs PDF
This graph or chart is linked to excel, and changes automatically based on data. Just left click on it and select edit data. Showcasing this set of slides titled Finance Metrics Dashboard Indicating Product And Service Revenue Designs PDF. The topics addressed in these templates are Maintenance Revenue Product, Revenue Product Revenues, Service Revenue Rolling. All the content presented in this PPT design is completely editable. Download it and make adjustments in color, background, font etc. as per your unique business setting.
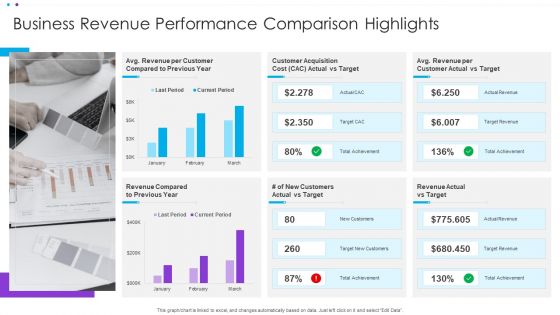
Business Revenue Performance Comparison Highlights Ppt Summary Rules PDF
This graph or chart is linked to excel, and changes automatically based on data. Just left click on it and select Edit Data. Showcasing this set of slides titled Business Revenue Performance Comparison Highlights Ppt Summary Rules PDF. The topics addressed in these templates are Customer Acquisition, Customer Actual, Revenue Compared. All the content presented in this PPT design is completely editable. Download it and make adjustments in color, background, font etc. as per your unique business setting.
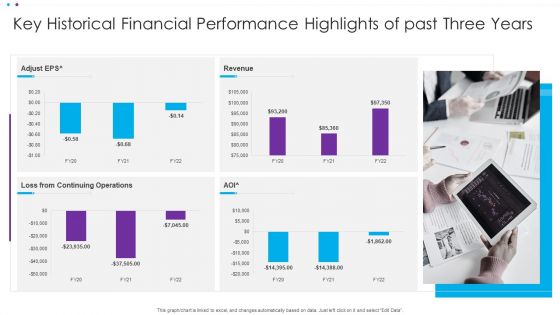
Key Historical Financial Performance Highlights Of Past Three Years Ppt Ideas Background PDF
This graph or chart is linked to excel, and changes automatically based on data. Just left click on it and select Edit Data. Showcasing this set of slides titled Key Historical Financial Performance Highlights Of Past Three Years Ppt Ideas Background PDF. The topics addressed in these templates are Continuing Operations, Adjust EP. All the content presented in this PPT design is completely editable. Download it and make adjustments in color, background, font etc. as per your unique business setting.

Call Center Client Helpline Dashboard Status Ppt Show Graphics Design PDF
This graph or chart is linked to excel, and changes automatically based on data. Just left click on it and select Edit Data. Showcasing this set of slides titled Call Center Client Helpline Dashboard Status Ppt Show Graphics Design PDF. The topics addressed in these templates are Call Monitor, Active Calls, Abandoned, Agents Ready. All the content presented in this PPT design is completely editable. Download it and make adjustments in color, background, font etc. as per your unique business setting.

Client Helpline Dashboard Average Time To Solve Issue Ppt Portfolio Visuals PDF
This graph or chart is linked to excel, and changes automatically based on data. Just left click on it and select Edit Data. Showcasing this set of slides titled Client Helpline Dashboard Average Time To Solve Issue Ppt Portfolio Visuals PDF. The topics addressed in these templates are Cost Per Support, Customer Satisfaction, Costs To Revenue. All the content presented in this PPT design is completely editable. Download it and make adjustments in color, background, font etc. as per your unique business setting.

Client Helpline Dashboard With Average Talk Time Distribution Ppt Gallery Backgrounds PDF
This graph or chart is linked to excel, and changes automatically based on data. Just left click on it and select Edit Data. Showcasing this set of slides titled Client Helpline Dashboard With Average Talk Time Distribution Ppt Gallery Backgrounds PDF. The topics addressed in these templates are External Incoming Call, Occupancy, Break Time, Sales. All the content presented in this PPT design is completely editable. Download it and make adjustments in color, background, font etc. as per your unique business setting.

Client Helpline Dashboard With Resolution And Response Rate Ppt File Example Topics PDF
This graph or chart is linked to excel, and changes automatically based on data. Just left click on it and select Edit Data. Showcasing this set of slides titled Client Helpline Dashboard With Resolution And Response Rate Ppt File Example Topics PDF. The topics addressed in these templates are Resolutions, Response Time, Response Time Weekday. All the content presented in this PPT design is completely editable. Download it and make adjustments in color, background, font etc. as per your unique business setting.

Client Helpline Dashboard With Support Status Ppt Portfolio Rules PDF
This graph or chart is linked to excel, and changes automatically based on data. Just left click on it and select Edit Data. Showcasing this set of slides titled Client Helpline Dashboard With Support Status Ppt Portfolio Rules PDF. The topics addressed in these templates are Total Number, Support Requests, Total Resolved, Support Status. All the content presented in this PPT design is completely editable. Download it and make adjustments in color, background, font etc. as per your unique business setting.
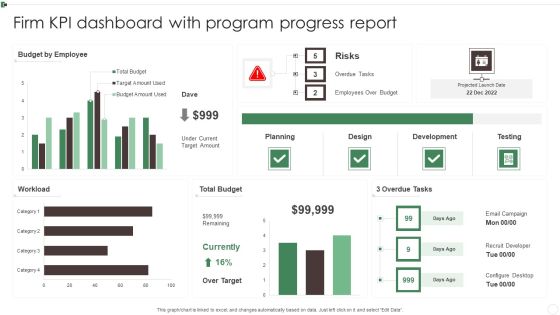
Firm KPI Dashboard With Program Progress Report Ppt Pictures Deck PDF
This graph or chart is linked to excel, and changes automatically based on data. Just left click on it and select Edit Data. Showcasing this set of slides titled Firm KPI Dashboard With Program Progress Report Ppt Pictures Deck PDF. The topics addressed in these templates are Budget By Employee, Total Budget, 3 Overdue Tasks, Workload. All the content presented in this PPT design is completely editable. Download it and make adjustments in color, background, font etc. as per your unique business setting.
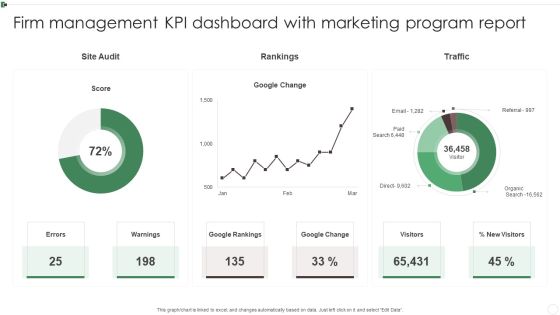
Firm Management KPI Dashboard With Marketing Program Report Ppt Styles Introduction PDF
This graph or chart is linked to excel, and changes automatically based on data. Just left click on it and select Edit Data. Showcasing this set of slides titled Firm Management KPI Dashboard With Marketing Program Report Ppt Styles Introduction PDF. The topics addressed in these templates are Google Rankings, Google Change, Warnings, Visitors. All the content presented in this PPT design is completely editable. Download it and make adjustments in color, background, font etc. as per your unique business setting.
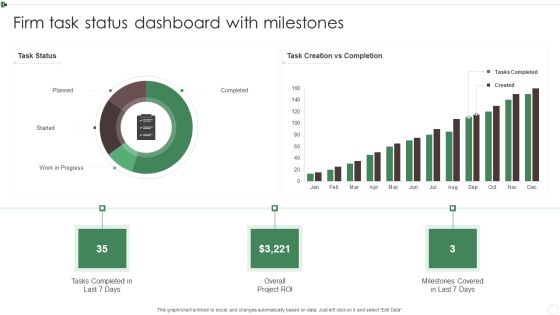
Firm Task Status Dashboard With Milestones Ppt Show Sample PDF
This graph or chart is linked to excel, and changes automatically based on data. Just left click on it and select Edit Data. Showcasing this set of slides titled Firm Task Status Dashboard With Milestones Ppt Show Sample PDF. The topics addressed in these templates are Tasks Completed, Planned, Work Progress, Overall Project ROI. All the content presented in this PPT design is completely editable. Download it and make adjustments in color, background, font etc. as per your unique business setting.

Help Desk Call Centre Service Level Agreement KPI Dashboard Pictures PDF
This graph or chart is linked to excel, and changes automatically based on data. Just left click on it and select Edit Data. Showcasing this set of slides titled Help Desk Call Centre Service Level Agreement KPI Dashboard Pictures PDF. The topics addressed in these templates are Call Type Today, Occupancy Today, Call Summary Today. All the content presented in this PPT design is completely editable. Download it and make adjustments in color, background, font etc. as per your unique business setting.

5 Year Gender Based Group Demographics Of Organization Background PDF
This graph or chart is linked to excel, and changes automatically based on data. Just left click on it and select Edit Data. Showcasing this set of slides titled 5 Year Gender Based Group Demographics Of Organization Background PDF. The topics addressed in these templates are Total Employees, Male, Female. All the content presented in this PPT design is completely editable. Download it and make adjustments in color, background, font etc. as per your unique business setting.

Business Hiring Group Diversity Demographics Dashboard Guidelines PDF
This graph or chart is linked to excel, and changes automatically based on data. Just left click on it and select Edit Data. Showcasing this set of slides titled Business Hiring Group Diversity Demographics Dashboard Guidelines PDF. The topics addressed in these templates are Hiring Trends, Current Period, Previous Period. All the content presented in this PPT design is completely editable. Download it and make adjustments in color, background, font etc. as per your unique business setting.

Group Diversity Demographics Based On Salary Range Portrait PDF
This graph or chart is linked to excel, and changes automatically based on data. Just left click on it and select Edit Data. Showcasing this set of slides titled Group Diversity Demographics Based On Salary Range Portrait PDF. The topics addressed in these templates are Salary Breakdown Team, Number Employees, Per Team. All the content presented in this PPT design is completely editable. Download it and make adjustments in color, background, font etc. as per your unique business setting.

Multiple Organizational Group Demographics Based On Gender Download PDF
This graph or chart is linked to excel, and changes automatically based on data. Just left click on it and select Edit Data. Showcasing this set of slides titled Multiple Organizational Group Demographics Based On Gender Download PDF. The topics addressed in these templates are Total Employees, Team, Female. All the content presented in this PPT design is completely editable. Download it and make adjustments in color, background, font etc. as per your unique business setting.

Helpdesk SLA KPL Dashboard Illustrating Calls Details Ppt Slides Show PDF
This graph or chart is linked to excel, and changes automatically based on data. Just left click on it and select Edit Data. Showcasing this set of slides titled Helpdesk SLA KPL Dashboard Illustrating Calls Details Ppt Slides Show PDF. The topics addressed in these templates are Call Type Today, Trunk Utilization Today, Call Summery Today. All the content presented in this PPT design is completely editable. Download it and make adjustments in color, background, font etc. as per your unique business setting.

SLA KPL Dashboard Indicating Compliance Priority With KPI Ppt File Format PDF
This graph or chart is linked to excel, and changes automatically based on data. Just left click on it and select Edit Data. Showcasing this set of slides titled SLA KPL Dashboard Indicating Compliance Priority With KPI Ppt File Format PDF. The topics addressed in these templates are KPI Graph, Insights Here, SLA Compliance Priority. All the content presented in this PPT design is completely editable. Download it and make adjustments in color, background, font etc. as per your unique business setting.

SLA KPL Dashboard Indicating Top Week Performers Ppt Infographics Examples PDF
This graph or chart is linked to excel, and changes automatically based on data. Just left click on it and select Edit Data. Showcasing this set of slides titled SLA KPL Dashboard Indicating Top Week Performers Ppt Infographics Examples PDF. The topics addressed in these templates are Active Slas Risk, Active Slas Breached, Active Slas. All the content presented in this PPT design is completely editable. Download it and make adjustments in color, background, font etc. as per your unique business setting.

Doughnut Graph Depicting Time Spent On Multiple Project Activities Microsoft PDF
This graph or chart is linked to excel, and changes automatically based on data. Just left click on it and select Edit Data. Showcasing this set of slides titled Doughnut Graph Depicting Time Spent On Multiple Project Activities Microsoft PDF. The topics addressed in these templates are Website Development, IT Incident Management, Portfolio Management. All the content presented in this PPT design is completely editable. Download it and make adjustments in color, background, font etc. as per your unique business setting.
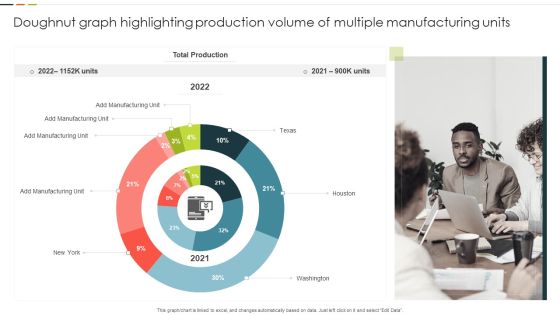
Doughnut Graph Highlighting Production Volume Of Multiple Manufacturing Units Guidelines PDF
This graph or chart is linked to excel, and changes automatically based on data. Just left click on it and select Edit Data. Showcasing this set of slides titled Doughnut Graph Highlighting Production Volume Of Multiple Manufacturing Units Guidelines PDF. The topics addressed in these templates are Total Production, Manufacturing Unit, Washington. All the content presented in this PPT design is completely editable. Download it and make adjustments in color, background, font etc. as per your unique business setting.

Doughnut Graph With Multiple Construction Project Detail Structure PDF
This graph or chart is linked to excel, and changes automatically based on data. Just left click on it and select Edit Data. Showcasing this set of slides titled Doughnut Graph With Multiple Construction Project Detail Structure PDF. The topics addressed in these templates are Corporate Buildings, Residential Houses, Commercial Buildings. All the content presented in this PPT design is completely editable. Download it and make adjustments in color, background, font etc. as per your unique business setting.

Doughnut Graph With Skills Criteria For Job Application Designs PDF
This graph or chart is linked to excel, and changes automatically based on data. Just left click on it and select Edit Data. Showcasing this set of slides titled Doughnut Graph With Skills Criteria For Job Application Designs PDF. The topics addressed in these templates are Accounting Skills, Leadership Skills, Coding Skills. All the content presented in this PPT design is completely editable. Download it and make adjustments in color, background, font etc. as per your unique business setting.

Kanban Structure For Monitor Weekly Issues Resolving Progress Ppt Professional Outline PDF
This graph or chart is linked to excel, and changes automatically based on data. Just left click on it and select Edit Data. Showcasing this set of slides titled Kanban Structure For Monitor Weekly Issues Resolving Progress Ppt Professional Outline PDF. The topics addressed in these templates are Issues Resolved, Progress To Resolved, Issues To Resolved. All the content presented in this PPT design is completely editable. Download it and make adjustments in color, background, font etc. as per your unique business setting.
Kanban Structure For Yearly Project Progress Tracking Ppt File Example Introduction PDF
This graph or chart is linked to excel, and changes automatically based on data. Just left click on it and select Edit Data. Showcasing this set of slides titled Kanban Structure For Yearly Project Progress Tracking Ppt File Example Introduction PDF. The topics addressed in these templates are Number Projects, Backlog Approved, Final Review. All the content presented in this PPT design is completely editable. Download it and make adjustments in color, background, font etc. as per your unique business setting.

Kanban Structure With Process Lead Time Ppt Gallery Template PDF
This graph or chart is linked to excel, and changes automatically based on data. Just left click on it and select Edit Data. Showcasing this set of slides titled Kanban Structure With Process Lead Time Ppt Gallery Template PDF. The topics addressed in these templates are Lead Time, In Realization, Requirements. All the content presented in this PPT design is completely editable. Download it and make adjustments in color, background, font etc. as per your unique business setting.

Human Capital Metrics For Proper Management Ppt Show Inspiration PDF
This graph or chart is linked to excel, and changes automatically based on data. Just left click on it and select Edit Data. Showcasing this set of slides titled Human Capital Metrics For Proper Management Ppt Show Inspiration PDF. The topics addressed in these templates are Candidates Per Position, Hired Per Source, Location. All the content presented in this PPT design is completely editable. Download it and make adjustments in color, background, font etc. as per your unique business setting.
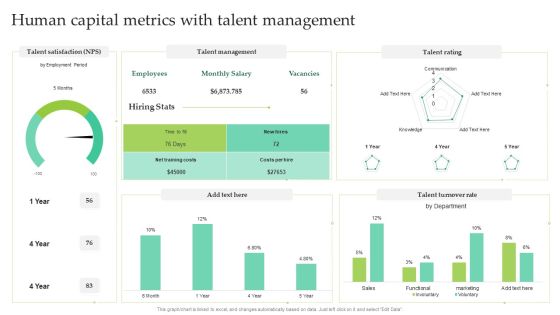
Human Capital Metrics With Talent Management Ppt Layouts Mockup PDF
This graph or chart is linked to excel, and changes automatically based on data. Just left click on it and select Edit Data. Showcasing this set of slides titled Human Capital Metrics With Talent Management Ppt Layouts Mockup PDF. The topics addressed in these templates are Talent Management, Talent Rating, Talent Turnover Rate. All the content presented in this PPT design is completely editable. Download it and make adjustments in color, background, font etc. as per your unique business setting.

Dashboard Depicting Security Problem Management Metrics Ppt Gallery Designs PDF
This graph or chart is linked to excel, and changes automatically based on data. Just left click on it and select Edit Data. Showcasing this set of slides titled Dashboard Depicting Security Problem Management Metrics Ppt Gallery Designs PDF. The topics addressed in these templates are Percentage, New Critical, Security Incidents. All the content presented in this PPT design is completely editable. Download it and make adjustments in color, background, font etc. as per your unique business setting.

Resource Administration Accounting Scorecard With Invoices Status Topics PDF
This graph or chart is linked to excel, and changes automatically based on data. Just left click on it and select Edit Data. Deliver an awe inspiring pitch with this creative Resource Administration Accounting Scorecard With Invoices Status Topics PDF bundle. Topics like Recent Invoice, Sales Chart, Total Receivable can be discussed with this completely editable template. It is available for immediate download depending on the needs and requirements of the user.

Finance Metrics Dashboard Indicating Portfolio Performance Microsoft PDF
This graph or chart is linked to excel, and changes automatically based on data. Just left click on it and select edit data. Pitch your topic with ease and precision using this Finance Metrics Dashboard Indicating Portfolio Performance Microsoft PDF. This layout presents information on Portfolio Performance Portfolio, Asset Management Manager, Top 10 Assets. It is also available for immediate download and adjustment. So, changes can be made in the color, design, graphics or any other component to create a unique layout.

Finance Metrics Dashboard Indicating Short Term Assets Download PDF
This graph or chart is linked to excel, and changes automatically based on data. Just left click on it and select edit data. Pitch your topic with ease and precision using this Finance Metrics Dashboard Indicating Short Term Assets Download PDF. This layout presents information on Short Term Assets, Global Financial Performance, Revenue YTD 2022. It is also available for immediate download and adjustment. So, changes can be made in the color, design, graphics or any other component to create a unique layout.

Financial Performance Highlights With Net Profit Margin Ppt Model Ideas PDF
This graph or chart is linked to excel, and changes automatically based on data. Just left click on it and select Edit Data. Pitch your topic with ease and precision using this Financial Performance Highlights With Net Profit Margin Ppt Model Ideas PDF. This layout presents information on Net Profit, Accounts Receivable, Accounts Payable. It is also available for immediate download and adjustment. So, changes can be made in the color, design, graphics or any other component to create a unique layout.
