AI PPT Maker
Templates
PPT Bundles
Design Services
Business PPTs
Business Plan
Management
Strategy
Introduction PPT
Roadmap
Self Introduction
Timelines
Process
Marketing
Agenda
Technology
Medical
Startup Business Plan
Cyber Security
Dashboards
SWOT
Proposals
Education
Pitch Deck
Digital Marketing
KPIs
Project Management
Product Management
Artificial Intelligence
Target Market
Communication
Supply Chain
Google Slides
Research Services
 One Pagers
All Categories
-
Home
- Customer Favorites
- Data Dashboard
Data Dashboard

Risk Assessment And Deterioration Modelling Infographics PDF
This is a risk assessment and deterioration modelling infographics pdf template with various stages. Focus and dispense information on five stages using this creative set, that comes with editable features. It contains large content boxes to add your information on topics like data input, data analysis, optimization process, decision making constraints, optimal decision. You can also showcase facts, figures, and other relevant content using this PPT layout. Grab it now.

Business Activities Assessment Examples Risk Assessment And Deterioration Modelling Graphics PDF
Presenting business activities assessment examples risk assessment and deterioration modelling graphics pdf to provide visual cues and insights. Share and navigate important information on five stages that need your due attention. This template can be used to pitch topics like data input, data analysis, optimization process, optimal decision. In addtion, this PPT design contains high resolution images, graphics, etc, that are easily editable and available for immediate download.

Illustration Of Save Money Concept Powerpoint Templates
This business slide has been designed with infographic square. These text boxes can be used for data representation. Use this diagram for your business presentations. Build a quality presentation for your viewers with this unique diagram.
Enterprise Thesis Business Dissertation Methodology Proposal Ppt Pictures Icon PDF
Presenting enterprise thesis business dissertation methodology proposal ppt pictures icon pdf to provide visual cues and insights. Share and navigate important information on four stages that need your due attention. This template can be used to pitch topics like list of resources used in study, methods for data analysis, different approaches of data collection. In addition, this PPT design contains high-resolution images, graphics, etc, that are easily editable and available for immediate download.
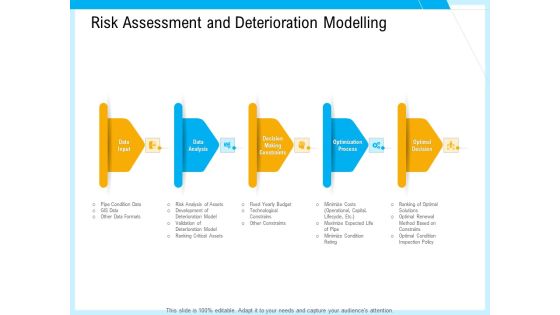
IT And Cloud Facilities Management Risk Assessment And Deterioration Modelling Infographics PDF
Presenting it and cloud facilities management risk assessment and deterioration modelling infographics pdf to provide visual cues and insights. Share and navigate important information on five stages that need your due attention. This template can be used to pitch topics like data, input, data analysis, decision making constraints, optimization process, optimal decision. In addition, this PPT design contains high-resolution images, graphics, etc, that are easily editable and available for immediate download.
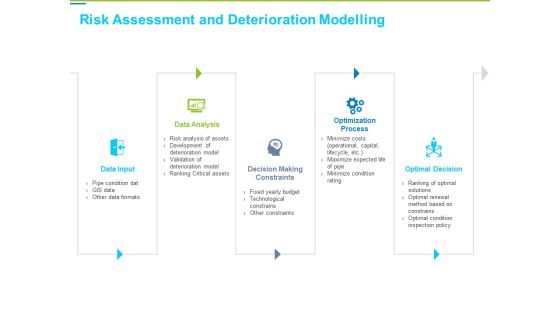
Framework Administration Risk Assessment And Deterioration Modelling Diagrams PDF
Presenting framework administration risk assessment and deterioration modelling diagrams pdf to provide visual cues and insights. Share and navigate important information on five stages that need your due attention. This template can be used to pitch topics like data input, data analysis, optimal decision, optimization process, decision making constraints. In addition, this PPT design contains high-resolution images, graphics, etc, that are easily editable and available for immediate download.

Infrastructure Project Management In Construction Risk Assessment And Deterioration Modelling Mockup PDF
Presenting infrastructure project management in construction risk assessment and deterioration modelling mockup pdf. to provide visual cues and insights. Share and navigate important information on five stages that need your due attention. This template can be used to pitch topics like data input, decision making constraints, optimization process, optimal decision, data analysis. In addtion, this PPT design contains high resolution images, graphics, etc, that are easily editable and available for immediate download.

Customer Research Framework With Research Planning Ppt PowerPoint Presentation Layouts Format Ideas PDF
This slide shows key constituents required to generate customer research plan including tool preparation and data collection. Pitch your topic with ease and precision using this customer research framework with research planning ppt powerpoint presentation layouts format ideas pdf. This layout presents information on research planning, tools preparation, survey creation, data collection, aggregation and analysis. It is also available for immediate download and adjustment. So, changes can be made in the color, design, graphics or any other component to create a unique layout.
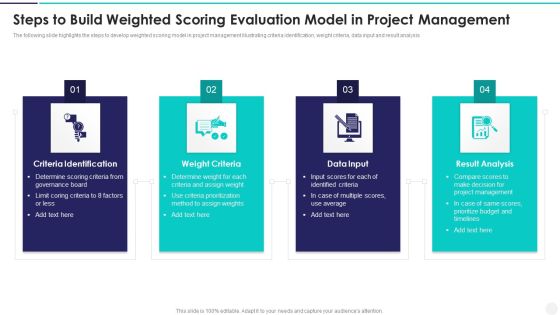
Steps To Build Weighted Scoring Evaluation Model In Project Management Brochure PDF
The following slide highlights the steps to develop weighted scoring model in project management illustrating criteria identification, weight criteria, data input and result analysis Presenting Steps To Build Weighted Scoring Evaluation Model In Project Management Brochure PDF to dispense important information. This template comprises four stages. It also presents valuable insights into the topics including Criteria Identification, Weight Criteria, Data Input This is a completely customizable PowerPoint theme that can be put to use immediately. So, download it and address the topic impactfully.

CRM Transformation Toolkit Analysing CRM Business Functional Requirements Professional PDF
This slide provides information regarding the analysis of key business functional requirements based on degree of compliance associated to CRM. Deliver an awe inspiring pitch with this creative CRM Transformation Toolkit Analysing CRM Business Functional Requirements Professional PDF bundle. Topics like Functional Requirements, Data Modelling Requirements, Data Sources can be discussed with this completely editable template. It is available for immediate download depending on the needs and requirements of the user.

Comparative Assessment Of SOA And Microservices Architecture Professional PDF
This slide illustrates comparative analysis of Service Oriented Architecture and Microservices. It includes scope, component reuse, communication protocols, data access, etc. Presenting Comparative Assessment Of SOA And Microservices Architecture Professional PDF to dispense important information. This template comprises six stages. It also presents valuable insights into the topics including Scope, Component Reuse, Communication Protocols, Data Access. This is a completely customizable PowerPoint theme that can be put to use immediately. So, download it and address the topic impactfully.
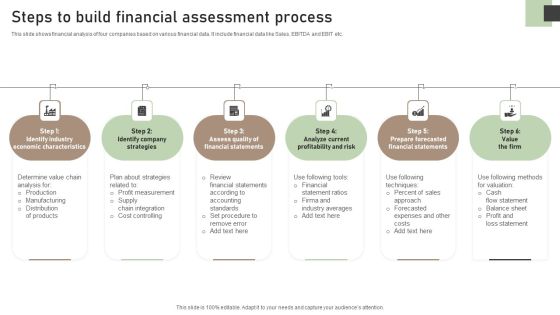
Steps To Build Financial Assessment Process Ideas PDF
This slide shows financial analysis of four companies based on various financial data. It include financial data like Sales, EBITDA and EBIT etc. Presenting Steps To Build Financial Assessment Process Ideas PDF to dispense important information. This template comprises six stages. It also presents valuable insights into the topics including Identify Industry Economic, Identify Company Strategies, Analyze Current Profitability. This is a completely customizable PowerPoint theme that can be put to use immediately. So, download it and address the topic impactfully.
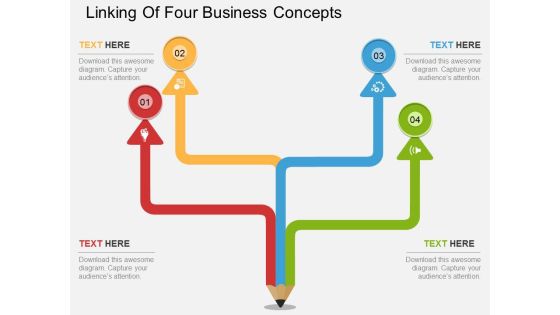
Linking Of Four Business Concepts Powerpoint Template
This PowerPoint template has been designed with four steps pencil diagram. This diagram is excellent visual tools to present link of steps. Download this PPT slide to explain complex data immediately and clearly.
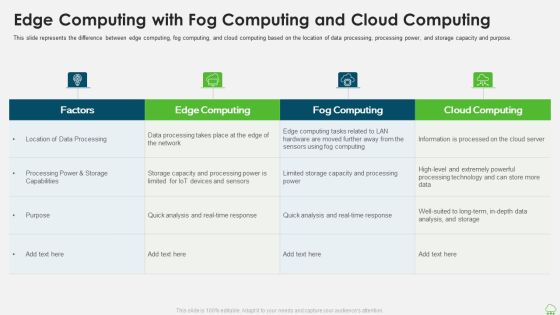
Distributed Computing IT Edge Computing With Fog Computing And Cloud Computing Sample PDF
This slide represents the difference between edge computing, fog computing, and cloud computing based on the location of data processing, processing power, and storage capacity and purpose. Deliver and pitch your topic in the best possible manner with this distributed computing it edge computing with fog computing and cloud computing sample pdf. Use them to share invaluable insights on data processing, analysis, capacity and impress your audience. This template can be altered and modified as per your expectations. So, grab it now.

Computational Science Methodology Computational Scientist Profession Summary PDF
This slide describes the computational scientist profession, including the job description and skills required to become a computational scientist. Deliver and pitch your topic in the best possible manner with this Computational Science Methodology Computational Scientist Profession Summary PDF. Use them to share invaluable insights on Experimental Design, Data Analysis, Data Integration and impress your audience. This template can be altered and modified as per your expectations. So, grab it now.

Business Diagram Four Design For Concept Coding Presentation Template
Four colorful text boxes has been used to craft this power point template. This PPT diagram contains the concept of coding and data representation. Use this PPT for business and technology related presentations.

Arrows Infographic For Strategic Management Concept Powerpoint Template
Our above PPT slide contains four curved arrows infographic design. This business diagram helps to depict business information for strategic management. Use this diagram to impart more clarity to data and to create more sound impact on viewers.
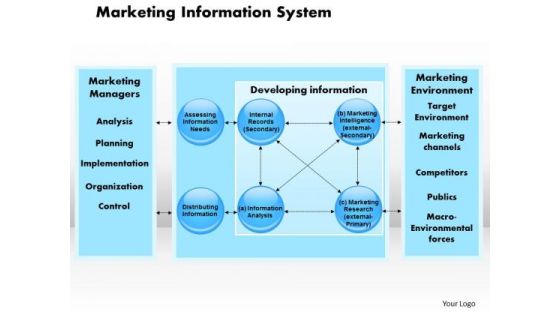
Business Framework Marketing Information System PowerPoint Presentation
This business framework PPt contains the graphic of marketing information system. This system contains the concept of delivering market related information. Use this system for your data based information representation in any presentation.

Business Diagram Four Staged Arrows With Different Graphics Of Communication Concept Presentation Te
Four staged arrow with different graphics has been used to craft this power point template. This PPT diagram contains the concept of data communication. Use this PPT for business and technology related presentations.
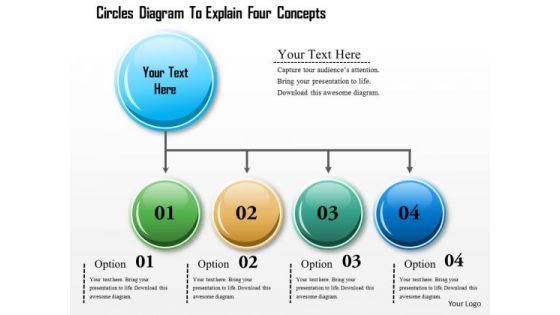
Business Diagram Circles Diagram To Explain Four Concepts Presentation Template
Explain the concept of data flow in any presentation with this unique PPT. This PPT contains the graphic of four staged text boxes. This PPT is suitable for business and sales presentations.

Business Diagram Global Business And Marketing Agenda Diagram Presentation Template
Display the concept of global agenda and marketing agenda in your business presentation. This PPT slide contains the graphic of text boxes. Use this PPT slide for your business and marketing data related presentations.

Business Diagram Four Colored Tablets With Text Boxes Presentation Template
Graphic of four colored tablets has been used to design this power point template diagram. This PPT diagram contains the concept of data and text representation. Use this PPT for marketing and business related presentations.

3D Arrows Step Process Diagram Powerpoint Template
Our above slide contains graphics of arrows step process diagram. It helps to display innovative ideas. Use this diagram to impart more clarity to data and to create more sound impact on viewers.

Positive Thinking Powerpoint Slide Designs Download
This is a positive thinking powerpoint slide designs download. This is a four stage process. The stages in this process are party integration, positive thinking, mobile data system, high involvement.
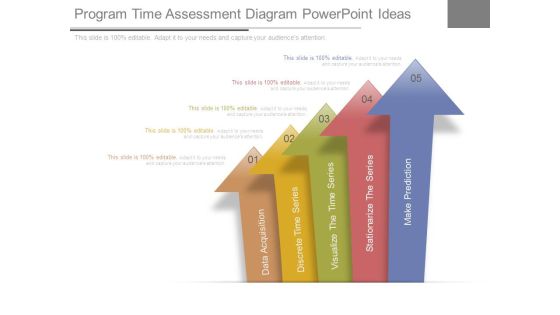
Program Time Assessment Diagram Powerpoint Ideas
This is a program time assessment diagram powerpoint ideas. This is a five stage process. The stages in this process are data acquisition, discrete time series, visualize the time series, stationarize the series, make prediction.

Barriers To Digital Transformation Ppt PowerPoint Presentation Styles Backgrounds
This is a barriers to digital transformation ppt powerpoint presentation styles backgrounds. This is a six stage process. The stages in this process are processes, digital skills shortage, data issues, short term revenue targets, employee training.
Business Diagram Three Icons Arrow Text Boxes PowerPoint Template
Graphic of three icons and arrow text boxes are used to craft this power point template slide. This PPT contains the concept of business growth. This PPT slide is suitable for business and marketing data flow related presentations.
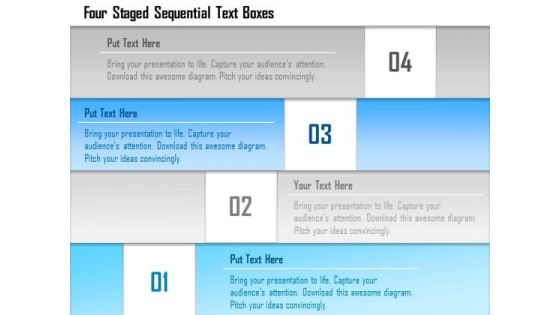
Business Diagram Four Staged Sequential Text Boxes Presentation Template
Four staged sequential stair designed text boxes are used to design this power point template. This PPT contains the concept of data flow. Use this PPT for your business and finance related presentations.
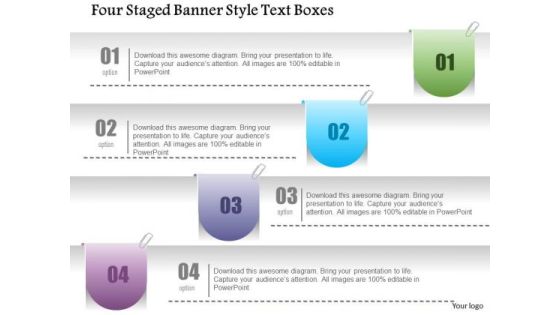
Business Diagram Four Staged Banner Style Text Boxes PowerPoint Template
Four staged banner style text boxes are used to craft this power point template slide. This PPT slide contains the concept of data updating and representation. Use this PPT and crate an impact on your viewers.

Business Diagram Four Balloons With Text Boxes PowerPoint Template
Graphic of four balloons style text box diagram has been used to design this power point template slide. This PPT slide contains the concept of business data flow. Use this PPT for your business and marketing related presentations.

Business Diagram Four Staged Semicircular Text Box Diagram PowerPoint Template
Four staged semicircular text boxes diagram has been used to design this power point template. This diagram template contains the concept of data and process flow. Use this PPT for your business and marketing related presentations.

Business Diagram Three Hut Shaped Graphics For Text Representation Presentation Template
Three staged hut shaped graphics has been used to craft this power point template. This PPT contains the concept of text representation. Use this PPT for business and marketing data related presentations.

Concept Of Ontology In The Semantic Web Timeline For Semantic Web Deployment Topics PDF
This slide represents the timeline for semantic web deployment and development, including the steps to be performed at each months interval. The steps include discovering data, integrating data with meaningful labels, validating, and exploring methods for data transformation. The Concept Of Ontology In The Semantic Web Timeline For Semantic Web Deployment Topics PDF is a compilation of the most recent design trends as a series of slides. It is suitable for any subject or industry presentation, containing attractive visuals and photo spots for businesses to clearly express their messages. This template contains a variety of slides for the user to input data, such as structures to contrast two elements, bullet points, and slides for written information. Slidegeeks is prepared to create an impression.

Business Diagram Highway Signboard With Road And Text Boxes PowerPoint Template
Graphic of highway signboard with road and text has been used to craft this power point template diagram. This PPT contains the concept of transportation and data representation. Use this PPT for your business and management related presentations.

3D Man Moving Toward Arrow Powerpoint Template
Our above PPT slide contains graphics of 3d man moving towards arrow. This PowerPoint template helps to exhibit finding possible solutions. Use this diagram to impart more clarity to data and to create more sound impact on viewers.
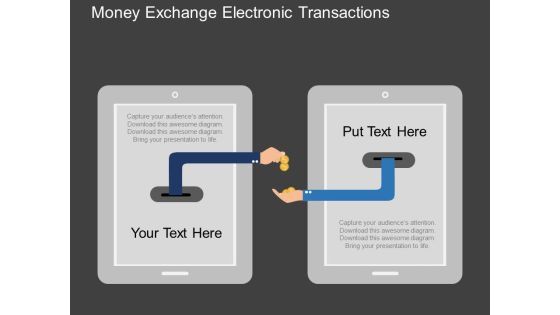
Money Exchange Electronic Transactions Powerpoint Templates
Our above slide contains illustration of money exchange. It helps to display electronic transactions. Use this diagram to impart more clarity to data and to create more sound impact on viewers.

Business Diagram Four Staged Torn Paper For Text Display PowerPoint Template
Four staged torn paper style text boxes has been used to design this power point template. This PPT contains the concept of text representation for business process. Use this PPT and build quality presentation for data and process related topics.

Business Diagram Four Staged Infographics Arrow Diagram Presentation Template
Graphic of four staged info graphics arrow diagram has been used to craft this power point template diagram. This PPT diagram contains the concept of data and text representation. Use this PPT for marketing and business related presentations.
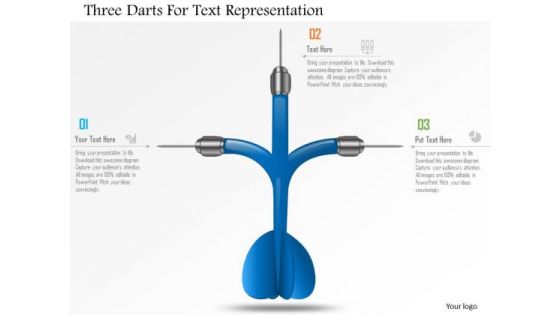
Business Diagram Three Darts For Text Representation Presentation Template
Graphic of three darts has been used to design this power point template. This PPT contains the concept of data representation. Use this PPT and build an exclusive presentation for your viewers.
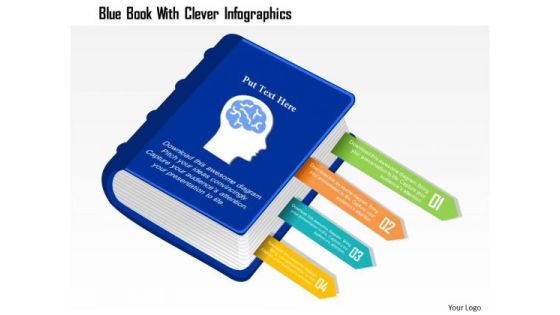
Business Diagram Blue Book With Clever Infographics Presentation Template
Graphic of blue book with clever info graphics has been used to craft this power point template. This PPT diagram contains the concept of educational data representation. Use this PPT for business and marketing related presentations.
Hands With Bulbs And Two Icons Powerpoint Template
Our above PPT slide contains graphics of hands holding idea bulbs. This business diagram helps to exhibit innovative ideas. Use this diagram to impart more clarity to data and to create more sound impact on viewers.

Profit Growth Graph With Gears Powerpoint Template
This business slide contains profit growth graph with gears. This PowerPoint template helps to display outline of business plan. Use this diagram to impart more clarity to data and to create more sound impact on viewers.

Stock Photo Small And Big Cubes For Text Representation PowerPoint Slide
This Power Point template has been crafted with graphic of cubes. This image slide contains the concept data representations. Use this editable image slide for your business and marketing related topics and to impress your viewers.

Business Diagram 3d Circular Infographics With Target Achievement PowerPoint Template
This power point template has been crafted with graphic of 3d circular info graphics. This PPT slide contains the concept of data representation and target achievement. This PPT can be used for target and success related presentations.
Business Diagram Navigation Icon Around Circle Presentation Template
Five staged business info graphics been used to design this power point template. This diagram contains the concept of data representation. Use this diagram for business and finance related presentations
Business Diagram Loudspeaker With Icons Dialogue Box Presentation Template
Graphic of loudspeaker and icons of dialogue box has been used to design this business diagram. This diagram contains the concept of business information communication. Use this diagram for data communication related presentation.
Business Diagram Loudspeaker With Web Icons Dialogue Box Presentation Template
Graphics of loudspeaker and icons of web with dialogue box have been used to design this business diagram. This diagram contains the concept of business information communication. Use this diagram for data communication related presentation.
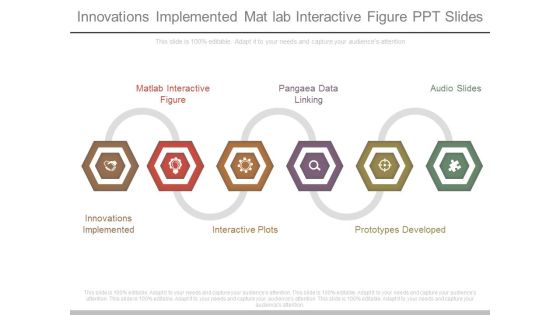
Innovations Implemented Mat Lab Interactive Figure Ppt Slides
This is a innovations implemented mat lab interactive figure ppt slides. This is a six stage process. The stages in this process are mat lab interactive figure, pangaea data linking, audio slides, innovations implemented, interactive plots, prototypes developed.
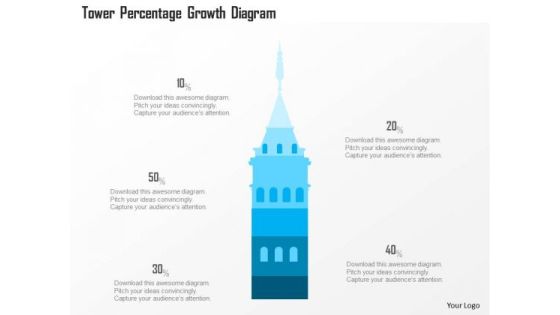
Business Diagram Tower Percentage Growth Diagram Presentation Template
This power point diagram slide has been crafted with graphic of 3d blue tower and text boxes. This PPT slide contains the concept of data and text representations. Use this PPT slide for your business and management related presentations.
Stock Photo Red Upload Arrow On Blue Cloud Icon PowerPoint Slide
This technical image slide has been designed with graphic of red upload arrow on cloud. This image slide explains the concept of data upload techniques with in the cloud service. Use this image slide for cloud computing related presentations.

Business Diagram Four Semicircular Arrow Diagram Presentation Template
Graphic of four semicircular arrow diagram has been used to craft this power point template diagram. This PPT diagram contains the concept of data and text representation. Use this PPT for marketing and business related presentations.
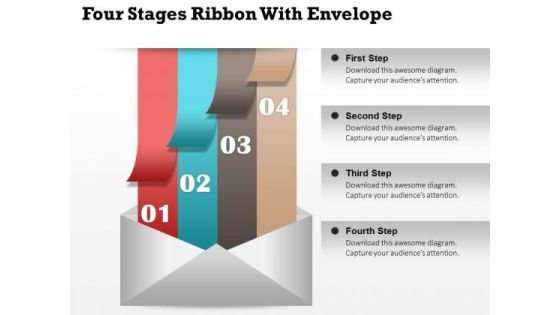
Business Diagram Four Stages Ribbon With Envelope Presentation Template
Concept of data storage and communication has been displayed in this business diagram with graphic of four colored ribbons and envelop. Use this diagram template for business communication related presentations.
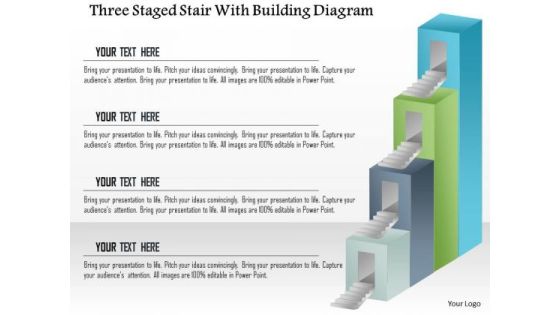
Business Diagram Three Staged Stair With Building Diagram Presentation Template
This Power Point template slide has been designed with graphic of three staged stair diagram. This PPT slide contains the concept of data representation. Use this PPt slide and build innovative presentation for your viewers.
Five Staged Colorful Tags With Multiple Icons PowerPoint Template
Five staged colorful tags and multiple icons has been used to craft this power point template. This diagram template contains the concept of data representation. Use this PPT for your business and marketing related presentations.
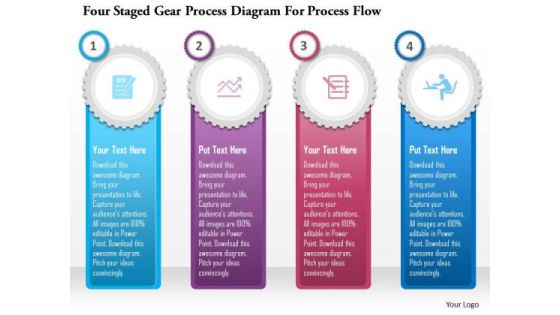
Business Diagram Four Staged Gear Process Diagram For Process Flow Presentation Template
Graphic of four staged gear process diagram has been used to design this power point template diagram. This PPT diagram contains the concept of data and process flow. Use this PPT for marketing and sales related presentations.
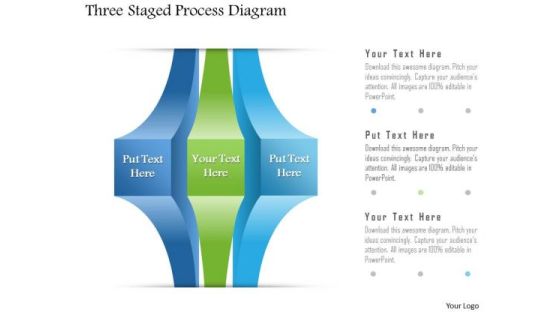
Business Diagram Three Staged Process Diagram PowerPoint Template
Three staged process diagram graphic has been used to design this power point template slide. This PPT contains the concept of data representation for business or marketing. Use this PPT for your business and sales related presentations.
Business Diagram Three Arrows With Human Icons Presentation Template
This power point template diagram has been designed with graphic of three arrows. This PPT contains the concept of text representation. Use this PPT for business and marketing data related presentations.
Four Tags With Mobile And Icons Powerpoint Template
Our above PPT slide contains graphics mobile with four tags and icons. This business diagram helps to display technology and communication concepts. Use this template to impart more clarity to data and to create more sound impact on viewers.
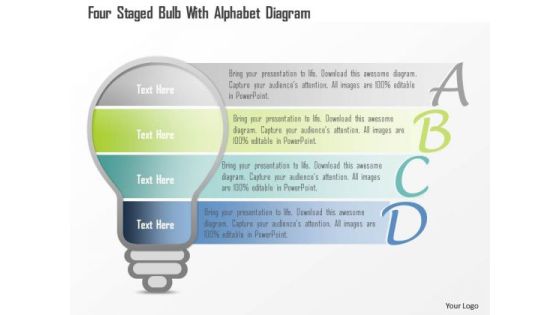
Business Diagram Four Staged Bulb With Alphabet Diagram PowerPoint Template
Four staged bulb with alphabet diagram has been used to design this power point template. This PPT diagram contains the concept of educational data representation. Use this PPT and build an exclusive presentation for education related topics.
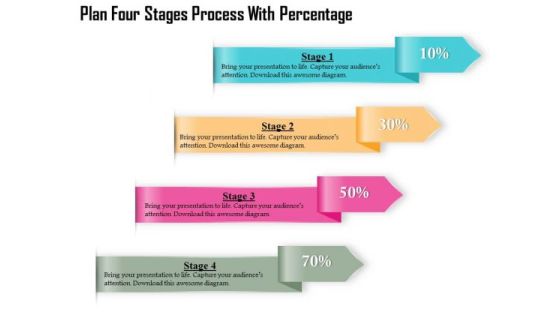
Business Diagram Four Stages Process With Percentage Presentation Template
Four multicolored tags in vertical order has been used to decorate this business diagram. This diagram contains the concept of financial data display with percent values. This diagram can be used for management and finance related presentations.
