AI PPT Maker
Templates
PPT Bundles
Design Services
Business PPTs
Business Plan
Management
Strategy
Introduction PPT
Roadmap
Self Introduction
Timelines
Process
Marketing
Agenda
Technology
Medical
Startup Business Plan
Cyber Security
Dashboards
SWOT
Proposals
Education
Pitch Deck
Digital Marketing
KPIs
Project Management
Product Management
Artificial Intelligence
Target Market
Communication
Supply Chain
Google Slides
Research Services
 One Pagers
All Categories
-
Home
- Customer Favorites
- Data Dashboard
Data Dashboard

Best Practices In Market Risk Ppt Sample
This is a best practices in market risk ppt sample. This is a five stage process. The stages in this process are trade management, risk management, physical operation, financial, market data and analytics.

Marketing Operating System Sample Diagram Powerpoint Presentation
This is a marketing operating system sample diagram powerpoint presentation. This is a five stage process. The stages in this process are data management, message delivery, confidentiality, partner management, directory, cross channel media, transformation, analytics and insights, delivery management, authentication.

Business Diagram Business People Over Bar Chart PowerPoint Template
This Power Point template has been designed with graphic of business people and bar chart. This PPT contains the concept of result analysis and business data display. Use this PPT slide for your business and marketing related presentations.

Graphical Representation Of Research IT Bivariate Analysis Techniques Formats PDF
This slide describes the second analysis technique, bivariate analysis for data visualization, which includes three plots line, bar, and scatter. Deliver and pitch your topic in the best possible manner with this graphical representation of research it bivariate analysis techniques formats pdf. Use them to share invaluable insights on bivariate analysis techniques for data visualization and impress your audience. This template can be altered and modified as per your expectations. So, grab it now.

Optimizing Educational Technology Powerpoint Templates Microsoft
This is a optimizing educational technology powerpoint templates microsoft. This is a six stage process. The stages in this process are information security, technology and analytics, institutional data management, optimizing educational technology, it workforce hiring and retention, it funding models.

Five Phases Of Corporate Analysis And Intervention Clipart PDF
This slide covers five phases of organizational diagnosis and intervention. It involves scouting, contracting, study design, data gathering and analysis and feedback. Presenting Five Phases Of Corporate Analysis And Intervention Clipart PDF to dispense important information. This template comprises five stages. It also presents valuable insights into the topics including Contracting, Data Gathering, Analysis. This is a completely customizable PowerPoint theme that can be put to use immediately. So, download it and address the topic impactfully.

Internet Security Threat Analysis Requirements And Goals Ideas PDF
This slide exhibits data breach security requirement with major goals and requirements. It includes multiple section like- securing cardholder data, manage vulnerability program and so on. Showcasing this set of slides titled internet security threat analysis requirements and goals ideas pdf. The topics addressed in these templates are internet security threat analysis requirements and goals. All the content presented in this PPT design is completely editable. Download it and make adjustments in color, background, font etc. as per your unique business setting.

Survey Analysis Of Brand Impression With Total Mean Template PDF
This slide shows the graphical representation of the data collected through a survey of brand impression on public. It includes data like reliable, practical, trustworthy, affordable, eco friendly etc. Showcasing this set of slides titled Survey Analysis Of Brand Impression With Total Mean Template PDF. The topics addressed in these templates are Brand Impression, Survey Analysis. All the content presented in this PPT design is completely editable. Download it and make adjustments in color, background, font etc. as per your unique business setting.
Four Circles Venn Diagram With Icons Powerpoint Slides
Four circles Venn diagram has been used to design this power point template. This PPT helps to portray the concept of business data analysis. Use this PPT for your business and marketing related presentations.
Two Circles Venn Diagram With Icons Powerpoint Slides
Venn diagram of two circles has been used to design this power point template. This PPT helps to portray the concept of business data analysis. Use this PPT for your business and marketing related presentations.

User Experience Management With Database Diagram Slides
This is a user experience management with database diagram slides. This is a six stage process. The stages in this process are web, harvesting, text database, linguistic analysis, refinement, fact database, data analysis, web ui, alerts, api, user experience.

Business Framework 10 Percent To 90 Percent PowerPoint Presentation
This business diagram has been designed with graphic of multiple pie graphs. This diagram slide contains the concept of result analysis with percentage values. Use this diagram to present and compare data in an impressive manner
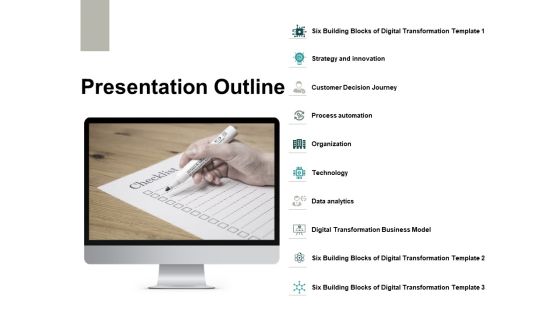
Presentation Outline Ppt PowerPoint Presentation Gallery Templates
This is a presentation outline ppt powerpoint presentation gallery templates. This is a ten stage process. The stages in this process are technology, organization, data analytics, process automation, strategy.

IT Company New Venture Cost Analysis Ideas PDF
This slide shows the comparison of actual and budgeted cost of a IT startup. It includes various costs such as license, data storage, software development, hardware, etc. Showcasing this set of slides titled IT Company New Venture Cost Analysis Ideas PDF. The topics addressed in these templates are Data Storage System, Software Development, Budget. All the content presented in this PPT design is completely editable. Download it and make adjustments in color, background, font etc. as per your unique business setting.

Channel Management Reviews Diagram Presentation Backgrounds
This is a channel management reviews diagram presentation backgrounds. This is a six stage process. The stages in this process are channel identification, market and data analysis, trade interviews, result analysis, strategy development, field audits.
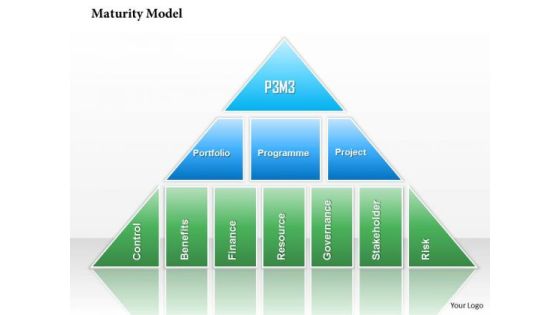
Business Framework Maturity Model PowerPoint Presentation
Graphic of CMM is used to design this business framework power point template. This PPT contains the maturity model for analysis based on the data collected from organization. Use this PPT and create a curve for analysis.

Cloud Technology Ecosystem And Tools Ppt Images Gallery
This is a cloud technology ecosystem and tools ppt images gallery. This is a nine stage process. The stages in this process are databases, storage, big four, specialized, infrastructure, data center, large analytic, service.

Business Diagram Six Pie Charts For Result Representation And Percentage Presentation Template
Display the concept of result analysis in your business presentation. This PPT slide contains the graphic of six pie charts. Use this PPT slide for your business and marketing data related presentations.
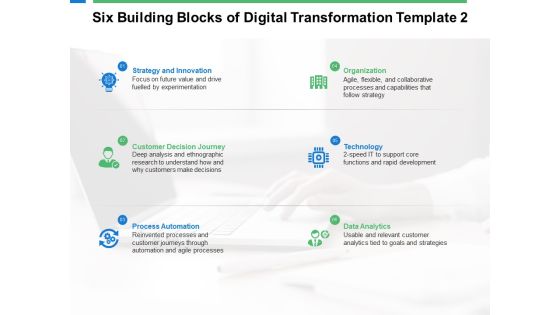
Six Building Blocks Of Digital Transformation Technology Ppt PowerPoint Presentation Infographic Template Guide
This is a six building blocks of digital transformation technology ppt powerpoint presentation infographic template guide. This is a six stage process. The stages in this process are process automation, organization, technology, data and analytics, strategy and innovation.

Business Intelligence Journey Example Ppt Samples Download
This is a business intelligence journey example ppt samples download. This is a five stage process. The stages in this process are automating clerical work, data proficiency, mastering technology, analytic proficiency, computer literacy.

Six Building Blocks Of Digital Transformation Strategy Ppt PowerPoint Presentation Gallery Model
This is a six building blocks of digital transformation strategy ppt powerpoint presentation gallery model. This is a six stage process. The stages in this process are technology, organization, data analytics, process automation, strategy.

Six Building Blocks Of Digital Transformation Ppt PowerPoint Presentation Pictures Example
This is a six building blocks of digital transformation ppt powerpoint presentation pictures example. This is a six stage process. The stages in this process are technology, organization, data analytics, process automation, strategy.

Business Operations Strategy Model Ppt PowerPoint Presentation Complete Deck With Slides
This is a business operations strategy model ppt powerpoint presentation complete deck with slides. This is a one stage process. The stages in this process are business process, finance, analysis, marketing, data analysis.
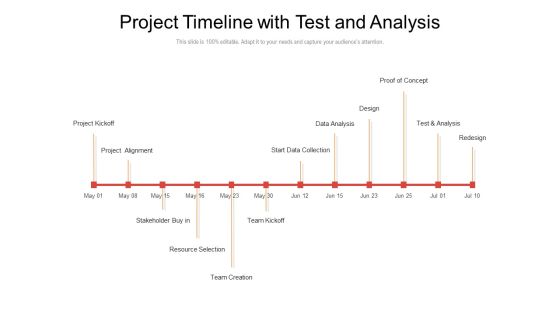
Project Timeline With Test And Analysis Ppt PowerPoint Presentation Inspiration Master Slide PDF
Presenting this set of slides with name project timeline with test and analysis ppt powerpoint presentation inspiration master slide pdf. This is a one stage process. The stages in this process are project kickoff, project alignment, start data collection, data analysis, design, proof of concept, test and analysis, redesign, stakeholder buy in, resource selection, team kickoff, team creation. This is a completely editable PowerPoint presentation and is available for immediate download. Download now and impress your audience.

Sample Of Quality Management System Elements Ppt Summary
This is a sample of quality management system elements ppt summary. This is a three stage process. The stages in this process are customer focus, resources, processes, quality objective, continual improvement, data based analytics, customer satisfaction.

Provider Cloud Watson Explorer Ppt Samples
This is a provider cloud watson explorer ppt samples. This is a four stage process. The stages in this process are provider cloud, watson explorer, data click, analytics discovery and exploration.

Benefits Of Quality Management Diagram Ppt Presentation
This is a benefits of quality management diagram ppt presentation. This is a three stage process. The stages in this process are customer focus, resources, processes, quality objective, drivers, continual improvement, data based analytics, customer satisfaction, enablers, results.
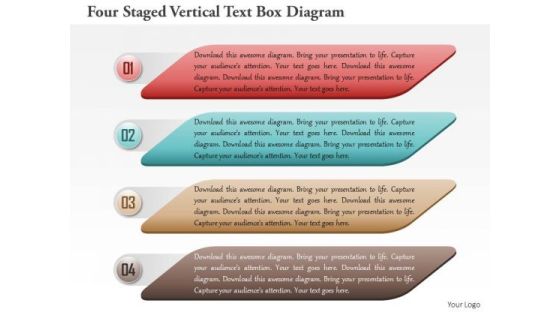
Business Diagram Four Staged Vertical Text Box Diagram Presentation Template
This PPT slide contains the concept of business data analysis. This Power Point template slide has been designed with graphic of four staged vertical text boxes diagram. Use this PPT slide and build an innovative presentation for your viewers.

Automated Medical Marketing Ppt Powerpoint Slide
This is an automated medical marketing ppt powerpoint slide. This is a nine stage process. The stages in this process are campaign automation, segmenting, business empowerment, social sharing, lead scoring, lead scoring, digital body language, campaign analysis, data integration.

Customer Experience Management Strategy Ppt Powerpoint Image
This is a customer experience management strategy ppt powerpoint image. This is a eight stage process. The stages in this process are customer touch point, segment mg, billing, tariffs and pricing, social media, network, big data analytics, crm.

Sample Of Three Types Of Internet Of Things Diagram Ppt Slides
This is a sample of three types of internet of things diagram ppt slides. This is a three stage process. The stages in this process are things with networked sensors, analytic engines, data storage.
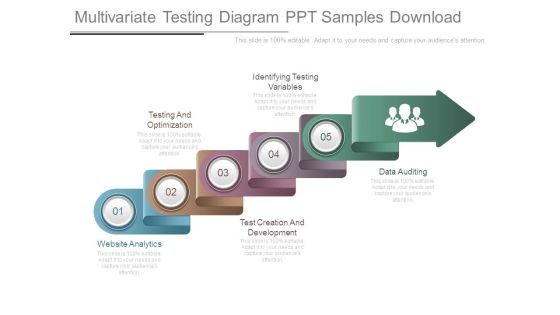
Multivariate Testing Diagram Ppt Samples Download
This is a multivariate testing diagram ppt samples download. This is a five stage process. The stages in this process are website analytics, testing and optimization, test creation and development, identifying testing variables, data auditing.
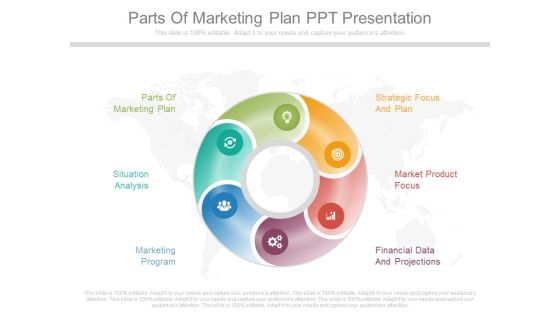
Parts Of Marketing Plan Ppt Presentation
This is a parts of marketing plan ppt presentation. This is a six stage process. The stages in this process are parts of marketing plan, strategic focus and plan, situation analysis, market product focus, marketing program, financial data and projections.
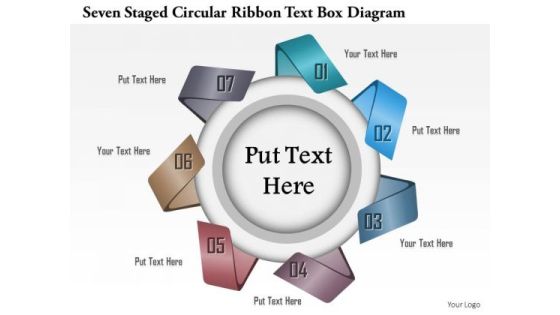
Business Diagram Seven Staged Circular Ribbon Text Box Diagram Presentation Template
This Power Point template slide has been used to display the concept of business data analysis. This PPT slide contains the graphic of seven staged circular ribbon style text boxes. Use this PPT slide for your business presentations.
Business Diagram Six Staged Pin Style Text Box Diagram Presentation Template
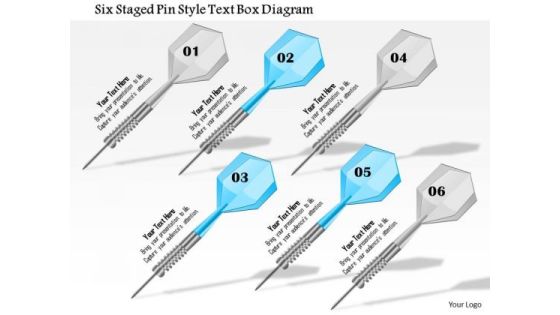
This Power Point template slide has been crafted with graphic of six staged pin style text boxes. This PPT slide contain the concept of sales data analysis. Use this PPT slide for your business and sales related presentations.
MIS Extract Transform Load ETL Ppt PowerPoint Presentation Slides Infographics PDF
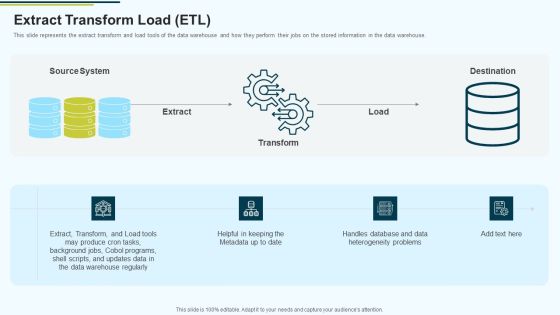
This slide represents the extract transform and load tools of the data warehouse and how they perform their jobs on the stored information in the data warehouse.Deliver and pitch your topic in the best possible manner with this MIS Extract Transform Load ETL Ppt PowerPoint Presentation Slides Infographics PDF Use them to share invaluable insights on Warehouse Regularly, Heterogeneity Problems, Handles Database and impress your audience. This template can be altered and modified as per your expectations. So, grab it now.

Channel And Market Intelligence Example Powerpoint Slide Designs
This is a channel and market intelligence example powerpoint slide designs. This is a five stage process. The stages in this process are channel identification, market and data analysis, field audits, trade interviews, strategy development.

Channel Strategy And Route To Market Ppt Presentation Deck
This is a channel strategy and route to market ppt presentation deck. This is a five stage process. The stages in this process are channel identification, market and data analysis, field audits, trade interviews, strategy development.
Pricing In Marketing Channels Diagram Powerpoint Slides Download
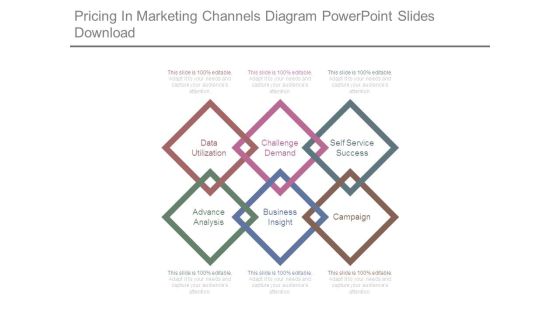
This is a pricing in marketing channels diagram powerpoint slides download. This is a six stage process. The stages in this process are data utilization, challenge demand, self service success, advance analysis, business insight, campaign.

Marketing And Distribution Research Template Powerpoint Slide Backgrounds
This is a marketing and distribution research template powerpoint slide backgrounds. This is a six stage process. The stages in this process are product research, brand valuation, social network distribution, major online media, data processing, web survey analysis.
RPA IT Top Trending Tools In RPA Market Ppt Slides Show PDF
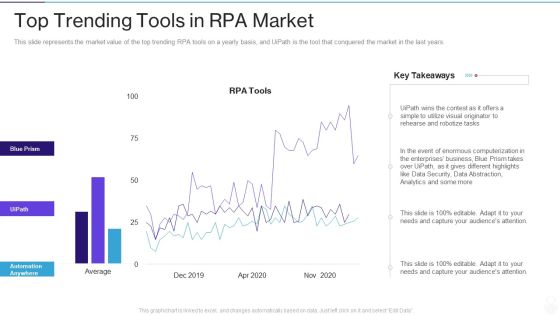
This slide represents the market value of the top trending RPA tools on a yearly basis, and UiPath is the tool that conquered the market in the last years. Deliver an awe inspiring pitch with this creative rpa it top trending tools in rpa market ppt slides show pdf bundle. Topics like data security, analytics, business, data abstraction, utilize visual can be discussed with this completely editable template. It is available for immediate download depending on the needs and requirements of the user.

Channel Strategy And Route To Market Ppt Powerpoint Guide
This is a channel strategy and route to market ppt powerpoint guide. This is a five stage process. The stages in this process are market and data analysis, trade interviews, channel identification, field audits, strategy development.
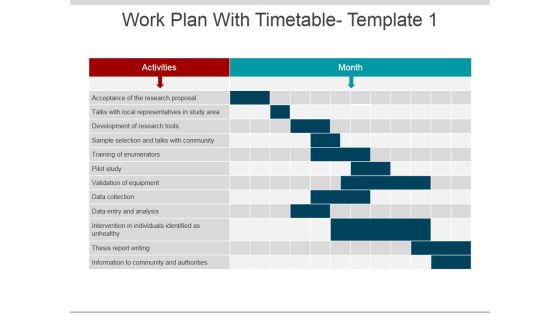
Work Plan With Timetable Template 1 Ppt PowerPoint Presentation Layouts Example File
This is a work plan with timetable template 1 ppt powerpoint presentation layouts example file. This is a two stage process. The stages in this process are activities, month, thesis report writing, data collection, pilot study.

Content Ppt PowerPoint Presentation File Display
This is a content ppt powerpoint presentation file display. This is a six stage process. The stages in this process are introduction, data analysis, cost of quality, quality control.
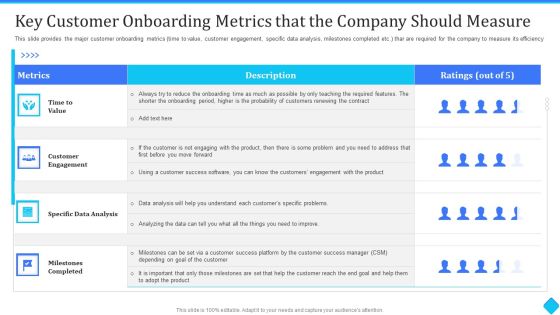
Key Customer Onboarding Metrics That The Company Should Measure Structure PDF
This slide provides the major customer onboarding metrics time to value, customer engagement, specific data analysis, milestones completed etc. thar are required for the company to measure its efficiency. Deliver an awe-inspiring pitch with this creative key customer onboarding metrics that the company should measure structure pdf bundle. Topics like time to value, customer engagement, specific data analysis can be discussed with this completely editable template. It is available for immediate download depending on the needs and requirements of the user.
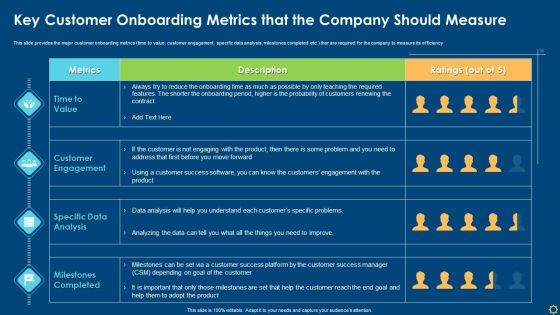
Key Customer Onboarding Metrics That The Company Should Measure Infographics PDF
This slide provides the major customer onboarding metrics time to value, customer engagement, specific data analysis, milestones completed etc. thar are required for the company to measure its efficiency Deliver an awe inspiring pitch with this creative key customer onboarding metrics that the company should measure infographics pdf bundle. Topics like customer engagement, data analysis, customer success can be discussed with this completely editable template. It is available for immediate download depending on the needs and requirements of the user.

Overview Of Key Insights From Cyber Threat Statistics Themes PDF
This slide covers statistics based on cyber crime trends. It includes stats on data thefts, mobile securities, security skills, data breach cost, etc. Showcasing this set of slides titled Overview Of Key Insights From Cyber Threat Statistics Themes PDF. The topics addressed in these templates are Overview Of Key Insights, Cyber Threat Statistics . All the content presented in this PPT design is completely editable. Download it and make adjustments in color, background, font etc. as per your unique business setting.

Content Ppt PowerPoint Presentation Inspiration Microsoft
This is a Content Ppt PowerPoint Presentation Inspiration Microsoft. This is a six stage process. The stages in this process are introduction, principles and certification, tools of quality management, data analysis, cost of quality, quality control.

Architecture Of Google Cloud Google Cloud Computing System Topics PDF
This slide describes the architecture of the Google cloud, how data is stored, and covers regions, zones, and load balancers that help store data. Deliver an awe inspiring pitch with this creative Architecture Of Google Cloud Google Cloud Computing System Topics PDF bundle. Topics like Examines Instance, Various Regions, Clients Distribute can be discussed with this completely editable template. It is available for immediate download depending on the needs and requirements of the user.

Architecture Of Organization After Migrating To Google Cloud Google Cloud Computing System Demonstration PDF
This slide depicts the architecture of the organization of migrating to Google cloud and how data processing approaches are changed.Deliver an awe inspiring pitch with this creative Architecture Of Organization After Migrating To Google Cloud Google Cloud Computing System Demonstration PDF bundle. Topics like Systems Engagement, Unified Data, Systems Record can be discussed with this completely editable template. It is available for immediate download depending on the needs and requirements of the user.

Assurance And Verification Powerpoint Slide Rules
This is a assurance and verification powerpoint slide rules. This is a four stage process. The stages in this process are assurance and verification, content development, data analysis, project management.

Role Of Email In Regular Business Communication Pictures PDF
This slide mentions the role of email in everyday business communication. It includes information transfer, marketing and promotional services and data sharing .Showcasing this set of slides titled Role Of Email In Regular Business Communication Pictures PDF The topics addressed in these templates are Information Transfer, Promotional Services, Data Sharing All the content presented in this PPT design is completely editable. Download it and make adjustments in color, background, font etc. as per your unique business setting.

Channel Assessment Diagram Ppt Infographic Template
This is a channel assessment diagram ppt infographic template. This is a five stage process. The stages in this process are channel identification, market and data analysis, field audits, trade interviews, strategy development.

Seed Funding Ppt PowerPoint Presentation Complete Deck With Slides
This is a seed funding ppt powerpoint presentation complete deck with slides. This is a one stage process. The stages in this process are tables, teamwork, technology, data analysis, marketing.
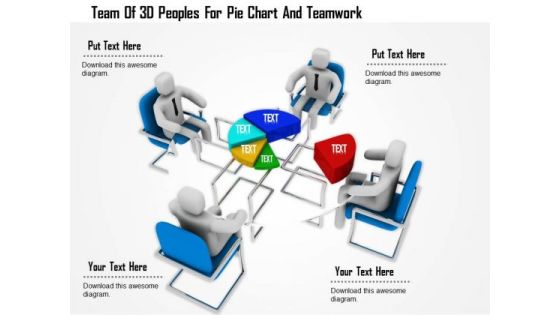
Team Of 3d Peoples For Pie Chart And Teamwork
This Power Point template has been designed with graphic of 3d team forming a pie chart. In this slide team is displaying data analysis. Use this editable slide to build innovative presentation for your viewers.

Team With Bar Graph And Teamwork
This Power Point template has been designed with graphic of 3d team forming a pie chart. In this slide team is displaying data analysis and comparison. Use this editable slide to build innovative presentation for your viewers.

Customer Touch Points Powerpoint Presentation Examples
This is a customer touch points powerpoint presentation examples. This is a four stage process. The stages in this process are customer touch points, social media, big data analysis, tariffs and pricing.

Continuous Auditing Business Template Ppt Model
This is a continuous auditing business template ppt model. This is a six stage process. The stages in this process are risk management, work program execution, continuous auditing, audit plan management, data analysis, continuous monitoring.

Structural Engineering Ppt Template Powerpoint Templates
This is a structural engineering ppt template powerpoint templates. This is a four stage process. The stages in this process are structural analysis, architectural design, numerical method, data design.

Energy Administration Flowchart Diagram Presentation Visuals
This is a energy administration flowchart diagram presentation visuals. This is a five stage process. The stages in this process are inventory, measurement, data analysis, assessment of funding, implication.
