Data Dashboard

Dashboard For Corona Virus Effect On India Hospitality Industry Download PDF
Pitch your topic with ease and precision using this Dashboard For Corona Virus Effect On India Hospitality Industry Download PDF. This layout presents information on Business Trips, Contribution, Employment. It is also available for immediate download and adjustment. So, changes can be made in the color, design, graphics or any other component to create a unique layout.

Guide To Healthcare Services Administration Dashboard To Evaluate The Hospital Operations Performance Infographics PDF
The following slide showcases dashboard which can be used by the healthcare professionals to measure the performance of operational department. The KPIs covered in the slide are total patients, operational cost, available staff per division etc. If your project calls for a presentation, then Slidegeeks is your go to partner because we have professionally designed, easy to edit templates that are perfect for any presentation. After downloading, you can easily edit Guide To Healthcare Services Administration Dashboard To Evaluate The Hospital Operations Performance Infographics PDF and make the changes accordingly. You can rearrange slides or fill them with different images. Check out all the handy templates
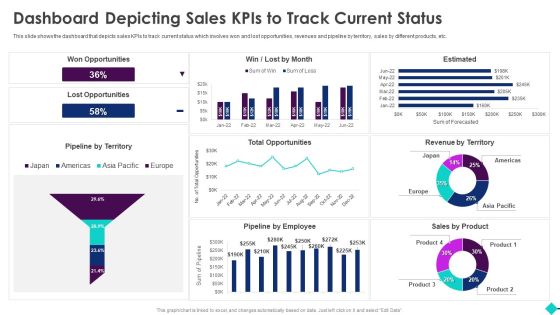
Sales Process Automation For Revenue Growth Dashboard Depicting Sales Kpis To Track Current Status Introduction PDF
This slide shows the dashboard that depicts sales KPIs to track current status which involves won and lost opportunities, revenues and pipeline by territory, sales by different products, etc.Deliver and pitch your topic in the best possible manner with this Sales Process Automation For Revenue Growth Dashboard Depicting Sales Kpis To Track Current Status Introduction PDF. Use them to share invaluable insights on Marketing Effectiveness, Forecast Accuracy, Pipeline Thickness and impress your audience. This template can be altered and modified as per your expectations. So, grab it now.

Sales Procedure Automation To Enhance Sales Dashboard Depicting Sales Kpis To Track Current Status Introduction PDF
This slide shows the dashboard that depicts sales KPIs to track current status which involves won and lost opportunities, revenues and pipeline by territory, sales by different products, etc.Deliver an awe inspiring pitch with this creative Sales Procedure Automation To Enhance Sales Dashboard Depicting Sales Kpis To Track Current Status Introduction PDF bundle. Topics like Won Opportunities, Total Opportunities, Pipeline Employee can be discussed with this completely editable template. It is available for immediate download depending on the needs and requirements of the user.
Ecommerce Website Creation Action Steps Playbook Dashboard Tracking Essential Kpis For Ecommerce Download PDF
Do you have to make sure that everyone on your team knows about any specific topic. I yes, then you should give Ecommerce Website Creation Action Steps Playbook Dashboard Tracking Essential Kpis For Ecommerce Download PDF a try. Our experts have put a lot of knowledge and effort into creating this impeccable Ecommerce Website Creation Action Steps Playbook Dashboard Tracking Essential Kpis For Ecommerce Download PDF. You can use this template for your upcoming presentations, as the slides are perfect to represent even the tiniest detail. You can download these templates from the Slidegeeks website and these are easy to edit. So grab these today.

Action Plan To Enhance Client Service Customer Service Dashboard To Monitor Kpis Clipart PDF
This slide showcases support service dashboard to track relevant performance metrics. Major KPIs covered are customer satisfaction, average time to resolve problem, cost per support, customer retention, request volume, etc. Make sure to capture your audiences attention in your business displays with our gratis customizable Action Plan To Enhance Client Service Customer Service Dashboard To Monitor Kpis Clipart PDF. These are great for business strategies, office conferences, capital raising or task suggestions. If you desire to acquire more customers for your tech business and ensure they stay satisfied, create your own sales presentation with these plain slides.
Market Evaluation Of IT Industry Marketing Campaign Dashboard For B2b Marketers Icons PDF
The following slide showcases key performance indicator KPI dashboard that can assist managers to evaluate digital marketing campaign performance. The key metrics mentioned in the slide are click through rate CTR, conversion rate, cost per click CPC, etc. Make sure to capture your audiences attention in your business displays with our gratis customizable Market Evaluation Of IT Industry Marketing Campaign Dashboard For B2b Marketers Icons PDF. These are great for business strategies, office conferences, capital raising or task suggestions. If you desire to acquire more customers for your tech business and ensure they stay satisfied, create your own sales presentation with these plain slides.
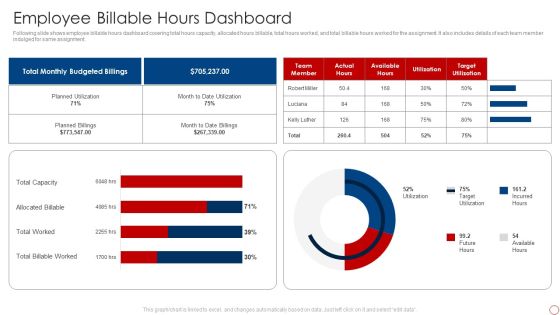
Kpis For Evaluating Business Sustainability Employee Billable Hours Dashboard Professional PDF
Following slide shows employee billable hours dashboard covering total hours capacity, allocated hours billable, total hours worked, and total billable hours worked for the assignment. It also includes details of each team member indulged for same assignment. Deliver and pitch your topic in the best possible manner with this Kpis For Evaluating Business Sustainability Employee Billable Hours Dashboard Professional PDF. Use them to share invaluable insights on Total Billable Worked, Total Worked, Allocated Billable, Total Capacity and impress your audience. This template can be altered and modified as per your expectations. So, grab it now.
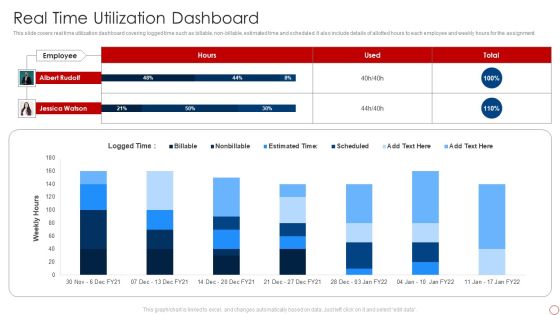
Kpis For Evaluating Business Sustainability Real Time Utilization Dashboard Portrait PDF
This slide covers real time utilization dashboard covering logged time such as billable, non-billable, estimated time and scheduled. It also include details of allotted hours to each employee and weekly hours for the assignment. Deliver an awe inspiring pitch with this creative Kpis For Evaluating Business Sustainability Real Time Utilization Dashboard Portrait PDF bundle. Topics like Logged Time, Employee, Albert Rudolf can be discussed with this completely editable template. It is available for immediate download depending on the needs and requirements of the user.
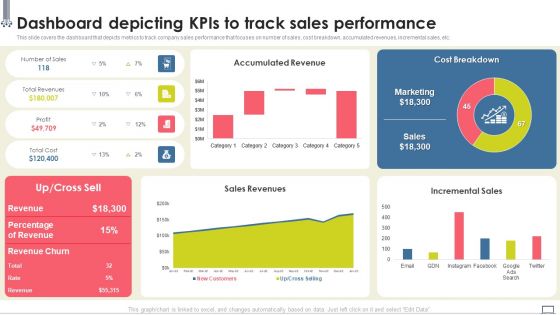
Change Management Strategy Dashboard Depicting Kpis To Track Sales Performance Ideas PDF
This slide covers the dashboard that depicts metrics to track company sales performance that focuses on number of sales, cost breakdown, accumulated revenues, incremental sales, etc. From laying roadmaps to briefing everything in detail, our templates are perfect for you. You can set the stage with your presentation slides. All you have to do is download these easy-to-edit and customizable templates. Change Management Strategy Dashboard Depicting Kpis To Track Sales Performance Ideas PDF will help you deliver an outstanding performance that everyone would remember and praise you for. Do download this presentation today.

Transition Plan For Business Management Dashboard Depicting Kpis To Track Sales Performance Template PDF
This slide covers the dashboard that depicts metrics to track company sales performance that focuses on number of sales, cost breakdown, accumulated revenues, incremental sales, etc. From laying roadmaps to briefing everything in detail, our templates are perfect for you. You can set the stage with your presentation slides. All you have to do is download these easy-to-edit and customizable templates. Transition Plan For Business Management Dashboard Depicting Kpis To Track Sales Performance Template PDF will help you deliver an outstanding performance that everyone would remember and praise you for. Do download this presentation today.

Change Management Process Dashboard Depicting Kpis To Track Sales Performance Introduction PDF
This slide covers the dashboard that depicts metrics to track company sales performance that focuses on number of sales, cost breakdown, accumulated revenues, incremental sales, etc. From laying roadmaps to briefing everything in detail, our templates are perfect for you. You can set the stage with your presentation slides. All you have to do is download these easy-to-edit and customizable templates. Change Management Process Dashboard Depicting Kpis To Track Sales Performance Introduction PDF will help you deliver an outstanding performance that everyone would remember and praise you for. Do download this presentation today.

Digital Marketing Guide For B2B Firms Dashboard To Track Social Media Marketing Campaign Metrics Demonstration PDF
This slide showcases dashboard that can help organization to track the metrics of social media marketing campaign. Its key components are followers, post reach, page impressions, visitors, avg engagement and lifetime views.Deliver an awe inspiring pitch with this creative Digital Marketing Guide For B2B Firms Dashboard To Track Social Media Marketing Campaign Metrics Demonstration PDF bundle. Topics like Page Impressions, New Followers, Talking About can be discussed with this completely editable template. It is available for immediate download depending on the needs and requirements of the user.

Dashboard For Information Technology Incident Risk Assessment SLA Warnings Sample PDF
This slide highlights detailed assessment of open incident and service requests by team and management for ensuring smooth operations of IT department.Showcasing this set of slides titled Dashboard For Information Technology Incident Risk Assessment SLA Warnings Sample PDF The topics addressed in these templates are Open Incidents, Requests By Service, Open Incidents All the content presented in this PPT design is completely editable. Download it and make adjustments in color, background, font etc. as per your unique business setting.
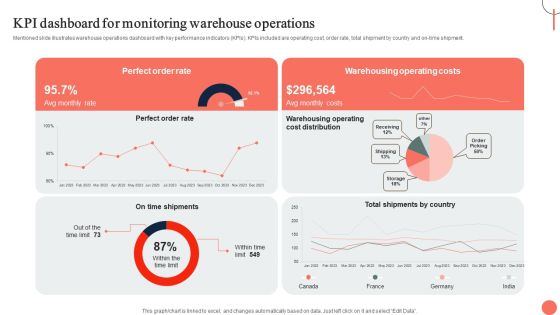
Strategies For Dynamic Supply Chain Agility KPI Dashboard For Monitoring Warehouse Operations Download PDF
Mentioned slide illustrates warehouse operations dashboard with key performance indicators KPIs. KPIs included are operating cost, order rate, total shipment by country and on-time shipment. Slidegeeks is one of the best resources for PowerPoint templates. You can download easily and regulate Strategies For Dynamic Supply Chain Agility KPI Dashboard For Monitoring Warehouse Operations Download PDF for your personal presentations from our wonderful collection. A few clicks is all it takes to discover and get the most relevant and appropriate templates. Use our Templates to add a unique zing and appeal to your presentation and meetings. All the slides are easy to edit and you can use them even for advertisement purposes.
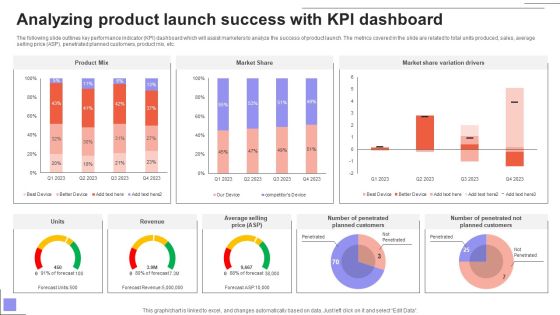
Overview Of The Food Analyzing Product Launch Success With KPI Dashboard Mockup PDF
The following slide outlines key performance indicator KPI dashboard which will assist marketers to analyze the success of product launch. The metrics covered in the slide are related to total units produced, sales, average selling price ASP, penetrated planned customers, product mix, etc. Find a pre-designed and impeccable Overview Of The Food Analyzing Product Launch Success With KPI Dashboard Mockup PDF. The templates can ace your presentation without additional effort. You can download these easy-to-edit presentation templates to make your presentation stand out from others. So, what are you waiting for Download the template from Slidegeeks today and give a unique touch to your presentation.
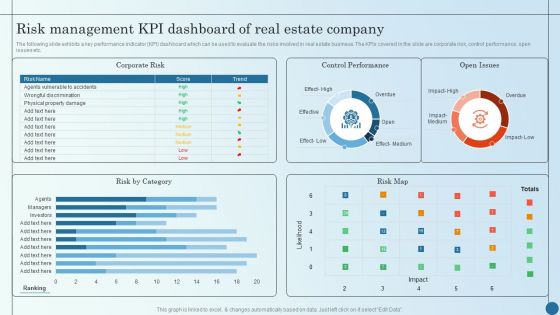
Risk Management KPI Dashboard Of Real Estate Company Managing Commercial Property Risks Elements PDF
The following slide exhibits a key performance indicator KPI dashboard which can be used to evaluate the risks involved in real estate business. The KPIs covered in the slide are corporate risk, control performance, open issues etc.Deliver an awe inspiring pitch with this creative Risk Management KPI Dashboard Of Real Estate Company Managing Commercial Property Risks Elements PDF bundle. Topics like Control Performance, Corporate Risk, Effect Medium can be discussed with this completely editable template. It is available for immediate download depending on the needs and requirements of the user.

Successful Risk Administration KPI Dashboard To Track Effectiveness Of Real Estate Business Template PDF
The following slide exhibits key performance indicator KPI dashboard which can be used to measure the financial performance of the real estate company. It covers various kpis such as sales vs target per agent, top 10 projects, top 5 agencies etc. If your project calls for a presentation, then Slidegeeks is your go-to partner because we have professionally designed, easy-to-edit templates that are perfect for any presentation. After downloading, you can easily edit Successful Risk Administration KPI Dashboard To Track Effectiveness Of Real Estate Business Template PDF and make the changes accordingly. You can rearrange slides or fill them with different images. Check out all the handy templates.

Direct Marketing Techniques To Enhance Business Presence Social Media Marketing Dashboard To Evaluate Rules PDF
The purpose of this slide is to highlight key performance indicator KPI dashboard which will assist marketers to analyze company performance across social media platforms. The kpis outlined in slide are social media followers, page likes, etc. Make sure to capture your audiences attention in your business displays with our gratis customizable Direct Marketing Techniques To Enhance Business Presence Social Media Marketing Dashboard To Evaluate Rules PDF. These are great for business strategies, office conferences, capital raising or task suggestions. If you desire to acquire more customers for your tech business and ensure they stay satisfied, create your own sales presentation with these plain slides.
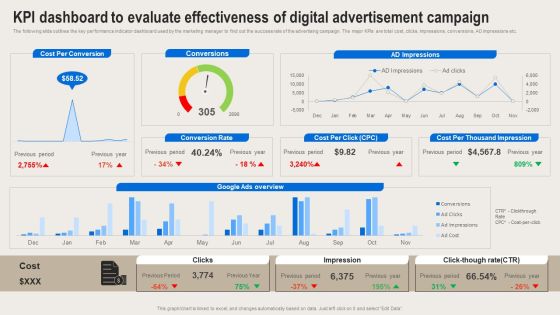
Formulating Branding Strategy To Enhance Revenue And Sales KPI Dashboard To Evaluate Effectivenessl Clipart PDF
The following slide outlines the key performance indicator dashboard used by the marketing manager to find out the success rate of the advertising campaign. The major KPIs are total cost, clicks, impressions, conversions, AD impressions etc. There are so many reasons you need a Formulating Branding Strategy To Enhance Revenue And Sales KPI Dashboard To Evaluate Effectivenessl Clipart PDF. The first reason is you cannot spend time making everything from scratch, Thus, Slidegeeks has made presentation templates for you too. You can easily download these templates from our website easily.
Warehouse Automation Deployment Dashboard For Tracking Impact Of Warehouse House Infographics PDF
This slide covers the dashboard with after automation warehouse overview. It include KPIs such as autonomous robots status, robotic arms status, battery level, performance, time to return, etc. Deliver and pitch your topic in the best possible manner with this Warehouse Automation Deployment Dashboard For Tracking Impact Of Warehouse House Infographics PDF. Use them to share invaluable insights on Autonomous Robot, Systems Engineer, Warehouse Manager and impress your audience. This template can be altered and modified as per your expectations. So, grab it now.

Analysis Plan For E Commerce Promotion Tactics Dashboard To Assess Social Posts Content Quality Sample PDF
This slide indicates the Dashboard to Assess Social Posts Content Quality. It provides information regarding the top published articles, story turnaround time, average number of comments per article and digital subscribers gained. This modern and well arranged Analysis Plan For E Commerce Promotion Tactics Dashboard To Assess Social Posts Content Quality Sample PDF provides lots of creative possibilities. It is very simple to customize and edit with the Powerpoint Software. Just drag and drop your pictures into the shapes. All facets of this template can be edited with Powerpoint no extra software is necessary. Add your own material, put your images in the places assigned for them, adjust the colors, and then you can show your slides to the world, with an animated slide included.
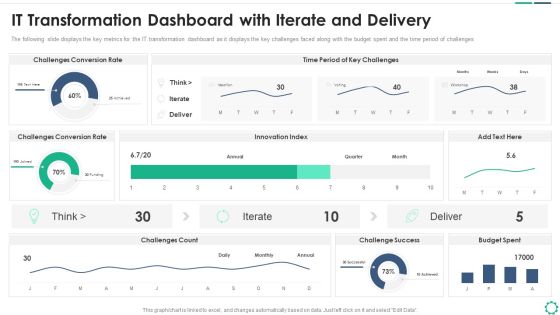
Digitalization Plan For Business Modernization IT Transformation Dashboard With Iterate And Delivery Infographics PDF
The following slide displays the key metrics for the IT transformation dashboard as it displays the key challenges faced along with the budget spent and the time period of challenges. Deliver an awe inspiring pitch with this creative digitalization plan for business modernization it transformation dashboard with iterate and delivery infographics pdf bundle. Topics like challenges conversion rate, innovation index, challenges count, challenge success, budget spent, time period of key challenges can be discussed with this completely editable template. It is available for immediate download depending on the needs and requirements of the user.

Tactical Brand Extension Launching Kpi Dashboard To Monitor Sales And Orders Formats PDF
Following slide displays sales and orders performance monitoring dashboard. Key performance indicators covered in the slide are return reasons, perfect order rate, total orders, top seller by orders. From laying roadmaps to briefing everything in detail, our templates are perfect for you. You can set the stage with your presentation slides. All you have to do is download these easy-to-edit and customizable templates. Tactical Brand Extension Launching Kpi Dashboard To Monitor Sales And Orders Formats PDF will help you deliver an outstanding performance that everyone would remember and praise you for. Do download this presentation today.

People Engagement Performance Dashboard With Variables Growth Ppt Summary Example PDF
This slide shows a People Engagement Performance Dashboard with variables such as engagement score, recognition rate, satisfaction rate, company knowledge rate and other key metrics of employee engagement. Deliver and pitch your topic in the best possible manner with this people engagement performance dashboard with variables growth ppt summary example pdf. Use them to share invaluable insights on 10 key metrics of employee engagement, employee engagement score and impress your audience. This template can be altered and modified as per your expectations. So, grab it now.

Client Acquisition Cost For Customer Retention Search Engine Marketing Dashboard For CAC Calculation Infographics PDF
This slide shows a Search Engine Marketing Dashboard with details such as lead form paid search, CAC, top performing campaigns, cost per conversion, cost per click etc. Deliver an awe inspiring pitch with this creative client acquisition cost for customer retention search engine marketing dashboard for cac calculation infographics pdf bundle. Topics like performing, campaign, social media, marketing, customer acquisition cost can be discussed with this completely editable template. It is available for immediate download depending on the needs and requirements of the user.
Shipping And Logistics Tracking Dashboard With Shipments And Fleet Status Elements PDF
This slide covers Key performance indicators to track the automation system of the company. This dashboard includes Logistics Efficiency Status, delivery time accuracy etc. Take your projects to the next level with our ultimate collection of Shipping And Logistics Tracking Dashboard With Shipments And Fleet Status Elements PDF. Slidegeeks has designed a range of layouts that are perfect for representing task or activity duration, keeping track of all your deadlines at a glance. Tailor these designs to your exact needs and give them a truly corporate look with your own brand colors they ll make your projects stand out from the rest.
Robotic Process Automation Shipping And Logistics Tracking Dashboard With Shipments Clipart PDF
This slide covers Key performance indicators to track the automation system of the company. This dashboard includes Logistics Efficiency Status, delivery time accuracy etc. If your project calls for a presentation, then Slidegeeks is your go-to partner because we have professionally designed, easy-to-edit templates that are perfect for any presentation. After downloading, you can easily edit Robotic Process Automation Shipping And Logistics Tracking Dashboard With Shipments Clipart PDF and make the changes accordingly. You can rearrange slides or fill them with different images. Check out all the handy templates

People Engagement Performance Dashboard With Variables Ppt Gallery Example File PDF
This slide shows a People Engagement Performance Dashboard with variables such as engagement score, recognition rate, satisfaction rate, company knowledge rate and other key metrics of employee engagement. Deliver and pitch your topic in the best possible manner with this people engagement performance dashboard with variables ppt gallery example file pdf. Use them to share invaluable insights on personal growth, employee engagement score, employee engagement metrics and impress your audience. This template can be altered and modified as per your expectations. So, grab it now.
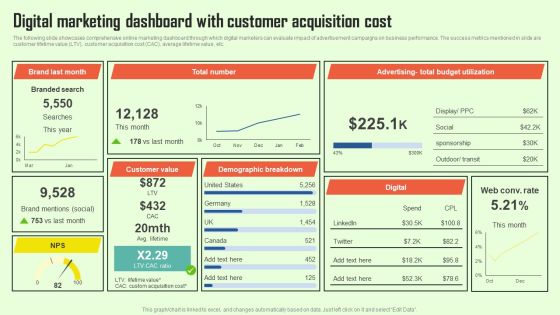
Increasing Consumer Engagement With Database Digital Marketing Dashboard With Customer Infographics PDF
The following slide showcases comprehensive online marketing dashboard through which digital marketers can evaluate impact of advertisement campaigns on business performance. The success metrics mentioned in slide are customer lifetime value LTV, customer acquisition cost CAC, average lifetime value, etc. Make sure to capture your audiences attention in your business displays with our gratis customizable Increasing Consumer Engagement With Database Digital Marketing Dashboard With Customer Infographics PDF. These are great for business strategies, office conferences, capital raising or task suggestions. If you desire to acquire more customers for your tech business and ensure they stay satisfied, create your own sales presentation with these plain slides.

E Commerce Operations In B2b B2b Ecommerce Dashboard To Track Website Infographics PDF
This slide represents metric dashboard to track and analyze b2b ecommerce website performance. It covers total user visits, sales, average return per user etc. Find a pre designed and impeccable E Commerce Operations In B2b B2b Ecommerce Dashboard To Track Website Infographics PDF. The templates can ace your presentation without additional effort. You can download these easy to edit presentation templates to make your presentation stand out from others. So, what are you waiting for Download the template from Slidegeeks today and give a unique touch to your presentation.
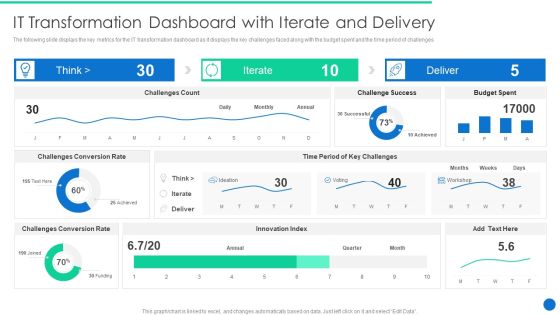
ERP Digital Transformation Journey It Transformation Dashboard With Iterate And Delivery Clipart PDF
The following slide displays the key metrics for the IT transformation dashboard as it displays the key challenges faced along with the budget spent and the time period of challenges. Deliver and pitch your topic in the best possible manner with this ERP Digital Transformation Journey It Transformation Dashboard With Iterate And Delivery Clipart PDF. Use them to share invaluable insights on Challenges Conversion, Budget Spent, Innovation Index and impress your audience. This template can be altered and modified as per your expectations. So, grab it now.
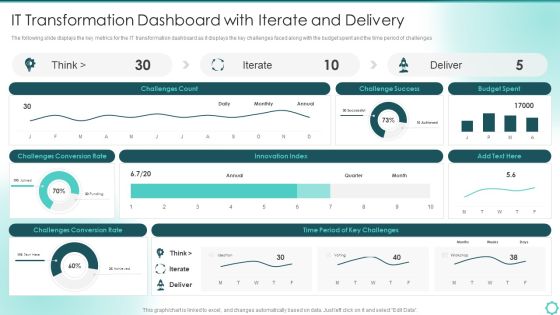
Digitalization Of Transportation Enterprise IT Transformation Dashboard With Iterate And Delivery Designs PDF
The following slide displays the key metrics for the IT transformation dashboard as it displays the key challenges faced along with the budget spent and the time period of challenges. Deliver and pitch your topic in the best possible manner with this Digitalization Of Transportation Enterprise IT Transformation Dashboard With Iterate And Delivery Designs PDF. Use them to share invaluable insights on Innovation Index, Budget Spent, Conversion Rate and impress your audience. This template can be altered and modified as per your expectations. So, grab it now.
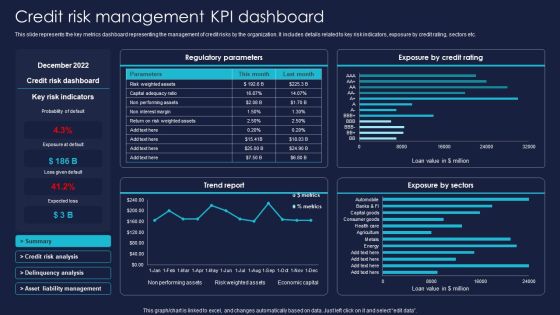
Enterprise Risk Management And Mitigation Program Credit Risk Management KPI Dashboard Introduction PDF
This slide represents the key metrics dashboard representing the management of credit risks by the organization. It includes details related to key risk indicators, exposure by credit rating, sectors etc. Want to ace your presentation in front of a live audience Our Enterprise Risk Management And Mitigation Program Credit Risk Management KPI Dashboard Introduction PDF can help you do that by engaging all the users towards you. Slidegeeks experts have put their efforts and expertise into creating these impeccable powerpoint presentations so that you can communicate your ideas clearly. Moreover, all the templates are customizable, and easy to edit and downloadable. Use these for both personal and commercial use.

Artificial Intelligence Transformation Playbook Kpi Dashboard For Tracking Business Performance Designs PDF
Mentioned slide portrays KPI dashboard that can be used by organizations to measure their business performance post AI introduction. KPIS covered here are progress, Before versus After AI Implementation, risks and issues. Deliver an awe inspiring pitch with this creative artificial intelligence transformation playbook kpi dashboard for tracking business performance designs pdf bundle. Topics like risk and issues, progress, performance kpis, before versus after all implementation can be discussed with this completely editable template. It is available for immediate download depending on the needs and requirements of the user.

AI Playbook For Business KPI Dashboard For Tracking Business Performance Demonstration PDF
Mentioned slide portrays KPI dashboard that can be used by organizations to measure their business performance post AI introduction. KPIS covered here are progress, before versus after AI implementation, risks and issues. Deliver and pitch your topic in the best possible manner with this AI Playbook For Business KPI Dashboard For Tracking Business Performance Demonstration PDF. Use them to share invaluable insights on Performance KPIs, Progress, Risk And Issues and impress your audience. This template can be altered and modified as per your expectations. So, grab it now.

Marketing Qualified Leads MQL Performance Measurement Dashboard Ppt Icon Examples PDF
This slide shows dashboard for tracking performance of generated marketing qualified leads. It shows details related to audience, prospects and also shows details related to financial KPIs. Persuade your audience using this Marketing Qualified Leads MQL Performance Measurement Dashboard Ppt Icon Examples PDF. This PPT design covers one stages, thus making it a great tool to use. It also caters to a variety of topics including Audience, Closing Percentage, Per Lead Category, Financial KPIs. Download this PPT design now to present a convincing pitch that not only emphasizes the topic but also showcases your presentation skills.

Creating New Product Launch Campaign Strategy Dashboard To Measure Sales Rep Performance Introduction PDF
This slide illustrates sales representative performance measurement dashboard with key metrics such as average first contact resolution rate, occupancy rate, NPS and top agents by solved tickets. Make sure to capture your audiences attention in your business displays with our gratis customizable Creating New Product Launch Campaign Strategy Dashboard To Measure Sales Rep Performance Introduction PDF. These are great for business strategies, office conferences, capital raising or task suggestions. If you desire to acquire more customers for your tech business and ensure they stay satisfied, create your own sales presentation with these plain slides.

Dashboard To Measure Performance Of E Commerce Marketing Strategies Structure PDF
This following slide displays the key metrics that can help an organization to measure effectiveness of e-commerce strategies. These can be revenue generated using e-commerce platform, conversion rates etc.Create an editable Dashboard To Measure Performance Of E Commerce Marketing Strategies Structure PDF that communicates your idea and engages your audience. Whether you are presenting a business or an educational presentation, pre-designed presentation templates help save time. Dashboard To Measure Performance Of E Commerce Marketing Strategies Structure PDF is highly customizable and very easy to edit, covering many different styles from creative to business presentations. Slidegeeks has creative team members who have crafted amazing templates. So, go and get them without any delay.
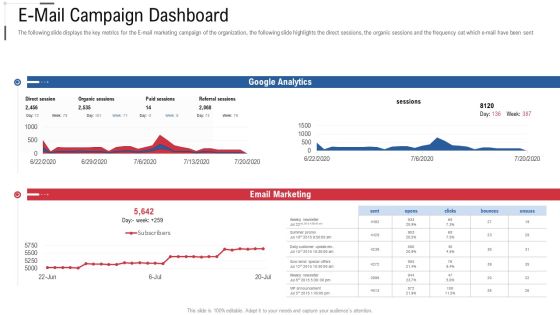
E Mail Campaign Dashboard Online Trade Marketing And Promotion Topics PDF
The following slide displays the key metrics for the E mail marketing campaign of the organization, the following slide highlights the direct sessions, the organic sessions and the frequency oat which e mail have been sent. Deliver an awe inspiring pitch with this creative e mail campaign dashboard online trade marketing and promotion topics pdf bundle. Topics like e mail campaign dashboard can be discussed with this completely editable template. It is available for immediate download depending on the needs and requirements of the user.

Ways To Accomplish ISO 27001 Accreditation Dashboard To Measure Total Risks Encountered Download PDF
Mentioned slide portrays dashboard for measuring total risk encountered by the firm in specific period and total risks resolved. Key metrics included in the slide are issues by status, issues by priority and resolved status. Deliver an awe inspiring pitch with this creative Ways To Accomplish ISO 27001 Accreditation Dashboard To Measure Total Risks Encountered Download PDF bundle. Topics like Pending Approval, Action Plan, Resolved Status can be discussed with this completely editable template. It is available for immediate download depending on the needs and requirements of the user.

Effective Sales Technique For New Product Launch Dashboard To Measure Sales Rep Performance Themes PDF
This slide illustrates sales representative performance measurement dashboard with key metrics such as average first contact resolution rate, occupancy rate, NPS and top agents by solved tickets.Deliver and pitch your topic in the best possible manner with this Effective Sales Technique For New Product Launch Dashboard To Measure Sales Rep Performance Themes PDF Use them to share invaluable insights on Contact Resolution, Feature Request, Promoters and impress your audience. This template can be altered and modified as per your expectations. So, grab it now.

Effective Sales Plan For New Product Introduction In Market Dashboard To Measure Sales Download PDF
This slide illustrates sales representative performance measurement dashboard with key metrics such as average first contact resolution rate, occupancy rate, NPS and top agents by solved tickets.Deliver and pitch your topic in the best possible manner with this Effective Sales Plan For New Product Introduction In Market Dashboard To Measure Sales Download PDF Use them to share invaluable insights on Sales Enquiry, Feature Request, Setup Request and impress your audience. This template can be altered and modified as per your expectations. So, grab it now.
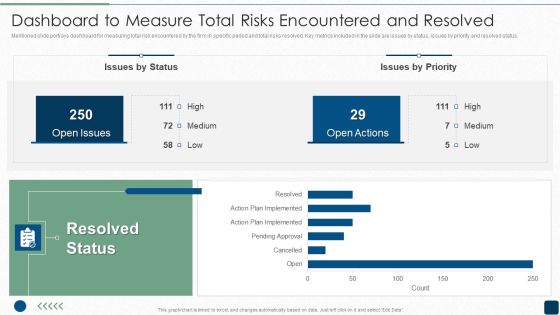
ISO 27001 Certification Procedure Dashboard To Measure Total Risks Encountered And Resolved Topics PDF
Mentioned slide portrays dashboard for measuring total risk encountered by the firm in specific period and total risks resolved. Key metrics included in the slide are issues by status, issues by priority and resolved status.Deliver and pitch your topic in the best possible manner with this ISO 27001 Certification Procedure Dashboard To Measure Total Risks Encountered And Resolved Topics PDF. Use them to share invaluable insights on Resolved Status, Open Issues, Open Actions and impress your audience. This template can be altered and modified as per your expectations. So, grab it now.

Performance KPI Dashboard To Analyze Healthcare Marketing Strategies Performance Elements PDF
The following slide showcases a comprehensive dashboard which can be used to evaluate the effectiveness of marketing strategies. The key metrics are total searches, brand mentions, customer value, total spending on advertisement etc. If your project calls for a presentation, then Slidegeeks is your go to partner because we have professionally designed, easy to edit templates that are perfect for any presentation. After downloading, you can easily edit Performance KPI Dashboard To Analyze Healthcare Marketing Strategies Performance Elements PDF and make the changes accordingly. You can rearrange slides or fill them with different images. Check out all the handy templates.
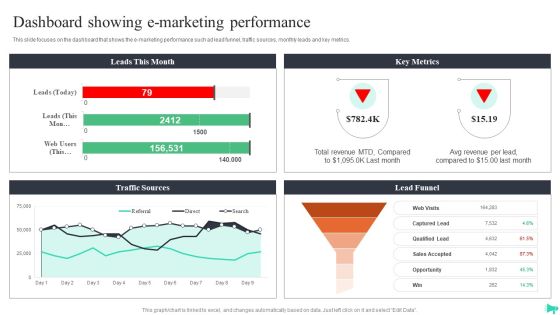
Implementing Ecommerce Marketing Services Plan Dashboard Showing E Marketing Performance Summary PDF
This slide focuses on the dashboard that shows the e marketing performance such ad lead funnel, traffic sources, monthly leads and key metrics. Take your projects to the next level with our ultimate collection of Implementing Ecommerce Marketing Services Plan Dashboard Showing E Marketing Performance Summary PDF. Slidegeeks has designed a range of layouts that are perfect for representing task or activity duration, keeping track of all your deadlines at a glance. Tailor these designs to your exact needs and give them a truly corporate look with your own brand colors they will make your projects stand out from the rest.
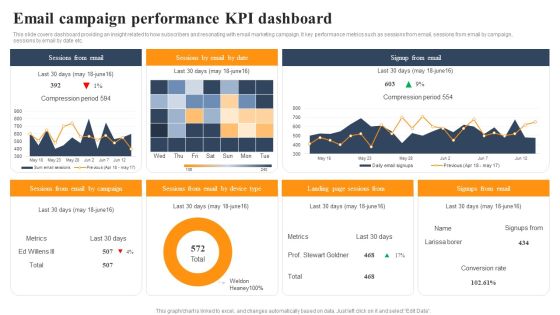
Implementing An Effective Ecommerce Management Framework Email Campaign Performance KPI Dashboard Introduction PDF
This slide covers dashboard providing an insight related to how subscribers and resonating with email marketing campaign. It key performance metrics such as sessions from email, sessions from email by campaign, sessions by email by date etc. If your project calls for a presentation, then Slidegeeks is your go-to partner because we have professionally designed, easy-to-edit templates that are perfect for any presentation. After downloading, you can easily edit Implementing An Effective Ecommerce Management Framework Email Campaign Performance KPI Dashboard Introduction PDF and make the changes accordingly. You can rearrange slides or fill them with different images. Check out all the handy templates

Deployment Procedure Of Hyper Automation RPA Dashboard With Automated Process And Productivity Brochure PDF
The following dashboard highlights key metrics of robotic process automation such as success rate, robot utilization and robot productivity. From laying roadmaps to briefing everything in detail, our templates are perfect for you. You can set the stage with your presentation slides. All you have to do is download these easy to edit and customizable templates. Deployment Procedure Of Hyper Automation RPA Dashboard With Automated Process And Productivity Brochure PDF will help you deliver an outstanding performance that everyone would remember and praise you for. Do download this presentation today.

Social Media Promotional Technique Dashboard To Track Social Media Marketing Inspiration PDF
This slide showcases dashboard that can help organization to track the metrics of social media marketing campaign. Its key components are followers, post reach, page impressions, visitors, avg engagement and lifetime views. Want to ace your presentation in front of a live audience Our Social Media Promotional Technique Dashboard To Track Social Media Marketing Inspiration PDF can help you do that by engaging all the users towards you.. Slidegeeks experts have put their efforts and expertise into creating these impeccable powerpoint presentations so that you can communicate your ideas clearly. Moreover, all the templates are customizable, and easy-to-edit and downloadable. Use these for both personal and commercial use.

Sales Optimization Best Practices To Close More Deals Sales KPI Dashboard Accumulated Topics PDF
The sales dashboard is an effective tool that helps in monitoring various sales KPIs in order to aid sales teams in reaching sales goals by analyzing the sales performance. Deliver and pitch your topic in the best possible manner with this sales optimization best practices to close more deals sales kpi dashboard accumulated topics pdf. Use them to share invaluable insights on incremental sales, sales revenue, cost breakdown, accumulated revenue and impress your audience. This template can be altered and modified as per your expectations. So, grab it now.
Sales Department Strategies Increase Revenues Sales KPI Dashboard Ppt Icon Visual Aids PDF
The sales dashboard is an effective tool that helps in monitoring various sales KPIs in order to aid sales teams in reaching sales goals by analyzing the sales performance. Deliver and pitch your topic in the best possible manner with this sales department strategies increase revenues sales kpi dashboard ppt icon visual aids pdf. Use them to share invaluable insights on average revenue, customer lifetime value, customer acquisition cost and impress your audience. This template can be altered and modified as per your expectations. So, grab it now.
Forecasting And Managing Consumer Attrition For Business Advantage Dashboard Customer Purchase Tracking Repeat Structure PDF
The firm is looking forward to track customer experience by tracking various touchpoints in order to handle issues such customer churn. KPIs mentioned in the dashboard are measured regularly across the organization. Deliver and pitch your topic in the best possible manner with this forecasting and managing consumer attrition for business advantage dashboard customer purchase tracking repeat structure pdf. Use them to share invaluable insights on total repeat sales after coupon, total repeat sales after reward, total cart value per month and impress your audience. This template can be altered and modified as per your expectations. So, grab it now.

Sales Assistance Boost Overall Efficiency Sales KPI Dashboard New Topics PDF
The sales dashboard is an effective tool that helps in monitoring various sales KPIs in order to aid sales teams in reaching sales goals by analyzing the sales performance. Deliver and pitch your topic in the best possible manner with this sales assistance boost overall efficiency sales kpi dashboard new topics pdf. Use them to share invaluable insights on customer acquisition cost, customer lifetime value, average revenue and impress your audience. This template can be altered and modified as per your expectations. So, grab it now.

Customer Attrition In A Bpo Dashboard Rate Ppt Slides Designs Download PDF
This slide shows a Customer Attrition Rate Dashboard with KPIs such as Company Revenue , Customer Attrition Rate in 2021 , Annual Growth Rate , Average Customer Queue Time , Onboarding Process Effectiveness etc. Deliver an awe-inspiring pitch with this creative customer attrition in a bpo dashboard rate ppt slides designs download pdf. bundle. Topics like company revenue, customer attrition rate, annual growth rate, customer satisfaction, rate, operational efficiency can be discussed with this completely editable template. It is available for immediate download depending on the needs and requirements of the user.

Customer Attrition Rate Dashboard For IBN Outsourcing Company Ppt Ideas Samples PDF
This slide shows a Customer Attrition Rate Dashboard with KPIs such as Company Revenue , Customer Attrition Rate in 2021 , Annual Growth Rate , Average Customer Queue Time , Onboarding Process Effectiveness etc. Deliver and pitch your topic in the best possible manner with this customer attrition rate dashboard for IBN outsourcing company ppt ideas samples pdf. Use them to share invaluable insights on revenue, operational efficiency, product service, onboarding process effectiveness, annual growth and impress your audience. This template can be altered and modified as per your expectations. So, grab it now.
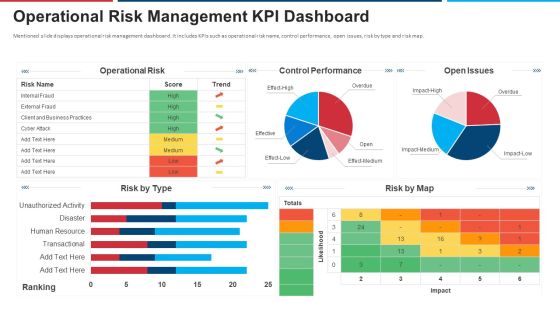
Mitigation Strategies For Operational Threat Operational Risk Management KPI Dashboard Ppt Slides Guide PDF
Mentioned slide displays operational risk management dashboard. It includes KPIs such as operational risk name, control performance, open issues, risk by type and risk map. Deliver an awe inspiring pitch with this creative mitigation strategies for operational threat operational risk management kpi dashboard ppt slides guide pdf bundle. Topics like operational risk, control performance, open issues, risk by map risk by type can be discussed with this completely editable template. It is available for immediate download depending on the needs and requirements of the user.
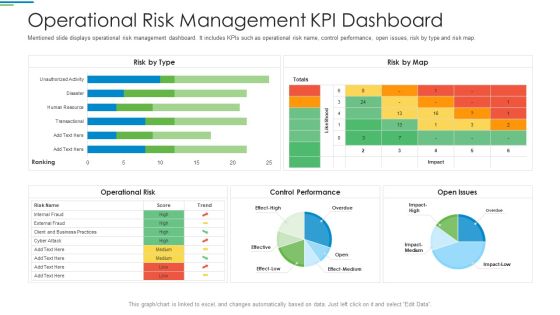
Operational Risk Management Structure In Financial Companies Operational Risk Management Kpi Dashboard Download PDF
Mentioned slide displays operational risk management dashboard. It includes KPIs such as operational risk name, control performance, open issues, risk by type and risk map. Deliver and pitch your topic in the best possible manner with this operational risk management structure in financial companies operational risk management kpi dashboard download pdf. Use them to share invaluable insights on operational risk name, control performance, open issues, risk by type and risk map and impress your audience. This template can be altered and modified as per your expectations. So, grab it now.

AI And ML Driving Monetary Value For Organization Customer Service Management Kpi Dashboard Formats PDF
Following slide illustrates customer service dashboard. It includes KPIs such as request answered, customer satisfaction, average time to solve an issue, costs per support and customer retention. Deliver and pitch your topic in the best possible manner with this ai and ml driving monetary value for organization customer service management kpi dashboard formats pdf. Use them to share invaluable insights on customer retention, cost per support, customer satisfaction, cost to revenue and impress your audience. This template can be altered and modified as per your expectations. So, grab it now.

AI And ML Driving Monetary Value For Organization KPI Dashboard To Monitor Business Performance Graphics PDF
Following slide shows business performance dashboard. It covers KPIs such as revenue generated, projected revenue, marketing expenses, satisfaction rate and tickets volume by priority. Deliver and pitch your topic in the best possible manner with this ai and ml driving monetary value for organization kpi dashboard to monitor business performance graphics pdf. Use them to share invaluable insights on business offerings, current impact, product innovations, customer service and impress your audience. This template can be altered and modified as per your expectations. So, grab it now.

Investing In Tech Innovation Performance Measurement Kpi Dashboard For Fintech Firm Mockup PDF
Following slide portrays performance measurement dashboard for FinTech companies with KPIs namely available cash, cash flow, ROA, working capital ratio, days sales outstanding and days payable outstanding. Deliver and pitch your topic in the best possible manner with this Investing In Tech Innovation Performance Measurement Kpi Dashboard For Fintech Firm Mockup PDF. Use them to share invaluable insights on Available Cash, Cash Flow, Return on Assets, Working Capital Ratio and impress your audience. This template can be altered and modified as per your expectations. So, grab it now.

Automating Supply Chain Dashboard For Tracking Impact Of Procurement Process Automation Themes PDF
This slide covers the dashboard for analysing procurement performance after automation. It include KPIs such as on-time delivery, percentage of returns, compliance index percentage, procurement ROI, cost-saving, budget spent on training, etc. Deliver an awe inspiring pitch with this creative Automating Supply Chain Dashboard For Tracking Impact Of Procurement Process Automation Themes PDF bundle. Topics like Procurement ROI, Cost Saving, Perform Procurement can be discussed with this completely editable template. It is available for immediate download depending on the needs and requirements of the user.

Automating Supply Chain Dashboard For Tracking Impact Of Supply Chain Automation Pictures PDF
This slide covers the dashboard for back-end tracking of overall impact automation. It include KPIs such as retailer capacity, warehouse capacity, truck efficiency, time to reach warehouse, sustainability, etc. Deliver and pitch your topic in the best possible manner with this Automating Supply Chain Dashboard For Tracking Impact Of Supply Chain Automation Pictures PDF. Use them to share invaluable insights on Supply Chain Manager, Warehouse Manager, Truck Driver and impress your audience. This template can be altered and modified as per your expectations. So, grab it now.

Automating Supply Chain Dashboard For Tracking Impact Of Transport Automation Themes PDF
This slide covers the dashboard for tracking vehicle efficiency after transport automation. It include KPIs such as truck turnaround time, average revenue per hour, truckload capacity, transit time, on-time pickup, and average revenue per mile. Deliver an awe inspiring pitch with this creative Automating Supply Chain Dashboard For Tracking Impact Of Transport Automation Themes PDF bundle. Topics like Average Revenue, Per Mile, Truck Turnaround can be discussed with this completely editable template. It is available for immediate download depending on the needs and requirements of the user.

Automating Supply Chain Dashboard For Tracking Impact Of Warehouse House Automation Graphics PDF
This slide covers the dashboard with after automation warehouse overview. It include KPIs such as autonomous robots status, robotic arms status, battery level, performance, time to return, etc. Deliver and pitch your topic in the best possible manner with this Automating Supply Chain Dashboard For Tracking Impact Of Warehouse House Automation Graphics PDF. Use them to share invaluable insights on Autonomous Robot, Robotic Arms, Systems Engineer and impress your audience. This template can be altered and modified as per your expectations. So, grab it now.

KPI Metrics Dashboard To Measure Automation Performance In Customer Support Professional PDF
The following slide outlines a comprehensive KPI dashboard which can be used by the organization to measure the automation performance in customer support department. It covers kpis such as customer retention, costs per support, customer satisfaction, etc. Deliver and pitch your topic in the best possible manner with this KPI Metrics Dashboard To Measure Automation Performance In Customer Support Professional PDF. Use them to share invaluable insights on Customer Retention, Cost Per Support, Support Costs To Revenue and impress your audience. This template can be altered and modified as per your expectations. So, grab it now.

Virtual Assets Investment Guide Dashboard To Effectively Track Bitcoin Performance Rules PDF
The following dashboard highlights key parameters that can be used by the organization to track the performance of their Bitcoin investment, it enlists major KPIs such as price of Bitcoin, transaction chart and its historical performance. Deliver an awe inspiring pitch with this creative Virtual Assets Investment Guide Dashboard To Effectively Track Bitcoin Performance Rules PDF bundle. Topics like Bitcoin Chart, Transaction Chart, Prediction Meter can be discussed with this completely editable template. It is available for immediate download depending on the needs and requirements of the user.
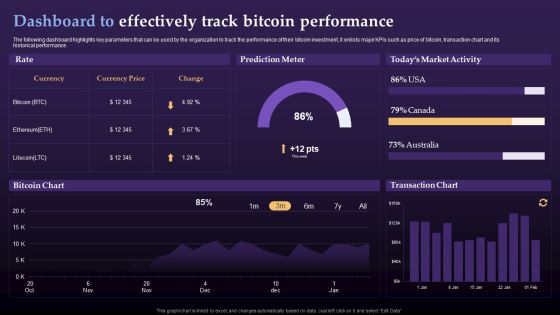
Virtual Currency Investment Guide For Companies Dashboard To Effectively Track Bitcoin Diagrams PDF
The following dashboard highlights key parameters that can be used by the organization to track the performance of their bitcoin investment, it enlists major KPIs such as price of bitcoin, transaction chart and its historical performance. Deliver an awe inspiring pitch with this creative Virtual Currency Investment Guide For Companies Dashboard To Effectively Track Bitcoin Diagrams PDF bundle. Topics like Prediction Meter, Todays Market Activity, Transaction Chart can be discussed with this completely editable template. It is available for immediate download depending on the needs and requirements of the user.

KPI Metrics Dashboard To Measure Automation Performance Achieving Operational Efficiency Guidelines PDF
The following slide outlines a comprehensive KPI dashboard which can be used by the organization to measure the automation performance in customer support department. It covers kpis such as customer retention, costs per support, customer satisfaction, etcDeliver and pitch your topic in the best possible manner with this KPI Metrics Dashboard To Measure Automation Performance Achieving Operational Efficiency Guidelines PDF. Use them to share invaluable insights on Customer Retention, Cost Per Support, Request Volume and impress your audience. This template can be altered and modified as per your expectations. So, grab it now.

Method To Introduce New Product Offerings In The Industry Product Portfolio Monitoring Dashboard Template PDF
Mentioned slide shows a dashboard that can be used by a product manager to monitor different product portfolios developed and offered by the organization. KPIs included are portfolio budget, issues across portfolios and portfolio risks by impact. Deliver and pitch your topic in the best possible manner with this Method To Introduce New Product Offerings In The Industry Product Portfolio Monitoring Dashboard Template PDF. Use them to share invaluable insights on Portfolio Risks, Portfolio Budget and impress your audience. This template can be altered and modified as per your expectations. So, grab it now.
Strategies To Attract Customers And Lead Generation Dashboard For Tracking Facebook Retargeting Campaign Graphics PDF
This slide covers metrics for analysing the results of Facebook retargeting campaign. It includes KPIs such as ad spend, cost per click, click through rate, ad reach, post engagement, ad clicks, ad impressions, link clicks, etc. Deliver and pitch your topic in the best possible manner with this Strategies To Attract Customers And Lead Generation Dashboard For Tracking Facebook Retargeting Campaign Graphics PDF. Use them to share invaluable insights on Cost Per Click, Dashboard, Tracking Facebook Retargeting Campaign and impress your audience. This template can be altered and modified as per your expectations. So, grab it now.

Strategies To Attract Customers And Lead Generation Dashboard For Tracking Instagram Retargeting Campaign Elements PDF
This slide covers metrics for analyzing the results of the Instagram retargeting campaign. It includes KPIs such as amount spend, total reach, total impressions, website clicks, page likes, ad clicks, post reactions, etc. Deliver an awe inspiring pitch with this creative Strategies To Attract Customers And Lead Generation Dashboard For Tracking Instagram Retargeting Campaign Elements PDF bundle. Topics like Dashboard, Tracking Instagram Retargeting Campaign can be discussed with this completely editable template. It is available for immediate download depending on the needs and requirements of the user.
Strategies To Attract Customers And Lead Generation Dashboard For Tracking Twitter Retargeting Campaign Tracking Ideas PDF
This slide covers metrics for analysing the results of Twitter retargeting campaigns. It includes KPIs such as click through rate, impressions, conversion rate, cost, cost per click, etc. Deliver an awe inspiring pitch with this creative Strategies To Attract Customers And Lead Generation Dashboard For Tracking Twitter Retargeting Campaign Tracking Ideas PDF bundle. Topics like Dashboard, Tracking Twitter Retargeting, Campaign Tracking can be discussed with this completely editable template. It is available for immediate download depending on the needs and requirements of the user.

Brand Value Measuring KPI Dashboard Guide To Understand Evaluate And Enhance Brand Value Slides PDF
Following slide illustrates KPI dashboard to measure brand value. KPIs covered are brand value and percentage change, brand value over time, most followed brands on social media.Take your projects to the next level with our ultimate collection of Brand Value Measuring KPI Dashboard Guide To Understand Evaluate And Enhance Brand Value Slides PDF. Slidegeeks has designed a range of layouts that are perfect for representing task or activity duration, keeping track of all your deadlines at a glance. Tailor these designs to your exact needs and give them a truly corporate look with your own brand colors they all make your projects stand out from the rest

Performance Kpi Dashboard To Analyze Instagram Marketing Strategy Performance Introduction PDF
The following slide outlines KPI metrics dashboard of instagram video marketing. The kpis covered in the slide are followers, engagement, likes, comments, impressions, reach, video views and saves. The best PPT templates are a great way to save time, energy, and resources. Slidegeeks have 100 percent editable powerpoint slides making them incredibly versatile. With these quality presentation templates, you can create a captivating and memorable presentation by combining visually appealing slides and effectively communicating your message. Download Performance Kpi Dashboard To Analyze Instagram Marketing Strategy Performance Introduction PDF from Slidegeeks and deliver a wonderful presentation.
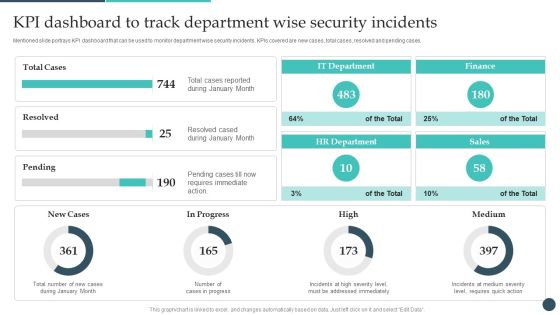
Safety Breach Response Playbook KPI Dashboard To Track Department Wise Rules PDF
Mentioned slide portrays KPI dashboard that can be used to monitor department wise security incidents. KPIs covered are new cases, total cases, resolved and pending cases. Present like a pro with Safety Breach Response Playbook KPI Dashboard To Track Department Wise Rules PDF Create beautiful presentations together with your team, using our easy-to-use presentation slides. Share your ideas in real-time and make changes on the fly by downloading our templates. So whether youre in the office, on the go, or in a remote location, you can stay in sync with your team and present your ideas with confidence. With Slidegeeks presentation got a whole lot easier. Grab these presentations today.

Financial Kpi Dashboard To Evaluate Fundraising Impact Developing Fundraising Techniques Diagrams PDF
This slide showcases dashboard that can help organization to evaluate key changes in financial KPIs post fundraising. Its key components are net profit margin, revenue, gross profit margin, debt to equity and return on equity. From laying roadmaps to briefing everything in detail, our templates are perfect for you. You can set the stage with your presentation slides. All you have to do is download these easy-to-edit and customizable templates. Financial Kpi Dashboard To Evaluate Fundraising Impact Developing Fundraising Techniques Diagrams PDF will help you deliver an outstanding performance that everyone would remember and praise you for. Do download this presentation today.

Optimizing Marketing Analytics To Enhance Organizational Growth Social Media Analytics KPI Dashboard Graphics PDF
This slide covers a dashboard for tracking social media KPIs such as face engagements, total likes, followers, audience growth, YouTube subscribers, views, Instagram reach and , likes, LinkedIn impressions, etc. From laying roadmaps to briefing everything in detail, our templates are perfect for you. You can set the stage with your presentation slides. All you have to do is download these easy to edit and customizable templates. Optimizing Marketing Analytics To Enhance Organizational Growth Social Media Analytics KPI Dashboard Graphics PDF will help you deliver an outstanding performance that everyone would remember and praise you for. Do download this presentation today.
Streamlining Operations With Supply Chain Automation Dashboard For Tracking Impact Of Supply Chain Automation Slides PDF
This slide covers the dashboard for back end tracking of overall impact automation. It include KPIs such as retailer capacity, warehouse capacity, truck efficiency, time to reach warehouse, sustainability, etc. There are so many reasons you need a Streamlining Operations With Supply Chain Automation Dashboard For Tracking Impact Of Supply Chain Automation Slides PDF. The first reason is you can not spend time making everything from scratch, Thus, Slidegeeks has made presentation templates for you too. You can easily download these templates from our website easily.

Creating And Introducing A Web Based Application Performance Dashboard Guidelines PDF
This slide covers application performance in market KPIs and metrics such as impressions, clicks, searches for app, conversion rate etc, Get a simple yet stunning designed Creating And Introducing A Web Based Application Performance Dashboard Guidelines PDF. It is the best one to establish the tone in your meetings. It is an excellent way to make your presentations highly effective. So, download this PPT today from Slidegeeks and see the positive impacts. Our easy-to-edit Creating And Introducing A Web Based Application Performance Dashboard Guidelines PDF can be your go-to option for all upcoming conferences and meetings. So, what are you waiting for Grab this template today.
Marketing Success Metrics Website Landing Page Kpi Tracking Dashboard Elements PDF
This slide covers a dashboard for analysing the metrics of the website landing page. It includes kpis such as conversions, conversion rate, sessions, bounce rate, engagement sickness, etc. From laying roadmaps to briefing everything in detail, our templates are perfect for you. You can set the stage with your presentation slides. All you have to do is download these easy-to-edit and customizable templates. Marketing Success Metrics Website Landing Page Kpi Tracking Dashboard Elements PDF will help you deliver an outstanding performance that everyone would remember and praise you for. Do download this presentation today.
Planning Transnational Technique To Improve International Scope Dashboard Tracking Post Expansion Revenue Structure PDF
This slide covers the dashboard for analyzing fast food business sales by location. It includes KPIs such as the companys revenue by location, by type, top 5 expenses by account, top 5 expenses by department, cost of revenue year to date, etc. If your project calls for a presentation, then Slidegeeks is your go to partner because we have professionally designed, easy to edit templates that are perfect for any presentation. After downloading, you can easily edit Planning Transnational Technique To Improve International Scope Dashboard Tracking Post Expansion Revenue Structure PDF and make the changes accordingly. You can rearrange slides or fill them with different images. Check out all the handy templates
Online Marketing Analytics To Enhance Business Growth Website Landing Page KPI Tracking Dashboard Sample PDF
This slide covers a dashboard for analyzing the metrics of the website landing page. It includes KPIs such as conversions, conversion rate, sessions, bounce rate, engagement sickness, etc. If your project calls for a presentation, then Slidegeeks is your go to partner because we have professionally designed, easy to edit templates that are perfect for any presentation. After downloading, you can easily edit Online Marketing Analytics To Enhance Business Growth Website Landing Page KPI Tracking Dashboard Sample PDF and make the changes accordingly. You can rearrange slides or fill them with different images. Check out all the handy templates
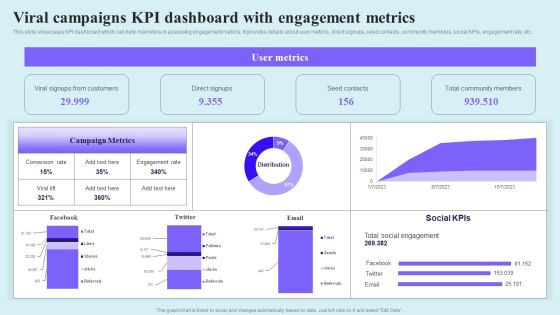
Go Viral Campaign Strategies To Increase Engagement Viral Campaigns KPI Dashboard With Engagement Demonstration PDF
This slide showcases KPI dashboard which can help marketers in assessing engagement metrics. It provides details about user metrics, direct signups, seed contacts, community members, social KPIs, engagement rate, etc. Take your projects to the next level with our ultimate collection of Go Viral Campaign Strategies To Increase Engagement Viral Campaigns KPI Dashboard With Engagement Demonstration PDF. Slidegeeks has designed a range of layouts that are perfect for representing task or activity duration, keeping track of all your deadlines at a glance. Tailor these designs to your exact needs and give them a truly corporate look with your own brand colors they will make your projects stand out from the rest.

Strategic Marketing For Hair And Beauty Salon To Increase Dashboard Monitoring Sales Slides PDF
This slide presents a dashboard tracking revenue and sales by products and services. It includes KPIs such as revenue by service and products, units sold, monthly revenue. Make sure to capture your audiences attention in your business displays with our gratis customizable Strategic Marketing For Hair And Beauty Salon To Increase Dashboard Monitoring Sales Slides PDF. These are great for business strategies, office conferences, capital raising or task suggestions. If you desire to acquire more customers for your tech business and ensure they stay satisfied, create your own sales presentation with these plain slides.
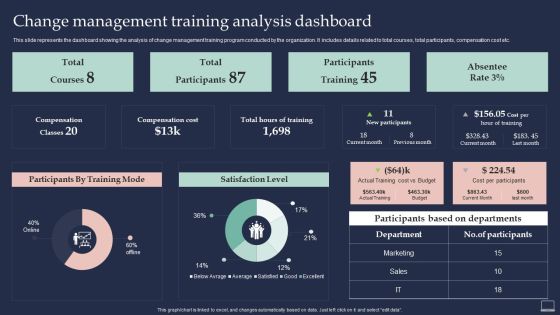
Training Program For Implementing Change Management Training Analysis Dashboard Information PDF
This slide represents the dashboard showing the analysis of change management training program conducted by the organization. It includes details related to total courses, total participants, compensation cost etc. Coming up with a presentation necessitates that the majority of the effort goes into the content and the message you intend to convey. The visuals of a PowerPoint presentation can only be effective if it supplements and supports the story that is being told. Keeping this in mind our experts created Training Program For Implementing Change Management Training Analysis Dashboard Information PDF to reduce the time that goes into designing the presentation. This way, you can concentrate on the message while our designers take care of providing you with the right template for the situation.
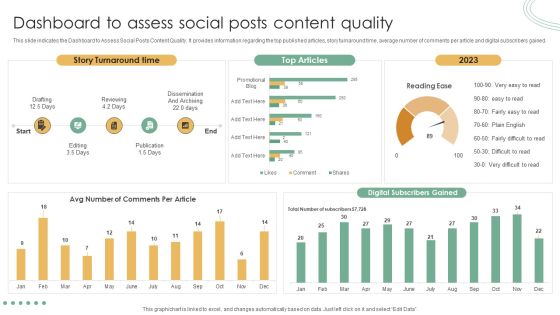
Online Marketing Techniques Assessment Approach Dashboard To Assess Social Posts Content Quality Information PDF
Take your projects to the next level with our ultimate collection of Online Marketing Techniques Assessment Approach Dashboard To Assess Social Posts Content Quality Information PDF. Slidegeeks has designed a range of layouts that are perfect for representing task or activity duration, keeping track of all your deadlines at a glance. Tailor these designs to your exact needs and give them a truly corporate look with your own brand colors they will make your projects stand out from the rest.

Economic Facts And Insights Analysis Dashboard Ppt PowerPoint Presentation Inspiration Slide Download PDF
Showcasing this set of slides titled economic facts and insights analysis dashboard ppt powerpoint presentation inspiration slide download pdf. The topics addressed in these templates are current working capital, cash conversion cycle in days last, current quick stats, vendor payment error rate last, 12 months currnet budget variance. All the content presented in this PPT design is completely editable. Download it and make adjustments in color, background, font etc. as per your unique business setting.
Operations Of Commercial Bank Dashboard Tracking Customer Activities And Revenue Generated Inspiration PDF
This slide contains dashboard that will allow bank to track the customer activities in terms of new customer acquired, customer acquisition cost and overall revenue generated. Deliver and pitch your topic in the best possible manner with this operations of commercial bank dashboard tracking customer activities and revenue generated inspiration pdf. Use them to share invaluable insights on avg revenue per customer, customers acquisition cost, compared to previous year and impress your audience. This template can be altered and modified as per your expectations. So, grab it now.
Operations Of Commercial Bank Dashboard Tracking Customer Retention Rate Time Summary PDF
This slide contains dashboard that will allow bank to track the retention rate of customer within span of 6 months. Number of accounts that are successfully retained by the bank. It will also bank in tracking accounts that are cancelled. Deliver an awe-inspiring pitch with this creative operations of commercial bank dashboard tracking customer retention rate time summary pdf bundle. Topics like contraction, expansion, partner can be discussed with this completely editable template. It is available for immediate download depending on the needs and requirements of the user.
Operations Of Commercial Bank Dashboard Tracking Customer Retention Rate Icons PDF
This slide contains dashboard that will allow bank to track the retention rate of customer within span of 6 months. Number of accounts that are successfully retained by the bank. It will also bank in tracking accounts that are cancelled. Deliver and pitch your topic in the best possible manner with this operations of commercial bank dashboard tracking customer retention rate icons pdf. Use them to share invaluable insights on road runners, contraction, expansion and impress your audience. This template can be altered and modified as per your expectations. So, grab it now.
Operations Of Commercial Bank Dashboard Tracking Online Banking Activities Topics PDF
This slide contains dashboard that will allow bank to track the online customer activities in terms of new customer connected with bank on online platform, fraud prevention. It will also help the bank in tracking the numbers of employees that are connected to bank through mobile access. Deliver and pitch your topic in the best possible manner with this operations of commercial bank dashboard tracking online banking activities topics pdf. Use them to share invaluable insights on express invoicing, account management, fraud prevention, payroll service and impress your audience. This template can be altered and modified as per your expectations. So, grab it now.
Executing Online Solution In Banking Dashboard Tracking Customer Retention Rate Seats Sample PDF
This slide contains dashboard that will allow bank to track the retention rate of customer within span of 6 months. Number of accounts that are successfully retained by the bank. It will also bank in tracking accounts that are cancelled. Deliver an awe inspiring pitch with this creative executing online solution in banking dashboard tracking customer retention rate seats sample pdf bundle. Topics like road runners, sleeping beautiful, aladdin rugs can be discussed with this completely editable template. It is available for immediate download depending on the needs and requirements of the user.
Executing Online Solution In Banking Dashboard Tracking Customer Retention Rate Time Topics PDF
This slide contains dashboard that will allow bank to track the retention rate of customer within span of 6 months. Number of accounts that are successfully retained by the bank. It will also bank in tracking accounts that are cancelled. Deliver and pitch your topic in the best possible manner with this executing online solution in banking dashboard tracking customer retention rate time topics pdf. Use them to share invaluable insights on account retention, retention components over time, expansion, contraction and impress your audience. This template can be altered and modified as per your expectations. So, grab it now.
Executing Online Solution In Banking Dashboard Tracking Online Banking Activities Structure PDF
This slide contains dashboard that will allow bank to track the online customer activities in terms of new customer connected with bank on online platform, fraud prevention. It will also help the bank in tracking the numbers of employees that are connected to bank through mobile access. Deliver and pitch your topic in the best possible manner with this executing online solution in banking dashboard tracking online banking activities structure pdf. Use them to share invaluable insights on payroll service, express invoicing, account management, fraud prevention and impress your audience. This template can be altered and modified as per your expectations. So, grab it now.

Stakeholders Participation Project Development Process Stakeholders Engagement Project Management Dashboard Mockup PDF
This slide covers the project dashboard for engaging stakeholders including task name, milestones and key deliverables, concerns risk and issues, actions and change requests. Deliver and pitch your topic in the best possible manner with this stakeholders participation project development process stakeholders engagement project management dashboard mockup pdf. Use them to share invaluable insights on business requirements have not been signed off, service for the project have not been commissioned, development complete, planning for change, key stakeholder and impress your audience. This template can be altered and modified as per your expectations. So, grab it now.

Customer Acquiring Price For Retaining New Clients Client Acquisition Cost Measurement Dashboard Ideas PDF
This slide shows a Client Acquisition Cost CAC Measurement Dashboard with details such as total customers, employee satisfaction rate, number of trials, monthly active users, NPS net promoter score etc. Deliver an awe inspiring pitch with this creative customer acquiring price for retaining new clients client acquisition cost measurement dashboard ideas pdf bundle. Topics like nps score, sales expenses, revenue ytd, total customers can be discussed with this completely editable template. It is available for immediate download depending on the needs and requirements of the user.
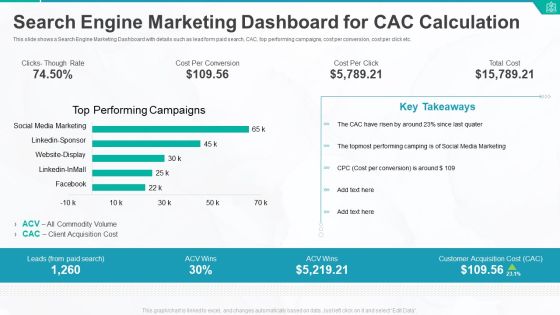
Search Engine Marketing Dashboard For CAC Calculation Ppt Styles Portrait PDF
This slide shows a Search Engine Marketing Dashboard with details such as lead form paid search, CAC, top performing campaigns, cost per conversion, cost per click etc. Deliver and pitch your topic in the best possible manner with this search engine marketing dashboard for cac calculation ppt styles portrait pdf. Use them to share invaluable insights on cost per conversion, cost per click, key takeaways, performing campaigns, client acquisition cost and impress your audience. This template can be altered and modified as per your expectations. So, grab it now.

Logistics Dashboard For XYZ Logistic Company Sales Ppt Inspiration Designs Download PDF
The slide shows the logistic measurement dashboard for measuring inventory turnover ratio, inventory carrying cost, inventory accuracy, percentage of out of stock items etc. Deliver an awe inspiring pitch with this creative logistics dashboard for xyz logistic company sales ppt inspiration designs download pdf bundle. Topics like carrying cost of inventory, inventory accuracy, out of stocks item, inventory to sales, inventory turnover can be discussed with this completely editable template. It is available for immediate download depending on the needs and requirements of the user.

Refurbishing The Product Advertising Plan Shopping Cart Conversion Rate Dashboard Ppt Styles Graphics Tutorials PDF
This slide shows shopping cart conversion rate dashboard. It includes details of online revenue share, shipping error rate, shopping cart conversion rate, coupon conversion, product views per session and revenue per visitors. Deliver an awe-inspiring pitch with this creative refurbishing the product advertising plan shopping cart conversion rate dashboard ppt styles graphics tutorials pdf. bundle. Topics like shopping cart conversion rate, coupon cart conversion, product views per session can be discussed with this completely editable template. It is available for immediate download depending on the needs and requirements of the user.
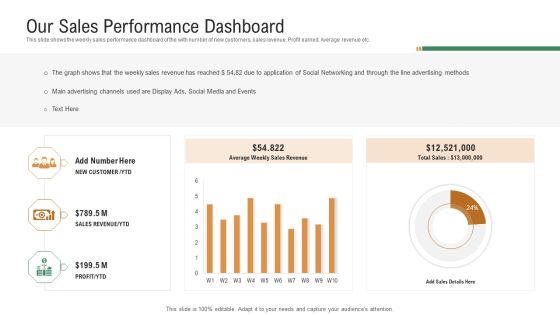
Investor Pitch Deck To Generate Venture Capital Funds Our Sales Performance Dashboard Ppt Show Format PDF
This slide shows the weekly sales performance dashboard of the with number of new customers, sales revenue, Profit earned, Average revenue etc. Deliver and pitch your topic in the best possible manner with this investor pitch deck to generate venture capital funds our sales performance dashboard ppt show format pdf. Use them to share invaluable insights on sales revenue, profit, main advertising channels, social networking, advertising methods and impress your audience. This template can be altered and modified as per your expectations. So, grab it now.

Dashboard Showing Various Techniques For Business Card Marketing Ppt Icon Visual Aids PDF
This slide showcases the dashboard of business card marketing with three different campaigns. The campaign used in this template are business card marketing campaign, online marketing campaign and CTR by campaign. Deliver and pitch your topic in the best possible manner with this dashboard showing various techniques for business card marketing ppt icon visual aids pdf. Use them to share invaluable insights on cost per acquisitions, online marketing campaign, business marketing campaign and impress your audience. This template can be altered and modified as per your expectations. So, grab it now.
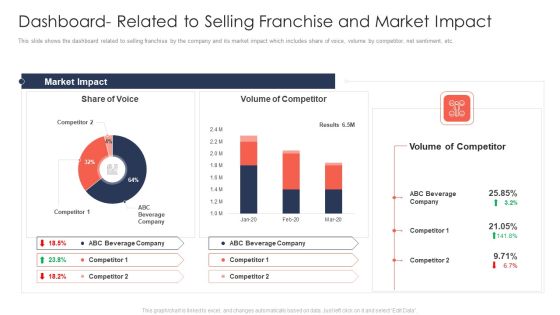
Trading Current Franchise Business Dashboard Related To Selling Franchise And Market Impact Rules PDF
This slide shows the dashboard related to selling franchise by the company and its market impact which includes share of voice, volume by competitor, net sentiment, etc. Deliver and pitch your topic in the best possible manner with this trading current franchise business dashboard related to selling franchise and market impact rules pdf. Use them to share invaluable insights on market impact, competitor, share of voice and impress your audience. This template can be altered and modified as per your expectations. So, grab it now.

Dashboard For Threat Tracking In IT Security IT Ppt Outline Examples PDF
This slide depicts the dashboard for threat tracking in cyber security by covering monthly threat status, current risk status, threat-based on the role, threats by owners, risk by threats, and threat report. Deliver an awe inspiring pitch with this creative dashboard for threat tracking in it security it ppt outline examples pdf bundle. Topics like monthly threat status, threats by owners, risk by threats, current risk status, threats based on role, threat report can be discussed with this completely editable template. It is available for immediate download depending on the needs and requirements of the user.
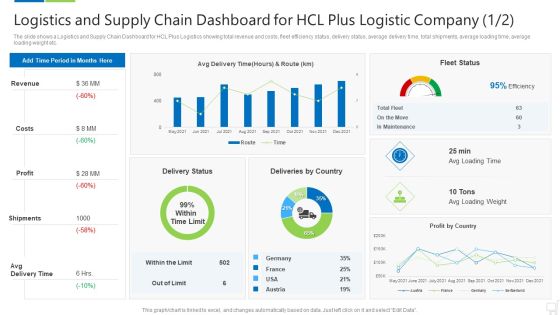
Logistics And Supply Chain Dashboard For Hcl Plus Logistic Company Revenue Themes PDF
The slide shows a Logistics and Supply Chain Dashboard for HCL Plus Logistics showing total revenue and costs, fleet efficiency status, delivery status, average delivery time, total shipments, average loading time, average loading weight etc. Deliver and pitch your topic in the best possible manner with this logistics and supply chain dashboard for hcl plus logistic company revenue themes pdf. Use them to share invaluable insights on revenue, costs, profit, shipments, avg delivery time and impress your audience. This template can be altered and modified as per your expectations. So, grab it now.
Omnichannel Marketing Dashboard With Revenue And Total Spend Revenue Ppt Icon Gridlines PDF
This slide shows an Omnichannel Marketing Dashboard with marketing spend by channel, total spend, revenue, total impressions, cost per impression, weekly social media engagement by channel etc. Deliver an awe inspiring pitch with this creative omnichannel marketing dashboard with revenue and total spend revenue ppt icon gridlines pdf bundle. Topics like marketing spend by channel, weekly engagement by channel, revenue, cost per impression, total spend can be discussed with this completely editable template. It is available for immediate download depending on the needs and requirements of the user.

IT Service Incorporation And Administration Dashboard To Measure Business Performance Portrait PDF
Mentioned slide portrays a dashboard for measuring business performance. Performance metrics covered in the slide are average weekly sales revenue, average revenue per unit, customer lifetime value and customer acquisition cost. Deliver and pitch your topic in the best possible manner with this it service incorporation and administration dashboard to measure business performance portrait pdf. Use them to share invaluable insights on sales, revenue, target, acquisition cost and impress your audience. This template can be altered and modified as per your expectations. So, grab it now.

Client Acquisition Cost For Customer Retention Client Acquisition Cost Measurement Dashboard Demonstration PDF
This slide shows a Client Acquisition Cost CAC Measurement Dashboard with details such as total customers, employee satisfaction rate, number of trials, monthly active users, NPS net promoter score etc. Deliver an awe inspiring pitch with this creative client acquisition cost for customer retention client acquisition cost measurement dashboard demonstration pdf bundle. Topics like website visitors, monthly active users, number of trials, customer acquisition cost can be discussed with this completely editable template. It is available for immediate download depending on the needs and requirements of the user.
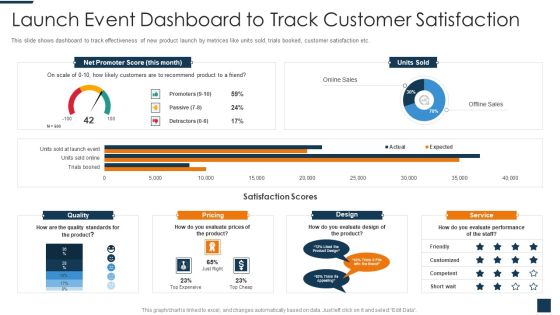
Go To Market Strategy For New Product Launch Event Dashboard To Track Customer Satisfaction Introduction PDF
This slide shows dashboard to track effectiveness of new product launch by metrices like units sold, trials booked, customer satisfaction etc. Deliver and pitch your topic in the best possible manner with this go to market strategy for new product launch event dashboard to track customer satisfaction introduction pdf. Use them to share invaluable insights on net promoter score, units sold, quality, pricing, design, service and impress your audience. This template can be altered and modified as per your expectations. So, grab it now.

Application Development Best Practice Tools And Templates Jira Dashboard For Agile Software Structure PDF
This slide covers the progress towards next milestone, projects work status, high risk items, workload details per person, work added vs work completed over time graph. Deliver and pitch your topic in the best possible manner with this application development best practice tools and templates jira dashboard for agile software structure pdf. Use them to share invaluable insights on jira dashboard for agile software teams work status and impress your audience. This template can be altered and modified as per your expectations. So, grab it now.
Illustrating Product Leadership Plan Incorporating Innovative Techniques Dashboard Depicting Sales Icons PDF
This slide focuses on dashboard that depicts sales product performance that includes top products in revenues, online verses offline purchases, incremental sales by campaign and cost of goods sold. Deliver an awe inspiring pitch with this creative illustrating product leadership plan incorporating innovative techniques dashboard depicting sales icons pdf bundle. Topics like incremental sales by campaign, top products in revenue, online vs offline purchases, cost of goods sold can be discussed with this completely editable template. It is available for immediate download depending on the needs and requirements of the user.

Strategic Partnership Management Plan Customer Relationship Management Dashboard Value Demonstration PDF
This slide covers the customer relationship management dashboard which includes company goals, revenue by deal source, new deals, etc. Deliver and pitch your topic in the best possible manner with this strategic partnership management plan customer relationship management dashboard value demonstration pdf. Use them to share invaluable insights on revenue this quarter, revenue goal attainment this year, revenue by deal source this year, revenue by deal source by owner this year, pipeline coverage this year, forecast this year, new deals by month this year and impress your audience. This template can be altered and modified as per your expectations. So, grab it now.
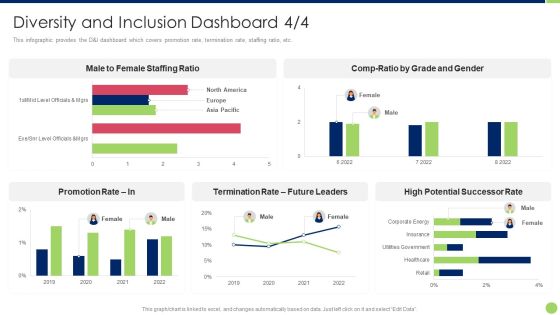
Workspace Diversification And Inclusion Strategy Diversity And Inclusion Dashboard Leaders Brochure PDF
This infographic provides the DandI dashboard which covers promotion rate, termination rate, staffing ratio, etc. Deliver and pitch your topic in the best possible manner with this workspace diversification and inclusion strategy diversity and inclusion dashboard leaders brochure pdf. Use them to share invaluable insights on male to female staffing ratio, comp ratio by grade and gender, promotion rate in, termination rate future leaders, high potential successor rate and impress your audience. This template can be altered and modified as per your expectations. So, grab it now.
Escalation Steps For Projects Dashboard For Managing Project Issues In The Organization Icons PDF
This slide provides the glimpse about the KPI for managing project issues in the organization wherein focus is on project health, tasks, progress, time, cost and workload. Deliver and pitch your topic in the best possible manner with this escalation steps for projects dashboard for managing project issues in the organization icons pdf. Use them to share invaluable insights on dashboard for managing project issues in the organization and impress your audience. This template can be altered and modified as per your expectations. So, grab it now.
Strawman Proposal For Enterprise Critical Thinking Potential Prospect Management Dashboard Icons PDF
The dashboard will provide overall scenario of all accounts and track new leads, top campaigns, expected revenue earned, etc. Deliver and pitch your topic in the best possible manner with this strawman proposal for enterprise critical thinking potential prospect management dashboard icons pdf. Use them to share invaluable insights on new leads this month, top campaigns, expected revenue by marketing channel, reasons for unqualified leads, lead status by owner and impress your audience. This template can be altered and modified as per your expectations. So, grab it now.

Digitalization Plan For Business Modernization Digital Transformation Change Management Dashboard Infographics PDF
Purpose of the following slide is to show the digital transformation change management dashboard as it highlights the percentage of digital transformation and the transformation one by priority. Deliver and pitch your topic in the best possible manner with this digitalization plan for business modernization digital transformation change management dashboard infographics pdf. Use them to share invaluable insights on transformation by priority, percent age of digital transformation and impress your audience. This template can be altered and modified as per your expectations. So, grab it now.
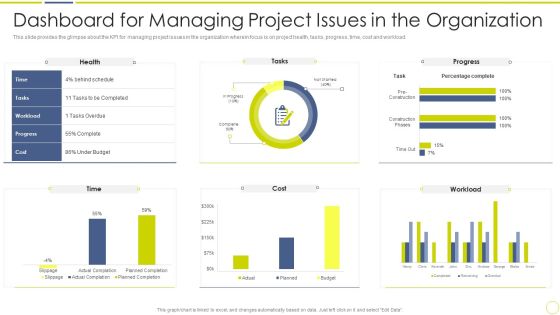
Incident And Issue Management Procedure Dashboard For Managing Project Issues In The Organization Designs PDF
This slide provides the glimpse about the KPI for managing project issues in the organization wherein focus is on project health, tasks, progress, time, cost and workload. Deliver and pitch your topic in the best possible manner with this incident and issue management procedure dashboard for managing project issues in the organization designs pdf. Use them to share invaluable insights on dashboard for managing project issues in the organization and impress your audience. This template can be altered and modified as per your expectations. So, grab it now.

Web App Firewall Services IT Dashboard For Web Application Firewall Performance Microsoft PDF
This slide describes the dashboard for web application firewall performance monitoring by covering details of application attack distribution, HTTP transaction per second, application security events source map, DDOs protected traffic, and application security events. Deliver and pitch your topic in the best possible manner with this web app firewall services it dashboard for web application firewall performance microsoft pdf. Use them to share invaluable insights on application, source, security and impress your audience. This template can be altered and modified as per your expectations. So, grab it now.

Advancement Of Retail Store In Future Tracking Essential Retail Store Activities Dashboard Portrait PDF
This slide provides details regarding the dashboard for tracking retail store activities in terms of customer retention, rate of return, volume sales, etc. Deliver an awe inspiring pitch with this creative advancement of retail store in future tracking essential retail store activities dashboard portrait pdf bundle. Topics like rate of return by category, number of new and returning customers, customer retention can be discussed with this completely editable template. It is available for immediate download depending on the needs and requirements of the user.

Desktop Security Management Dashboard For Threat Tracking In Computer Security Guidelines PDF
This slide depicts the dashboard for threat tracking in cyber security by covering monthly threat status, current risk status, threat based on the role, threats by owners, risk by threats, and threat report. Deliver an awe inspiring pitch with this creative desktop security management dashboard for threat tracking in computer security guidelines pdf bundle. Topics like threats by owners, risk by threats can be discussed with this completely editable template. It is available for immediate download depending on the needs and requirements of the user.

Sustainability Calculation With KPI Cash Flow Dashboard Liquidity Ratio Inspiration PDF Introduction PDF
Following slide covers cash flow dashboard covering details like beginning cash on hand, cash going in, cash going out, profit loss and ending cash on hand. It also includes detail of accounts receivable and payable. Deliver an awe inspiring pitch with this creative sustainability calculation with kpi cash flow dashboard cash designs pdf bundle. Topics like beginning cash on hand, cash going out, profit and loss, ending cash on hand can be discussed with this completely editable template. It is available for immediate download depending on the needs and requirements of the user.

Sustainability Calculation With KPI Customer Service Dashboard Revenue Ideas PDF Graphics PDF
Following slide illustrates customer service dashboard covering details such as request answered, total requests, total revenue and support cost revenue. It also includes customer satisfaction score, customer retention in a 12 months format. Deliver and pitch your topic in the best possible manner with this sustainability calculation with kpi customer service dashboard microsoft pdf. Use them to share invaluable insights on customer satisfaction, revenue, customer retention and impress your audience. This template can be altered and modified as per your expectations. So, grab it now.

Dashboard To Measure Performance Of Machine Driven Learning Implementation Ppt Gallery Gridlines PDF
This slide represents the critical performance indicators of RPA, such as time and money saved by different processes and the efficiency of the HR department in routine tasks. Deliver an awe inspiring pitch with this creative dashboard to measure performance of machine driven learning implementation ppt gallery gridlines pdf bundle. Topics like dashboard to measure performance of machine driven learning implementation can be discussed with this completely editable template. It is available for immediate download depending on the needs and requirements of the user.

Customer Mesh Computing IT Dashboard For Tracking Downloads In End User Computing Environment Elements PDF
This slide represents the dashboard for tracking downloads of apps in end user computing environment by covering details of average patch time, quality updates and so on. Deliver and pitch your topic in the best possible manner with this customer mesh computing it dashboard for tracking downloads in end user computing environment elements pdf. Use them to share invaluable insights ondashboard for tracking downloads in end user computing environment and impress your audience. This template can be altered and modified as per your expectations. So, grab it now.

Agile Group For Product Development Measuring Business Unit Performance Dashboard Pictures PDF
This slide covers dashboard that shows business unit performance such as new customers, average weekly sales revenue, sales revenues, profits, customer lifetime value, etc. Deliver and pitch your topic in the best possible manner with this agile group for product development measuring business unit performance dashboard pictures pdf. Use them to share invaluable insights on average revenue per unit, customer lifetime value, customer acquisition cost and impress your audience. This template can be altered and modified as per your expectations. So, grab it now.
Transformation Plan Issues Tracking Dashboard For Transition Project Ppt Summary Layouts PDF
This slide shows the issues tracking the dashboard for the business transition project. It provides details of multiple issues faced by users to keep records for effective management of the project. Deliver and pitch your topic in the best possible manner with this transformation plan issues tracking dashboard for transition project ppt summary layouts pdf. Use them to share invaluable insights on employee wise issues status, overall issues status, immediate issues, suspect requirements and impress your audience. This template can be altered and modified as per your expectations. So, grab it now.
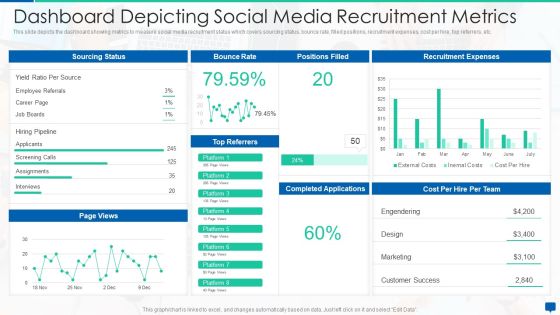
Social Media Hiring Process Optimization Dashboard Depicting Social Media Recruitment Metrics Elements PDF
This slide depicts the dashboard showing metrics to measure social media recruitment status which covers sourcing status, bounce rate, filled positions, recruitment expenses, cost per hire, top referrers, etc.Deliver an awe inspiring pitch with this creative social media hiring process optimization dashboard depicting social media recruitment metrics elements pdf bundle. Topics like accelerating the hiring process, recruitment marketing efforts, build talent community can be discussed with this completely editable template. It is available for immediate download depending on the needs and requirements of the user.

Designing And Deployment CRM Implementation Dashboard With Customer Satisfaction Clipart PDF
This slide showcases the dashboard for CRM which includes the revenue, marketing expenses, satisfaction rate, conversion funnel, tickets volume by priority, and expected sales this year. Deliver an awe inspiring pitch with this creative designing and deployment crm implementation dashboard with customer satisfaction clipart pdf bundle. Topics like pipeline vs expected sales this year, revenue vs expense by month, customer satisfaction, conversion funnel, tickets volume by priority can be discussed with this completely editable template. It is available for immediate download depending on the needs and requirements of the user.
Designing And Deployment CRM Implementation Dashboard With Sales Pipeline Icons PDF
The following slide showcases the CRM dashboard which includes leads, deals, sales revenue, revenue by products, total leads by source, total leads by status and lead distribution. Deliver and pitch your topic in the best possible manner with this designing and deployment crm implementation dashboard with sales pipeline icons pdf. Use them to share invaluable insights on crm, lead distribution, sales revenue, total leads by source, deals, sales pipeline by stage and impress your audience. This template can be altered and modified as per your expectations. So, grab it now.
Guide For Software Developers KPI Dashboard For Tracking Project Team Performance Guidelines PDF
Following slide illustrates performance monitoring dashboard that can be used by managers to track their developers team efficiency. It also includes details about billable and non-billable hours along with task summary. Deliver an awe inspiring pitch with this creative guide for software developers kpi dashboard for tracking project team performance guidelines pdf bundle. Topics like task milestone, employee productivity, estimated time, actual time can be discussed with this completely editable template. It is available for immediate download depending on the needs and requirements of the user.
Software Developer Playbook Kpi Dashboard For Tracking Project Team Performance Guidelines PDF
Following slide illustrates performance monitoring dashboard that can be used by managers to track their developers team efficiency. It also includes details about billable and non-billable hours along with task summary. Deliver an awe inspiring pitch with this creative software developer playbook kpi dashboard for tracking project team performance guidelines pdf bundle. Topics like task milestone, employee productivity, estimated time, actual time can be discussed with this completely editable template. It is available for immediate download depending on the needs and requirements of the user.
Tactical Approach To Vendor Relationship Dashboard To Track Supplier Performance Metrics Icons PDF
This slide focuses on dashboard to track supplier performance metrics which covers defect rate, on-time supplies, availability of supplier, lead time, types of defect and delivery status of suppliers.Deliver and pitch your topic in the best possible manner with this Tactical Approach To Vendor Relationship Dashboard To Track Supplier Performance Metrics Icons PDF Use them to share invaluable insights on Supplier Defect Rate, Supplier Availability, Supplier Defect and impress your audience. This template can be altered and modified as per your expectations. So, grab it now.
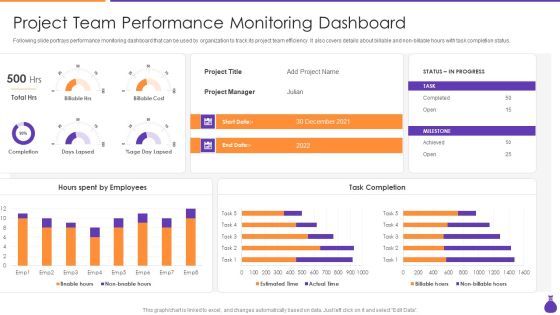
Why Is Agile Cost Effective IT Project Team Performance Monitoring Dashboard Sample PDF
Following slide portrays performance monitoring dashboard that can be used by organization to track its project team efficiency. It also covers details about billable and non-billable hours with task completion status. Deliver and pitch your topic in the best possible manner with this Why Is Agile Cost Effective IT Project Team Performance Monitoring Dashboard Sample PDF. Use them to share invaluable insights on Completion, Days Lapsed, Days Lapsed, Hours Spent By Employees and impress your audience. This template can be altered and modified as per your expectations. So, grab it now.
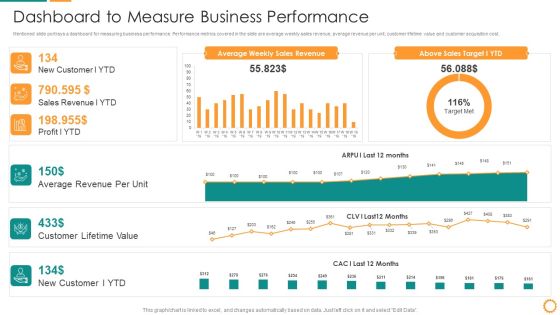
IT Consolidation Post Mergers And Acquisition Dashboard To Measure Business Performance Clipart PDF
Mentioned slide portrays a dashboard for measuring business performance. Performance metrics covered in the slide are average weekly sales revenue, average revenue per unit, customer lifetime value and customer acquisition cost. Deliver and pitch your topic in the best possible manner with this IT Consolidation Post Mergers And Acquisition Dashboard To Measure Business Performance Clipart PDF. Use them to share invaluable insights on Average Revenue, Customer Lifetime Value, Sales Revenue, Sales Target and impress your audience. This template can be altered and modified as per your expectations. So, grab it now.

Change Execution Plan Dashboard For Issues Tracking Ppt PowerPoint Presentation Gallery Background Images PDF
This slide shows the issues tracking the dashboard for the business transition project. It provides details of multiple issues faced by users to keep records for effective management of the project. Deliver and pitch your topic in the best possible manner with this Change Execution Plan Dashboard For Issues Tracking Ppt PowerPoint Presentation Gallery Background Images PDF. Use them to share invaluable insights on Employee Wise Issues, Overall Issues Status, High Churn Issue and impress your audience. This template can be altered and modified as per your expectations. So, grab it now.

Enhancing Logistics Customer Service Dashboard To Track Inventory Management Status Microsoft PDF
This slide focuses on the dashboard to track inventory management status which covers annual stock conversion into sales, inventory turnover, inventory carrying cost and accuracy. Deliver and pitch your topic in the best possible manner with this Enhancing Logistics Customer Service Dashboard To Track Inventory Management Status Microsoft PDF. Use them to share invaluable insights on Inventory Carrying Cost, Inventory Turnover Last, 5 Years Stock, Conversion Into Sales, and impress your audience. This template can be altered and modified as per your expectations. So, grab it now.
Enhancing Logistics Customer Service Supply Chain Activity Tracking Dashboard Sample PDF
This slide shows the dashboard that depicts supply chain management which includes retailer and warehouse capacity, delivery status from supplier to warehouse, time to reach there, etc. Deliver and pitch your topic in the best possible manner with this Enhancing Logistics Customer Service Supply Chain Activity Tracking Dashboard Sample PDF. Use them to share invaluable insights on Retailer One Capacity, Warehouse Capacity Time, Retailer Two Capacity, Supplier To Warehouse and impress your audience. This template can be altered and modified as per your expectations. So, grab it now.

Workforce Management Strategies For Effective Hiring Process Kpi Dashboard To Measure Talent Performance Formats PDF
This slide represents dashboard to measure talent performance in organization. It includes talent applicant status, team training methods, talented candidate status, risk for loss of potential talent pool etc. Deliver an awe inspiring pitch with this creative Workforce Management Strategies For Effective Hiring Process Kpi Dashboard To Measure Talent Performance Formats PDF bundle. Topics like Potential Candidate, Talent Performance, Learning Platform can be discussed with this completely editable template. It is available for immediate download depending on the needs and requirements of the user.

Effective Sales Technique For New Product Launch Dashboard To Track Sales Opportunities Introduction PDF
Mentioned slide shows dashboard that can be used by an organization to track win and lost sales opportunities. It includes metrics namely won opportunities, lost opportunities, pipeline by territory, total opportunities.Deliver an awe inspiring pitch with this creative Effective Sales Technique For New Product Launch Dashboard To Track Sales Opportunities Introduction PDF bundle. Topics like Lost Opportunities, Total Opportunities, Revenue Territory can be discussed with this completely editable template. It is available for immediate download depending on the needs and requirements of the user.

New Product Sales Strategy And Marketing Dashboard To Track Sales Opportunities Rules PDF
Mentioned slide shows dashboard that can be used by an organization to track win and lost sales opportunities. It includes metrics namely won opportunities, lost opportunities, pipeline by territory, total opportunities. Deliver and pitch your topic in the best possible manner with this New Product Sales Strategy And Marketing Dashboard To Track Sales Opportunities Rules PDF. Use them to share invaluable insights on Won Opportunities, Lost Opportunities, Revenue and impress your audience. This template can be altered and modified as per your expectations. So, grab it now.
Project Transition Plan Dashboard For Issues Tracking Ppt PowerPoint Presentation File Example PDF
This slide shows the issues tracking the dashboard for the business transition project. It provides details of multiple issues faced by users to keep records for effective management of the project. Deliver an awe inspiring pitch with this creative Project Transition Plan Dashboard For Issues Tracking Ppt PowerPoint Presentation File Example PDF bundle. Topics like Employee Wise, Immediate Issues, Suspect Requirements can be discussed with this completely editable template. It is available for immediate download depending on the needs and requirements of the user.

Steps Of Employee Hiring Process For HR Management Dashboard To Track Recruitment Process Activities Guidelines PDF
This slide focuses on dashboard to track recruitment process activities such as monthly hires, total hirings by department and source, average time to recruit, candidate feedback, offer acceptance rate, etc.Deliver and pitch your topic in the best possible manner with this Steps Of Employee Hiring Process For HR Management Dashboard To Track Recruitment Process Activities Guidelines PDF Use them to share invaluable insights on Interview Activity, Offer Acceptance, Candidate and impress your audience. This template can be altered and modified as per your expectations. So, grab it now.
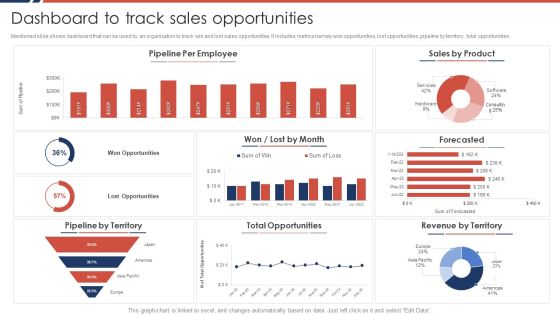
Effective Sales Plan For New Product Introduction In Market Dashboard To Track Sales Opportunities Formats PDF
Mentioned slide shows dashboard that can be used by an organization to track win and lost sales opportunities. It includes metrics namely won opportunities, lost opportunities, pipeline by territory, total opportunities.Deliver an awe inspiring pitch with this creative Effective Sales Plan For New Product Introduction In Market Dashboard To Track Sales Opportunities Formats PDF bundle. Topics like Pipeline Employee, Total Opportunities, Revenue Territory can be discussed with this completely editable template. It is available for immediate download depending on the needs and requirements of the user.

Developing Retail Marketing Strategies To Increase Revenue KPI Metrics Dashboard To Measure Online Portrait PDF
The following slide outlines KPI metrics dashboard which can be used to measure the effectiveness of online marketing on retail store. The metrics covered in the slide are new orders, total income, expense, new users, best selling products, etc.Deliver and pitch your topic in the best possible manner with this Developing Retail Marketing Strategies To Increase Revenue KPI Metrics Dashboard To Measure Online Portrait PDF Use them to share invaluable insights on Total Income, Total Expense, Summary and impress your audience. This template can be altered and modified as per your expectations. So, grab it now.
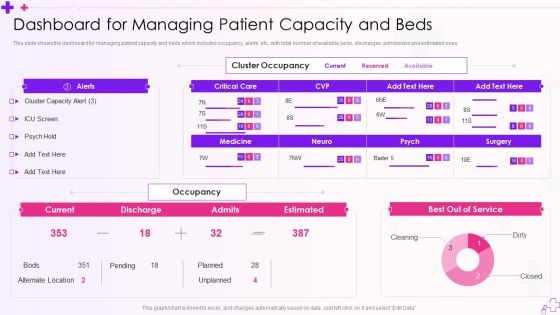
Integration Of Healthcare Center Administration System Dashboard For Managing Patient Capacity And Beds Template PDF
This slide shows the dashboard for managing patient capacity and beds which includes occupancy, alerts, etc, with total number of available beds, discharges, admissions and estimated ones.Deliver and pitch your topic in the best possible manner with this Integration Of Healthcare Center Administration System Dashboard For Managing Patient Capacity And Beds Template PDF Use them to share invaluable insights on Cluster Occupancy, Cluster Capacity, Alternate Location and impress your audience. This template can be altered and modified as per your expectations. So, grab it now.

Integration Of Healthcare Center Administration System Hospital Performance Dashboard To Improve Operations Microsoft PDF
This slide focuses on the hospital performance dashboard to improve operations which covers total patients, operational expenses, patient satisfaction, average waiting time, staff per department, etc.Deliver and pitch your topic in the best possible manner with this Integration Of Healthcare Center Administration System Hospital Performance Dashboard To Improve Operations Microsoft PDF Use them to share invaluable insights on Patient Satisfaction, Confidence In Treatment, Admission By Department and impress your audience. This template can be altered and modified as per your expectations. So, grab it now.
Implementation Strategy For Project Solution Dashboard For Issues Tracking Summary PDF
This slide shows the issues tracking the dashboard for the business transition project. It provides details of multiple issues faced by users to keep records for effective management of the project. Deliver an awe inspiring pitch with this creative Implementation Strategy For Project Solution Dashboard For Issues Tracking Summary PDF bundle. Topics like Overall Issues Status, Employee Wise Issues Status, Immediate Issues can be discussed with this completely editable template. It is available for immediate download depending on the needs and requirements of the user.
Transformation Plan Issues Tracking Dashboard For Transition Project Ppt PowerPoint Presentation File Styles PDF
This slide shows the issues tracking the dashboard for the business transition project. It provides details of multiple issues faced by users to keep records for effective management of the project. Deliver an awe inspiring pitch with this creative Transformation Plan Issues Tracking Dashboard For Transition Project Ppt PowerPoint Presentation File Styles PDF bundle. Topics like Immediate Issues, High Churn Issues, Suspect Requirements can be discussed with this completely editable template. It is available for immediate download depending on the needs and requirements of the user.

Coordinating Distinct Activities For Effective Project Time Management Dashboard To Monitor Project Portrait PDF
This slide focuses on dashboard to monitor project status and performance which includes estimated budget, actual cost, time taken by project team to complete phases, completion percentage of project, etc.Deliver and pitch your topic in the best possible manner with this Coordinating Distinct Activities For Effective Project Time Management Dashboard To Monitor Project Portrait PDF Use them to share invaluable insights on Project Performance, Cost Performance, Completing Project and impress your audience. This template can be altered and modified as per your expectations. So, grab it now.

Strategic Human Resource Retention Management Dashboard For Employee Retention Polices Infographics PDF
Purpose of the following slide is to show the Employee Attrition dashboard as it highlights the Employee turnover rate, average seniority of employees in months, year-over-year turnover rate etc.Deliver and pitch your topic in the best possible manner with this Strategic Human Resource Retention Management Dashboard For Employee Retention Polices Infographics PDF. Use them to share invaluable insights on Turnover Rate, Rate By Division, Employee Turnover and impress your audience. This template can be altered and modified as per your expectations. So, grab it now.
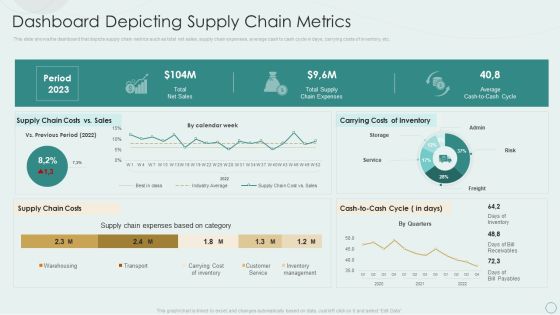
Learning Various Supply Chain Models Dashboard Depicting Supply Chain Metrics Pictures PDF
This slide shows the dashboard that depicts supply chain metrics such as total net sales, supply chain expenses, average cash to cash cycle in days, carrying costs of inventory, etc. Deliver an awe inspiring pitch with this creative Learning Various Supply Chain Models Dashboard Depicting Supply Chain Metrics Pictures PDF bundle. Topics like Period 2023, Total Net Sales, Carrying Costs Inventory, Supply Chain Costs can be discussed with this completely editable template. It is available for immediate download depending on the needs and requirements of the user.

Learning Various Supply Chain Models Supply Chain Dashboard To Measure Shipping Status Graphics PDF
This slide focuses on supply chain dashboard to measure shipping status which covers on time orders, orders in progress, late deliveries, average processing and order fulfillment rate, late deliveries, etc. Deliver and pitch your topic in the best possible manner with this Learning Various Supply Chain Models Supply Chain Dashboard To Measure Shipping Status Graphics PDF. Use them to share invaluable insights on Warehouse, Product, Late Deliveries, On Time Orders and impress your audience. This template can be altered and modified as per your expectations. So, grab it now.
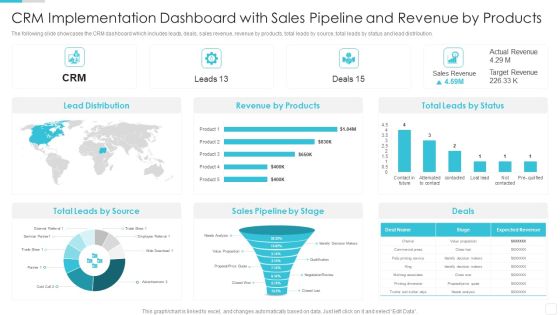
Sales CRM Cloud Solutions Deployment CRM Implementation Dashboard With Sales Template PDF
The following slide showcases the CRM dashboard which includes leads, deals, sales revenue, revenue by products, total leads by source, total leads by status and lead distribution.Deliver and pitch your topic in the best possible manner with this Sales CRM Cloud Solutions Deployment CRM Implementation Dashboard With Sales Template PDF. Use them to share invaluable insights on Lead Distribution, Revenue By Products, Leads By Source and impress your audience. This template can be altered and modified as per your expectations. So, grab it now.
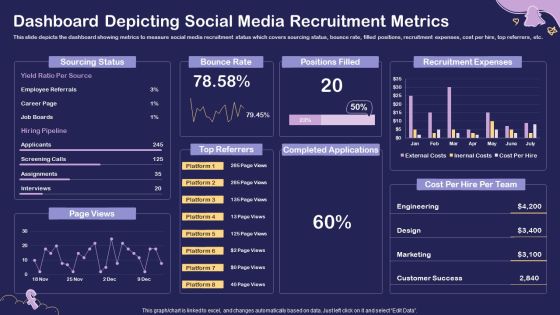
Social Media Hiring For Potential Candidate Dashboard Depicting Social Media Recruitment Structure PDF
This slide depicts the dashboard showing metrics to measure social media recruitment status which covers sourcing status, bounce rate, filled positions, recruitment expenses, cost per hire, top referrers, etc. Deliver an awe inspiring pitch with this creative Social Media Hiring For Potential Candidate Dashboard Depicting Social Media Recruitment Structure PDF bundle. Topics like Sourcing Status, Bounce Rate, Positions Filled, Recruitment Expenses can be discussed with this completely editable template. It is available for immediate download depending on the needs and requirements of the user.
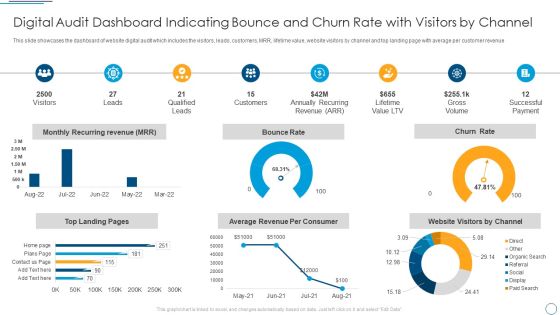
Digital Audit Dashboard Indicating Bounce And Churn Rate With Visitors By Channel Demonstration PDF
This slide showcases the dashboard of website digital audit which includes the visitors, leads, customers, MRR, lifetime value, website visitors by channel and top landing page with average per customer revenue.Deliver and pitch your topic in the best possible manner with this Digital Audit Dashboard Indicating Bounce And Churn Rate With Visitors By Channel Demonstration PDF. Use them to share invaluable insights on Qualified Leads, Annually Recurring, Successful Payment and impress your audience. This template can be altered and modified as per your expectations. So, grab it now.

KPI Metrics Dashboard To Effectively Track Cyber Threat Management Demonstration PDF
The purpose of this slide is to highlight performance KPI dashboard used to monitor the cyber threat management. The metrics highlighted in the slide are risk score, compliance status, threat level, monitoring and operational status. Deliver an awe inspiring pitch with this creative KPI Metrics Dashboard To Effectively Track Cyber Threat Management Demonstration PDF bundle. Topics like Threat Status, Current Risk, Threat Report can be discussed with this completely editable template. It is available for immediate download depending on the needs and requirements of the user.

Techniques For Timely Project Dashboard To Monitor Project Status And Performance Microsoft PDF
This slide focuses on dashboard to monitor project status and performance which includes estimated budget, actual cost, time taken by project team to complete phases, completion percentage of project, etc. Deliver and pitch your topic in the best possible manner with this Techniques For Timely Project Dashboard To Monitor Project Status And Performance Microsoft PDF. Use them to share invaluable insights on Timeline vs, Resource Capacity, Project Phase, Time Involved and impress your audience. This template can be altered and modified as per your expectations. So, grab it now.

Techniques For Timely Project Project Management Dashboard To Evaluate Performance Summary PDF
This slide covers the project management dashboard which includes status of project phases such as planning, designing, development and testing that also focuses on launch date of project, overdue tasks with date, deadline, etc. and workload on employees. Deliver and pitch your topic in the best possible manner with this Techniques For Timely Project Project Management Dashboard To Evaluate Performance Summary PDF. Use them to share invaluable insights on Project Launch, Planning, Design, Development and impress your audience. This template can be altered and modified as per your expectations. So, grab it now.
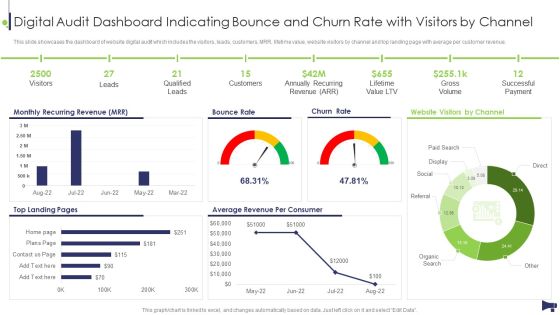
Website And Social Media Digital Audit Dashboard Indicating Bounce And Churn Rate Template PDF
This slide showcases the dashboard of website digital audit which includes the visitors, leads, customers, MRR, lifetime value, website visitors by channel and top landing page with average per customer revenue. Deliver and pitch your topic in the best possible manner with this Website And Social Media Digital Audit Dashboard Indicating Bounce And Churn Rate Template PDF. Use them to share invaluable insights on Monthly Recurring Revenue, Bounce Rate, Churn Rate and impress your audience. This template can be altered and modified as per your expectations. So, grab it now.
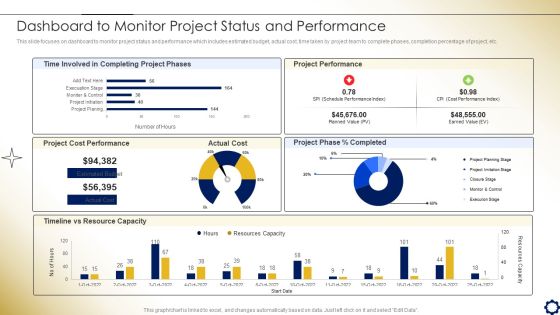
Project Time Management To Enhance Productivity Dashboard To Monitor Project Status And Performance Background PDF
This slide focuses on dashboard to monitor project status and performance which includes estimated budget, actual cost, time taken by project team to complete phases, completion percentage of project, etc.Deliver and pitch your topic in the best possible manner with this Project Time Management To Enhance Productivity Dashboard To Monitor Project Status And Performance Background PDF. Use them to share invaluable insights on Time Involved, Completing Project, Project Performance and impress your audience. This template can be altered and modified as per your expectations. So, grab it now.

Digital Marketing Guide For B2B Firms Dashboard To Track Social Media Ads Campaign Results Topics PDF
This slide showcases dashboard that can help organization to track performance of social media advertising campaigns. Its key components are cost per conversion, CTR, link clicks, impressions, conversion rate, click through rate and cost per click.Deliver and pitch your topic in the best possible manner with this Digital Marketing Guide For B2B Firms Dashboard To Track Social Media Ads Campaign Results Topics PDF. Use them to share invaluable insights on Website Conversions, Conversions Rate, Cost Per Conversion and impress your audience. This template can be altered and modified as per your expectations. So, grab it now.
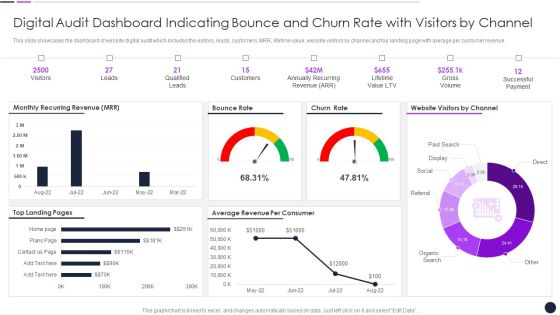
Digital Audit Dashboard Indicating Bounce And Churn Rate With Visitors By Channel Inspiration PDF
This slide showcases the dashboard of website digital audit which includes the visitors, leads, customers, MRR, lifetime value, website visitors by channel and top landing page with average per customer revenue.Deliver and pitch your topic in the best possible manner with this Digital Audit Dashboard Indicating Bounce And Churn Rate With Visitors By Channel Inspiration PDF. Use them to share invaluable insights on Qualified Leads, Annually Recurring, Lifetime Value and impress your audience. This template can be altered and modified as per your expectations. So, grab it now.
Online Customer Interaction Online Ad Campaign Performance Tracking Dashboard Demonstration PDF
This slide covers the KPI dashboard for measuring digital campaign results. It includes metrics such as Ad cost, clicks, impressions, CTR, cost per click, conversions, conversion rate, cost per click, cost per thousand impressions, etc. Deliver and pitch your topic in the best possible manner with this Online Customer Interaction Online Ad Campaign Performance Tracking Dashboard Demonstration PDF. Use them to share invaluable insights on Conversations, Impressions, Conversation Rate and impress your audience. This template can be altered and modified as per your expectations. So, grab it now.
Sustainable Energy Dashboard For Our Green Energy Projects Ppt PowerPoint Presentation Show Icons PDF
This slide depicts the dashboard for our green energy projects by covering details of total projects, projects by sector, energy sources, the contribution of green energy projects in households, industry, etc.Deliver and pitch your topic in the best possible manner with this Sustainable Energy Dashboard For Our Green Energy Projects Ppt PowerPoint Presentation Show Icons PDF. Use them to share invaluable insights on Production Coasts, Total Sales, Under Construction and impress your audience. This template can be altered and modified as per your expectations. So, grab it now.

Customer Relationship Management Software CRM Dashboard For Tracking Sales Pipeline Background PDF
This slide covers the CRM KPI dashboard for monitoring lead status in the sales funnel. It includes metrics such as open pipeline value, open pipeline by product package, pipeline value forecast, etc. Deliver and pitch your topic in the best possible manner with this Customer Relationship Management Software CRM Dashboard For Tracking Sales Pipeline Background PDF. Use them to share invaluable insights on Product Package, Pipeline Value, Value Forecast and impress your audience. This template can be altered and modified as per your expectations. So, grab it now.
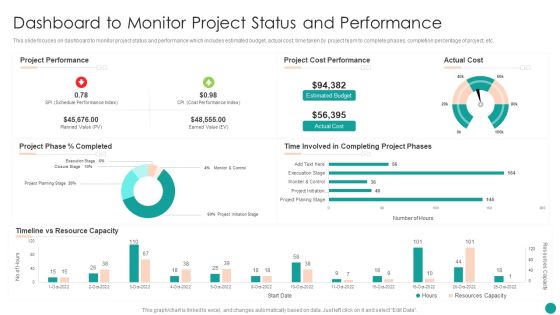
Time Management Techniques For Successful Project Dashboard To Monitor Project Status And Performance Brochure PDF
This slide focuses on dashboard to monitor project status and performance which includes estimated budget, actual cost, time taken by project team to complete phases, completion percentage of project, etc.Deliver and pitch your topic in the best possible manner with this Time Management Techniques For Successful Project Dashboard To Monitor Project Status And Performance Brochure PDF. Use them to share invaluable insights on Project Performance, Cost Performance, Completing Project and impress your audience. This template can be altered and modified as per your expectations. So, grab it now.

Time Management Techniques For Successful Project Project Management Dashboard To Evaluate Mockup PDF
This slide covers the project management dashboard which includes status of project phases such as planning, designing, development and testing that also focuses on launch date of project, overdue tasks with date, deadline, etc. and workload on employees.Deliver an awe inspiring pitch with this creative Time Management Techniques For Successful Project Project Management Dashboard To Evaluate Mockup PDF bundle. Topics like Development, Project Launch, Upcoming Deadline can be discussed with this completely editable template. It is available for immediate download depending on the needs and requirements of the user.

CRM System Implementation Stages CRM Dashboard For Tracking Sales Pipeline Background PDF
This slide covers the CRM KPI dashboard for monitoring lead status in the sales funnel. It includes metrics such as open pipeline value, open pipeline by product package, pipeline value forecast, etc. Deliver and pitch your topic in the best possible manner with this CRM System Implementation Stages CRM Dashboard For Tracking Sales Pipeline Background PDF. Use them to share invaluable insights on Pipeline Value, Value Forecast, Sales Opportunities and impress your audience. This template can be altered and modified as per your expectations. So, grab it now.
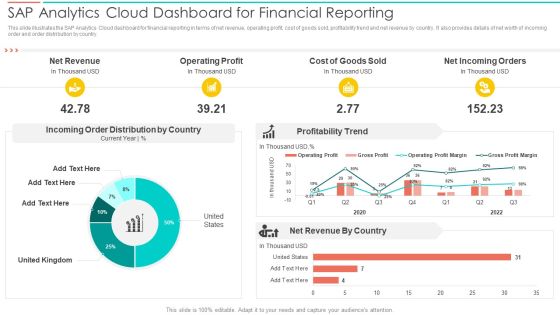
SAC Planning And Implementation SAP Analytics Cloud Dashboard For Financial Reporting Introduction PDF
This slide illustrates the SAP Analytics Cloud dashboard for financial reporting in terms of net revenue, operating profit, cost of goods sold, profitability trend and net revenue by country. It also provides details of net worth of incoming order and order distribution by country. Deliver an awe inspiring pitch with this creative SAC Planning And Implementation SAP Analytics Cloud Dashboard For Financial Reporting Introduction PDF bundle. Topics like Net Revenue, Operating Profit, Cost Goods Sold can be discussed with this completely editable template. It is available for immediate download depending on the needs and requirements of the user.
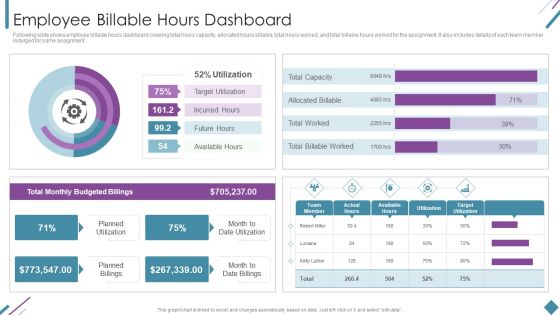
Metrics To Measure Business Performance Employee Billable Hours Dashboard Diagrams PDF
Following slide shows employee billable hours dashboard covering total hours capacity, allocated hours billable, total hours worked, and total billable hours worked for the assignment. It also includes details of each team member indulged for same assignment. Deliver an awe inspiring pitch with this creative Metrics To Measure Business Performance Employee Billable Hours Dashboard Diagrams PDF bundle. Topics like Total Monthly, Budgeted Billings, Planned Utilization can be discussed with this completely editable template. It is available for immediate download depending on the needs and requirements of the user.
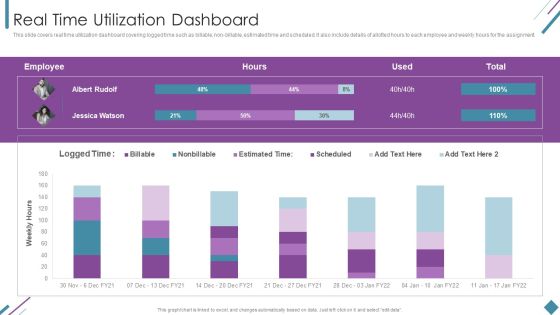
Metrics To Measure Business Performance Real Time Utilization Dashboard Topics PDF
This slide covers real time utilization dashboard covering logged time such as billable, non-billable, estimated time and scheduled. It also include details of allotted hours to each employee and weekly hours for the assignment. Deliver an awe inspiring pitch with this creative Metrics To Measure Business Performance Real Time Utilization Dashboard Topics PDF bundle. Topics like Weekly Hours, Employee, Estimated Time can be discussed with this completely editable template. It is available for immediate download depending on the needs and requirements of the user.
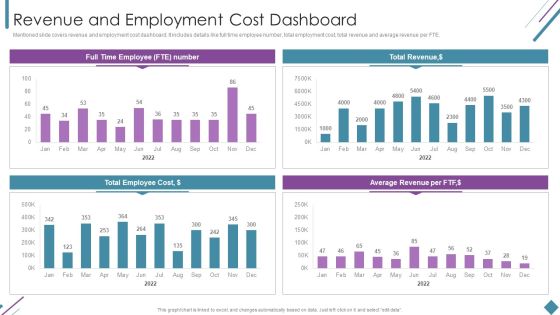
Metrics To Measure Business Performance Revenue And Employment Cost Dashboard Clipart PDF
Mentioned slide covers revenue and employment cost dashboard. It includes details like full time employee number, total employment cost, total revenue and average revenue per FTE. Deliver and pitch your topic in the best possible manner with this Metrics To Measure Business Performance Revenue And Employment Cost Dashboard Clipart PDF. Use them to share invaluable insights on Total Revenue, Average Revenue Per, Total Employee Cost and impress your audience. This template can be altered and modified as per your expectations. So, grab it now.
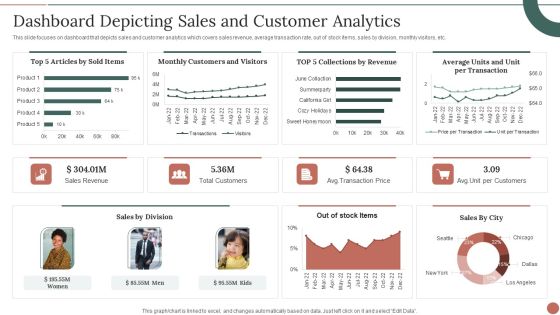
Retail Business Product Planning Procedure Dashboard Depicting Sales And Customer Analytics Themes PDF
This slide focuses on dashboard that depicts sales and customer analytics which covers sales revenue, average transaction rate, out of stock items, sales by division, monthly visitors, etc. Deliver and pitch your topic in the best possible manner with this Retail Business Product Planning Procedure Dashboard Depicting Sales And Customer Analytics Themes PDF. Use them to share invaluable insights on Sales Revenue, Total Customers, Sales By Division and impress your audience. This template can be altered and modified as per your expectations. So, grab it now.

Social Networking Program Dashboard To Track Social Media Engagement Activity Rules PDF
This slide focuses on dashboard that depicts tracking status of social media engagement activities that covers subscribers, followers, likes, channel views, clicks and likes, shares, posts, etc. Deliver and pitch your topic in the best possible manner with this Social Networking Program Dashboard To Track Social Media Engagement Activity Rules PDF. Use them to share invaluable insights on Share last month, YouTube Channel Views, Facebook Daily Reach and impress your audience. This template can be altered and modified as per your expectations. So, grab it now.

CRM System Deployment Plan CRM Dashboard For Tracking Sales Pipeline Pictures PDF
This slide covers the CRM KPI dashboard for monitoring lead status in the sales funnel. It includes metrics such as open pipeline value, open pipeline by product package, pipeline value forecast, etc. Deliver an awe inspiring pitch with this creative CRM System Deployment Plan CRM Dashboard For Tracking Sales Pipeline Pictures PDF bundle. Topics like Pipeline Value Forecast, Open Pipeline Value, Branding can be discussed with this completely editable template. It is available for immediate download depending on the needs and requirements of the user.

Banking Operation Strategy Dashboard Highlighting Deposits And Growth Rate Icons PDF
This slide highlights the banking operation strategy dashboard which showcases current account and saving account growth rate, savings account deposits, current account deposits and retail term deposits. Deliver and pitch your topic in the best possible manner with this Banking Operation Strategy Dashboard Highlighting Deposits And Growth Rate Icons PDF. Use them to share invaluable insights on Current Account Deposits, Retail Term Deposits, Growth Rate and impress your audience. This template can be altered and modified as per your expectations. So, grab it now.
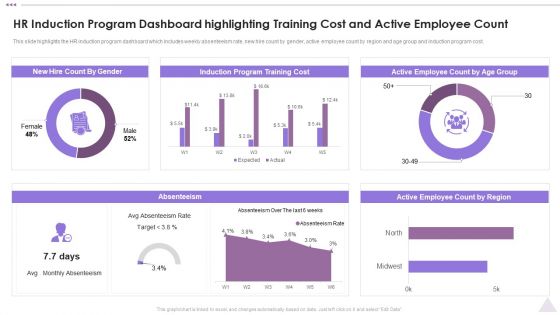
New Staff Orientation Session HR Induction Program Dashboard Highlighting Training Cost Template PDF
This slide highlights the HR induction program dashboard which includes weekly absenteeism rate, new hire count by gender, active employee count by region and age group and induction program cost. Deliver and pitch your topic in the best possible manner with this New Staff Orientation Session HR Induction Program Dashboard Highlighting Training Cost Template PDF. Use them to share invaluable insights on Induction Program, Training Cost, Absenteeism, Active Employee and impress your audience. This template can be altered and modified as per your expectations. So, grab it now.

Integrating Social Media Tactics Dashboard For Monitoring Social Media Traffic Ideas PDF
This slide shows dashboard for tracking social media traffic. It provides details about sessions, bounce rate, average time on platform, pages per visit, clicks, goals, goal conversion rate, Facebook, Instagram, YouTube, Snapchat, etc. Deliver and pitch your topic in the best possible manner with this Integrating Social Media Tactics Dashboard For Monitoring Social Media Traffic Ideas PDF. Use them to share invaluable insights on Social Traffic, Social Goals, Goal Conversion Rate and impress your audience. This template can be altered and modified as per your expectations. So, grab it now.
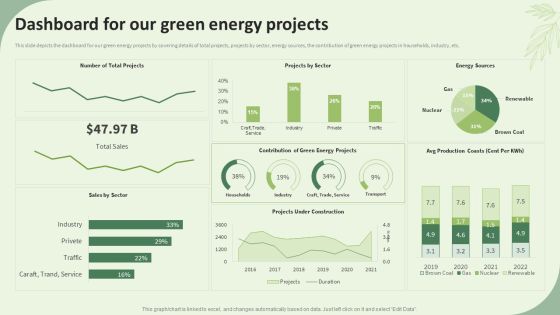
Sustainable Energy Resources Dashboard For Our Green Energy Projects Mockup PDF
This slide depicts the dashboard for our green energy projects by covering details of total projects, projects by sector, energy sources, the contribution of green energy projects in households, industry, etc. Deliver and pitch your topic in the best possible manner with this Sustainable Energy Resources Dashboard For Our Green Energy Projects Mockup PDF. Use them to share invaluable insights on Projects Sector, Energy Sources, Sales Sector and impress your audience. This template can be altered and modified as per your expectations. So, grab it now.

Brand Promotion Communication Strategy Dashboard For Analyzing Brand Perception Introduction PDF
This slide covers the dashboard for tracking brand reputation. It also includes metrics such as new customer lifetime value, customer acquisition cost, target met, above sales target, average weekly sales revenue, etc. Deliver an awe inspiring pitch with this creative Brand Promotion Communication Strategy Dashboard For Analyzing Brand Perception Introduction PDF bundle. Topics like New customer YTD, Sales revenue YTD, Profit YTD can be discussed with this completely editable template. It is available for immediate download depending on the needs and requirements of the user.

Organic Business Growth Strategies Dashboard For Measuring Success Of Our Marketing Efforts Diagrams PDF
Purpose of the following slide is to display a dashboard to help analyze the marketing efforts through essential metrics such as the revenue generated, average revenue generated per unit etc. Deliver an awe inspiring pitch with this creative Organic Business Growth Strategies Dashboard For Measuring Success Of Our Marketing Efforts Diagrams PDF bundle. Topics like Average Revenue, Customer Lifetime Value, Customer Acquisition Cost can be discussed with this completely editable template. It is available for immediate download depending on the needs and requirements of the user.
 Home
Home