Data Dashboard
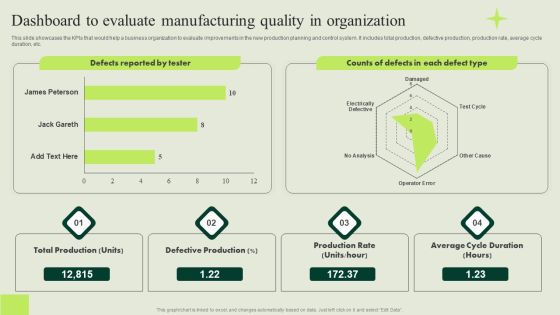
Manufacturing Quality Assurance And Control Measures Dashboard To Evaluate Manufacturing Quality Infographics PDF
This slide showcases the KPIs that would help a business organization to evaluate improvements in the new production planning and control system. It includes total production, defective production, production rate, average cycle duration, etc. This modern and well arranged Manufacturing Quality Assurance And Control Measures Dashboard To Evaluate Manufacturing Quality Infographics PDF provides lots of creative possibilities. It is very simple to customize and edit with the Powerpoint Software. Just drag and drop your pictures into the shapes. All facets of this template can be edited with Powerpoint, no extra software is necessary. Add your own material, put your images in the places assigned for them, adjust the colors, and then you can show your slides to the world, with an animated slide included.

Creating Positioning Techniques For Market Research Kpi Dashboard To Analyze Customer Satisfaction Mockup PDF
The following slide outlines a comprehensive visual representation of customer satisfaction CSAT that can assist companies to measure how happy are customers wit the brand. The KPIs covered are net promoter score NPS, customer effort score CES, product quality, pricing, etc. Want to ace your presentation in front of a live audience Our Creating Positioning Techniques For Market Research Kpi Dashboard To Analyze Customer Satisfaction Mockup PDF can help you do that by engaging all the users towards you. Slidegeeks experts have put their efforts and expertise into creating these impeccable powerpoint presentations so that you can communicate your ideas clearly. Moreover, all the templates are customizable, and easy to edit and downloadable. Use these for both personal and commercial use.

Quality Assurance Indicator Dashboard Ppt PowerPoint Presentation Complete Deck With Slides
Share a great deal of information on the topic by deploying this Quality Assurance Indicator Dashboard Ppt PowerPoint Presentation Complete Deck With Slides. Support your ideas and thought process with this prefabricated set. It includes a set of Fifteen slides, all fully modifiable and editable. Each slide can be restructured and induced with the information and content of your choice. You can add or remove large content boxes as well, to make this PPT slideshow more personalized. Its high-quality graphics and visuals help in presenting a well-coordinated pitch. This PPT template is also a resourceful tool to take visual cues from and implement the best ideas to help your business grow and expand. The main attraction of this well-formulated deck is that everything is editable, giving you the freedom to adjust it to your liking and choice. Changes can be made in the background and theme as well to deliver an outstanding pitch. Therefore, click on the download button now to gain full access to this multifunctional set.
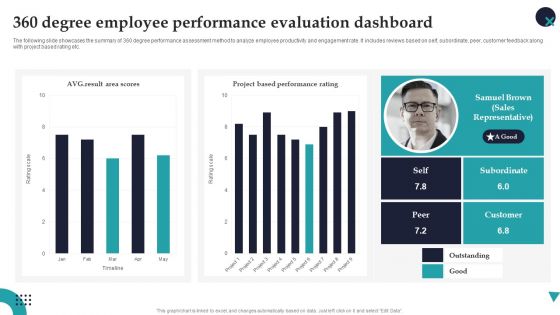
360 Degree Employee Performance Evaluation Dashboard Employee Performance Management Elements PDF
The following slide showcases the summary of 360 degree performance assessment method to analyze employee productivity and engagement rate. It includes reviews based on self, subordinate, peer, customer feedback along with project based rating etc.Retrieve professionally designed 360 Degree Employee Performance Evaluation Dashboard Employee Performance Management Elements PDF to effectively convey your message and captivate your listeners. Save time by selecting pre-made slideshows that are appropriate for various topics, from business to educational purposes. These themes come in many different styles, from creative to corporate, and all of them are easily adjustable and can be edited quickly. Access them as PowerPoint templates or as Google Slides themes. You do not have to go on a hunt for the perfect presentation because Slidegeeks got you covered from everywhere.
Procurement Automation Strategy End To End Process Tracking Dashboard On Cloud Pictures PDF
This slide covers tool for analysing end to end procurement process. It includes features such as tracking real- time overall business health, checking quotation to order conversion, automated notifications and payments reminders, etc. Do you know about Slidesgeeks Procurement Automation Strategy End To End Process Tracking Dashboard On Cloud Pictures PDF These are perfect for delivering any kind od presentation. Using it, create PowerPoint presentations that communicate your ideas and engage audiences. Save time and effort by using our pre designed presentation templates that are perfect for a wide range of topic. Our vast selection of designs covers a range of styles, from creative to business, and are all highly customizable and easy to edit. Download as a PowerPoint template or use them as Google Slides themes.
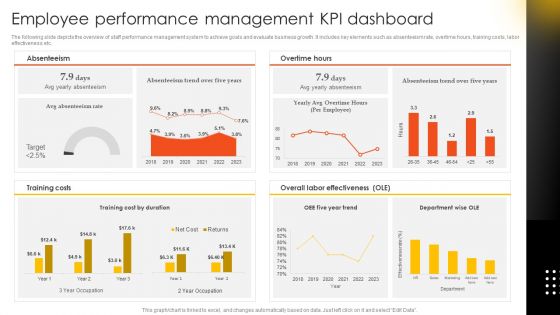
Effective Staff Performance Optimization Techniques Employee Performance Management Kpi Dashboard Professional PDF
The following slide depicts the overview of staff performance management system to achieve goals and evaluate business growth. It includes key elements such as absenteeism rate, overtime hours, training costs, labor effectiveness etc. Slidegeeks is one of the best resources for PowerPoint templates. You can download easily and regulate Effective Staff Performance Optimization Techniques Employee Performance Management Kpi Dashboard Professional PDF for your personal presentations from our wonderful collection. A few clicks is all it takes to discover and get the most relevant and appropriate templates. Use our Templates to add a unique zing and appeal to your presentation and meetings. All the slides are easy to edit and you can use them even for advertisement purposes.

Dashboard Showcasing Impact Of Real Time Marketing On Sales Ppt Gallery Design Templates PDF
The following slide depicts results of real time marketing . It includes elements such as sales metrics, subscribers, SMS sent, clicks, click through rate CTR, average order value, conversion rate, return on investment ROI etc. This modern and well-arranged Dashboard Showcasing Impact Of Real Time Marketing On Sales Ppt Gallery Design Templates PDF provides lots of creative possibilities. It is very simple to customize and edit with the Powerpoint Software. Just drag and drop your pictures into the shapes. All facets of this template can be edited with Powerpoint, no extra software is necessary. Add your own material, put your images in the places assigned for them, adjust the colors, and then you can show your slides to the world, with an animated slide included.
Implementing On Site Seo Strategy To Expand Customer Reach Seo Tracking Dashboard Backlinks Formats PDF
Purpose of the following slide is to measure the SEO performance of the organization as it measures the keywords, backlinks, the total number of sessions and average call duration. Welcome to our selection of the Implementing On Site Seo Strategy To Expand Customer Reach Seo Tracking Dashboard Backlinks Formats PDF. These are designed to help you showcase your creativity and bring your sphere to life. Planning and Innovation are essential for any business that is just starting out. This collection contains the designs that you need for your everyday presentations. All of our PowerPoints are 100 percent editable, so you can customize them to suit your needs. This multi purpose template can be used in various situations. Grab these presentation templates today.

Dashboard To Measure Display Advertising Campaigns Performance Ppt Layouts Objects PDF
This slide showcases the functioning model of the programmatic RTB methodology. It include processes such as user visit, website communication with SSP, SSP communication with DSP and setting bid rates. Present like a pro with Dashboard To Measure Display Advertising Campaigns Performance Ppt Layouts Objects PDF Create beautiful presentations together with your team, using our easy to use presentation slides. Share your ideas in real time and make changes on the fly by downloading our templates. So whether you are in the office, on the go, or in a remote location, you can stay in sync with your team and present your ideas with confidence. With Slidegeeks presentation got a whole lot easier. Grab these presentations today.
Effective NPO Promotional Strategies For Recruit Volunteers Nonprofit Donor And Supporter Dashboard For Fundraising Summary PDF
This slide provides an overview of the marketing plan prepared by nonprofits to showcase the key areas. The table includes organization summary, objectives, problems and potential solution Slidegeeks is one of the best resources for PowerPoint templates. You can download easily and regulate Effective NPO Promotional Strategies For Recruit Volunteers Nonprofit Donor And Supporter Dashboard For Fundraising Summary PDF for your personal presentations from our wonderful collection. A few clicks is all it takes to discover and get the most relevant and appropriate templates. Use our Templates to add a unique zing and appeal to your presentation and meetings. All the slides are easy to edit and you can use them even for advertisement purposes.

Comprehensive Customer Data Platform Guide Optimizing Promotional Initiatives Determine Skills Required For Customer Introduction PDF
The following slide depicts the skill gap assessment to understand the need and key requirements for easy execution of customer data platforms. It includes elements such as marketer, IT specialist, data analyst, customer insights, proficiency yo monitor dashboards etc. This Comprehensive Customer Data Platform Guide Optimizing Promotional Initiatives Determine Skills Required For Customer Introduction PDF from Slidegeeks makes it easy to present information on your topic with precision. It provides customization options, so you can make changes to the colors, design, graphics, or any other component to create a unique layout. It is also available for immediate download, so you can begin using it right away. Slidegeeks has done good research to ensure that you have everything you need to make your presentation stand out. Make a name out there for a brilliant performance.

Strategies For Acquiring Online And Offline Clients Acquisition Campaign Performance Analysis Dashboard Elements PDF
This slide covers the client acquisition budget chart for allocating the required resources to a specific channel. It includes marketing channels such as SEO, PPC, social media marketing, event sponsorships, offline marketing, display, and remarketing ads. Want to ace your presentation in front of a live audience. Our Strategies For Acquiring Online And Offline Clients Acquisition Channel Budget Allocation Plan Infographics PDF can help you do that by engaging all the users towards you.. Slidegeeks experts have put their efforts and expertise into creating these impeccable powerpoint presentations so that you can communicate your ideas clearly. Moreover, all the templates are customizable, and easy-to-edit and downloadable. Use these for both personal and commercial use.

Development And Operations KPI Dashboard IT Ppt PowerPoint Presentation Complete With Slides
Induce strategic thinking by presenting this complete deck. Enthrall your audience by deploying this thought provoking PPT deck. It can be downloaded in both standard and widescreen aspect ratios, thus making it a complete package to use and deploy. Convey your thoughts and actions using the twenty two slides presented in this complete deck. Additionally, feel free to alter its components like color, graphics, design, etc, to create a great first impression. Grab it now by clicking on the download button below.

NPS Reports And Dashboard Ppt PowerPoint Presentation Complete Deck With Slides
This complete presentation has PPT slides on wide range of topics highlighting the core areas of your business needs. It has professionally designed templates with relevant visuals and subject driven content. This presentation deck has total of sixteen slides. Get access to the customizable templates. Our designers have created editable templates for your convenience. You can edit the colour, text and font size as per your need. You can add or delete the content if required. You are just a click to away to have this ready made presentation. Click the download button now.

Online Ads Strategic Plan For Effective Marketing Email Promotion Campaign Dashboard For Performance Background PDF
This slide represents website promotion dashboard. It covers total visits, average session duration, bounce rate, page views etc. Create an editable Online Ads Strategic Plan For Effective Marketing Email Marketing Software Solutions For Brand Promotion Guidelines PDF that communicates your idea and engages your audience. Whether youre presenting a business or an educational presentation, pre designed presentation templates help save time. Online Ads Strategic Plan For Effective Marketing Email Marketing Software Solutions For Brand Promotion Guidelines PDF is highly customizable and very easy to edit, covering many different styles from creative to business presentations. Slidegeeks has creative team members who have crafted amazing templates. So, go and get them without any delay.

Data Center Cost Estimate With Cluster Cost And Host Cost Slides PDF
This slide shows the dashboard reflecting the cost associated with smooth running of data center operations. It also provides information about object names, type, quantity, unit price and total cost. Pitch your topic with ease and precision using this data center cost estimate with cluster cost and host cost slides pdf. This layout presents information on data center cost estimate with cluster cost and host cost. It is also available for immediate download and adjustment. So, changes can be made in the color, design, graphics or any other component to create a unique layout.

Dashboard For Impact Of Hyper Automation And RPA On Healthcare Industry Diagrams PDF
Purpose of the following slide is to provide an overview of RPA and Hyper automation impact on healthcare industry as it displays essential KPIs such as process speed, employee engagement and reduction in human error etc. Presenting this PowerPoint presentation, titled ashboard For Impact Of Hyper Automation And RPA On Healthcare Industry Diagrams PDF, with topics curated by our researchers after extensive research. This editable presentation is available for immediate download and provides attractive features when used. Download now and captivate your audience. Presenting this ashboard For Impact Of Hyper Automation And RPA On Healthcare Industry Diagrams PDF. Our researchers have carefully researched and created these slides with all aspects taken into consideration. This is a completely customizable ashboard For Impact Of Hyper Automation And RPA On Healthcare Industry Diagrams PDF that is available for immediate downloading. Download now and make an impact on your audience. Highlight the attractive features available with our PPTs.

Net Promoter Score Dashboard Ppt PowerPoint Presentation Complete Deck With Slides
This complete deck acts as a great communication tool. It helps you in conveying your business message with personalized sets of graphics, icons etc. Comprising a set of ninteen slides, this complete deck can help you persuade your audience. It also induces strategic thinking as it has been thoroughly researched and put together by our experts. Not only is it easily downloadable but also editable. The color, graphics, theme any component can be altered to fit your individual needs. So grab it now.

Customer Relationship Management Dashboard Ppt PowerPoint Presentation Complete Deck With Slides
This complete deck acts as a great communication tool. It helps you in conveying your business message with personalized sets of graphics, icons etc. Comprising a set of fourtynine slides, this complete deck can help you persuade your audience. It also induces strategic thinking as it has been thoroughly researched and put together by our experts. Not only is it easily downloadable but also editable. The color, graphics, theme any component can be altered to fit your individual needs. So grab it now.

Key Features To Implement Data Analytics Software Business Analysis Modification Toolkit Icons PDF
This slide shows broad range of data analytics features that help businesses to draw data driven decision. It includes features such as collaboration, data cleaning, data governance and many more.This is a Key Features To Implement Data Analytics Software Business Analysis Modification Toolkit Icons PDF template with various stages. Focus and dispense information on seven stages using this creative set, that comes with editable features. It contains large content boxes to add your information on topics like Dashboards, Versatility, Flexible Data. You can also showcase facts, figures, and other relevant content using this PPT layout. Grab it now.

Data Processing Services Delivery Checklist To Align Business Service Delivery With Kpis Designs PDF
This slide define the checklists and guidelines to align business service delivery with KPIs and it includes defining KPIs, KPI discussion, IT culture development and integration of KPIs to consolidated dashboards. This is a Data Processing Services Delivery Checklist To Align Business Service Delivery With Kpis Designs PDF template with various stages. Focus and dispense information on six stages using this creative set, that comes with editable features. It contains large content boxes to add your information on topics like Define KPIs, KPI Discussions, Develop IT Culture. You can also showcase facts, figures, and other relevant content using this PPT layout. Grab it now.

BI System To Enhance Processes For Data Warehouse Management Ppt Professional Icon PDF
This slide shows the business intelligence architecture. It provides information such as enterprise data warehouse, data sources, analytics and user accessibility with tools, dashboards, reports and information delivery. Presenting BI System To Enhance Processes For Data Warehouse Management Ppt Professional Icon PDF to dispense important information. This template comprises four stages. It also presents valuable insights into the topics including Data Sources, Enterprise Data Warehouse, Extract Transform Load. This is a completely customizable PowerPoint theme that can be put to use immediately. So, download it and address the topic impactfully.

Executing Advance Data Analytics At Workspace Addressing Cyber Risk Guidelines PDF
This slide portrays information regarding the dashboard that firm will use to manage cyber risks. The dashboard will provide clear picture of risk prevailing and how they are treated to technical engineers and board level executives.Deliver an awe inspiring pitch with this creative executing advance data analytics at workspace addressing cyber risk guidelines pdf bundle. Topics like addressing cyber risk management dashboard can be discussed with this completely editable template. It is available for immediate download depending on the needs and requirements of the user.

Utilizing Agile Methodology In Data Transformation Project IT Project Risk Management KPI Infographics PDF
This slide displays project risk management dashboard with KPIS namely risks, assumptions, issues, dependencies, actions and repairs. Deliver and pitch your topic in the best possible manner with this utilizing agile methodology in data transformation project it project risk management kpi infographics pdf. Use them to share invaluable insights on project risk management kpi dashboard and impress your audience. This template can be altered and modified as per your expectations. So, grab it now.
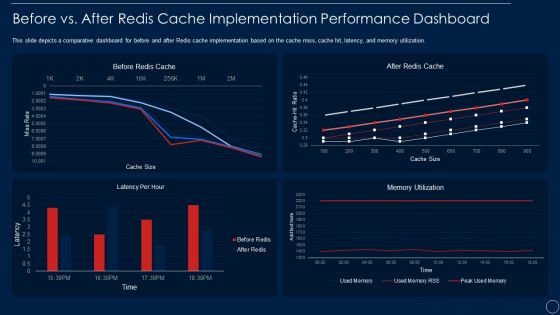
Redis Cache Data Structure IT Before Vs After Redis Cache Portrait PDF
This slide depicts a comparative dashboard for before and after Redis cache implementation based on the cache miss, cache hit, latency, and memory utilization. Deliver an awe inspiring pitch with this creative redis cache data structure it before vs after redis cache portrait pdf bundle. Topics like before vs after redis cache implementation performance dashboard can be discussed with this completely editable template. It is available for immediate download depending on the needs and requirements of the user.
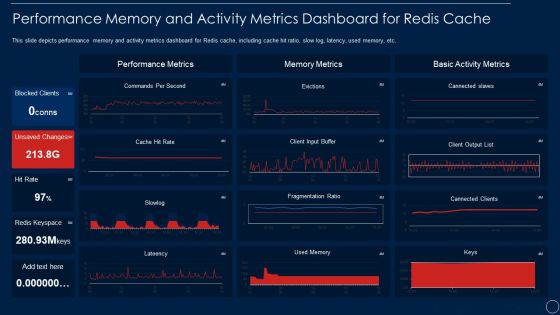
Redis Cache Data Structure IT Performance Memory And Activity Metrics Introduction PDF
This slide depicts performance memory and activity metrics dashboard for Redis cache, including cache hit ratio, slow log, latency, used memory, etc. This is a redis cache data structure it performance memory and activity metrics introduction pdf template with various stages. Focus and dispense information on one stages using this creative set, that comes with editable features. It contains large content boxes to add your information on topics like performance memory and activity metrics dashboard for redis cache. You can also showcase facts, figures, and other relevant content using this PPT layout. Grab it now.

Business Diagram Sample Advantages Benefits Of Big Data Analysis And Modelling Ppt Slide
Explain the concept of sample advantages and benefits of big data analysis with this unique diagram. This slide contains the graphic of data icons. Use this slide to present data analysis and modeling related topics in any presentation.

Data Analysis Reports Under Magnifying Glass Ppt PowerPoint Presentation Icon Graphic Tips
Presenting this set of slides with name data analysis reports under magnifying glass ppt powerpoint presentation icon graphic tips. This is a three stage process. The stages in this process are data visualization icon, research analysis, business focus. This is a completely editable PowerPoint presentation and is available for immediate download. Download now and impress your audience.

Information Transformation Process Toolkit Key Checklist For Data Analytics Program Template PDF
This diagram illustrates the Stream Analytics pipeline, showing how data is ingested, analyzed, and then sent for presentation or action. Deliver an awe inspiring pitch with this creative Information Transformation Process Toolkit Key Checklist For Data Analytics Program Template PDF bundle. Topics like Batch Analytics, Term Storage, Dashboard can be discussed with this completely editable template. It is available for immediate download depending on the needs and requirements of the user.
Executing Advance Data Analytics At Workspace Tracking Intelligence Infrastructure Elements PDF
This slide portrays information regarding tracking essential activities in intelligence infrastructure dashboard in terms of IT operations, security, business analytics, internet of things, etc. Deliver an awe inspiring pitch with this creative executing advance data analytics at workspace tracking intelligence infrastructure elements pdf bundle. Topics like leveraging potential technologies beneficial to firm can be discussed with this completely editable template. It is available for immediate download depending on the needs and requirements of the user.
Pie Chart For Data Presentation Vector Ppt PowerPoint Presentation Summary Files
Presenting this set of slides with name pie chart for data presentation vector ppt powerpoint presentation summary files. The topics discussed in these slides are data visualization icon, research analysis, business focus. This is a completely editable PowerPoint presentation and is available for immediate download. Download now and impress your audience.

Budget Plan For BI Technique For Data Informed Decisions Clipart PDF
The purpose of this slide to tabulates the budget plan for SAP Analytics installation. It provides details regarding multiple hardware software components, units required, unit and total prices. Explore a selection of the finest Sap Analytics Cloud Dashboard For Income Analysis And Forecasting Formats PDF here. With a plethora of professionally designed and pre made slide templates, you can quickly and easily find the right one for your upcoming presentation. You can use our Sap Analytics Cloud Dashboard For Income Analysis And Forecasting Formats PDF to effectively convey your message to a wider audience. Slidegeeks has done a lot of research before preparing these presentation templates. The content can be personalized and the slides are highly editable. Grab templates today from Slidegeeks.

Eight Stages Of Pie Chart Data Interpretation Detailed Business Plan PowerPoint Templates
We present our eight stages of pie chart data interpretation detailed business plan PowerPoint templates.Download and present our Competition PowerPoint Templates because You can Stir your ideas in the cauldron of our PowerPoint Templates and Slides. Cast a magic spell on your audience. Download and present our Marketing PowerPoint Templates because You should Kick up a storm with our PowerPoint Templates and Slides. The heads of your listeners will swirl with your ideas. Download and present our Arrows PowerPoint Templates because Your ideas provide food for thought. Our PowerPoint Templates and Slides will help you create a dish to tickle the most discerning palate. Present our Circle Charts PowerPoint Templates because You can Stir your ideas in the cauldron of our PowerPoint Templates and Slides. Cast a magic spell on your audience. Download our Business PowerPoint Templates because You can Score a slam dunk with our PowerPoint Templates and Slides. Watch your audience hang onto your every word.Use these PowerPoint slides for presentations relating to chart, graph, pie, 3d, diagram, graphic, icon, control, business, data, profit, market, sales, display, corporate, concept, render, success, presentation, finance, report, marketing, accounting, management, piece, strategy, money, growth, company, competition, progress, account, sheet, part, information, investment, improvement, banking, index, financial, reflect, results, performance, exchange. The prominent colors used in the PowerPoint template are Blue, Black, Gray.

Data Processing Mainframe Structure Vector Icon Ppt PowerPoint Presentation Model Files PDF
Pitch your topic with ease and precision using this data processing mainframe structure vector icon ppt powerpoint presentation model files pdf. This layout presents information on data processing mainframe structure vector icon. It is also available for immediate download and adjustment. So, changes can be made in the color, design, graphics or any other component to create a unique layout.
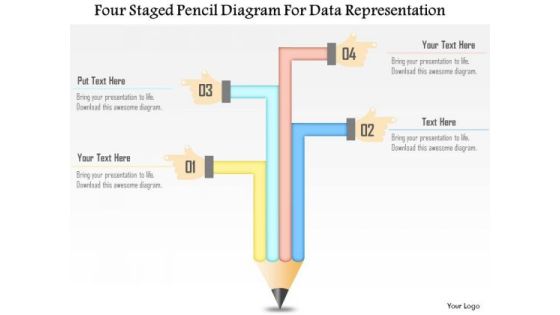
Business Diagram Four Staged Pencil Diagram For Data Representation Presentation Template
This business diagram has been designed with four staged pencil chart. This slide suitable for data representation. You can also use this slide to present four steps of any business process. Use this diagram to present your views in a wonderful manner.
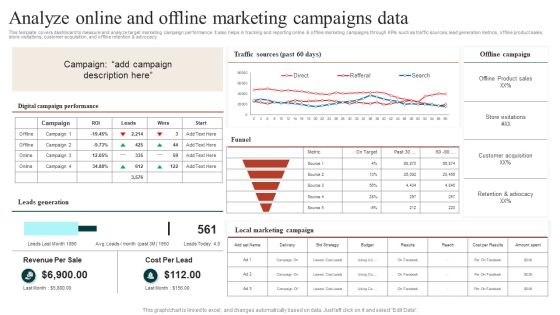
Target Marketing Techniques Analyze Online And Offline Marketing Campaigns Data Ideas PDF
This template covers dashboard to measure and analyze target marketing campaign performance. It also helps in tracking and reporting online and offline marketing campaigns through KPIs such as traffic sources, lead generation metrics, offline product sales, store visitations, customer acquisition, and offline retention and advocacy Find a pre designed and impeccable Target Marketing Techniques Evaluating Growth Rate For Target Marketing Slides PDF. The templates can ace your presentation without additional effort. You can download these easy to edit presentation templates to make your presentation stand out from others. So, what are you waiting for Download the template from Slidegeeks today and give a unique touch to your presentation.

Quantitative Data Analysis Icon For Predictive Modelling Ppt Ideas Images PDF
Presenting Quantitative Data Analysis Icon For Predictive Modelling Ppt Ideas Images PDF to dispense important information. This template comprises one stages. It also presents valuable insights into the topics including Quantitative Data, Analysis Icon, Predictive Modelling. This is a completely customizable PowerPoint theme that can be put to use immediately. So, download it and address the topic impactfully.

Data Maturity Framework Assessment Icon Ppt PowerPoint Presentation Icon Infographic Template PDF
Presenting Data Maturity Framework Assessment Icon Ppt PowerPoint Presentation Icon Infographic Template PDF to dispense important information. This template comprises one stages. It also presents valuable insights into the topics including Data Maturity Framework, Assessment Icon. This is a completely customizable PowerPoint theme that can be put to use immediately. So, download it and address the topic impactfully.
File Transfer Data Management Vector Icon Ppt PowerPoint Presentation File Graphic Images
Presenting this set of slides with name file transfer data management vector icon ppt powerpoint presentation file graphic images. The topics discussed in these slides are data sources, database management, marketing. This is a completely editable PowerPoint presentation and is available for immediate download. Download now and impress your audience.
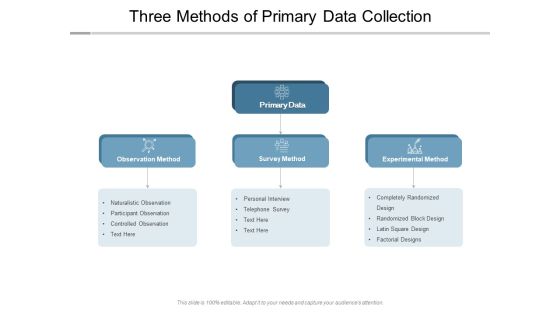
Three Methods Of Primary Data Collection Ppt PowerPoint Presentation Infographics Graphics Design
Presenting this set of slides with name three methods of primary data collection ppt powerpoint presentation infographics graphics design. The topics discussed in these slides are data sources, database management, marketing. This is a completely editable PowerPoint presentation and is available for immediate download. Download now and impress your audience.

Business Diagram 3d Pie Chart With Arrows For Data Representation PowerPoint Slide
This business slide displays pie chart with timeline graphics. This diagram has been designed with graphic of with four arrows representing yearly data. Use this diagram, in your presentations to display process steps, stages, for business management.

Defining Generic Target Marketing Techniques Analyze Online And Offline Marketing Campaigns Data Topics PDF
This template covers dashboard to measure and analyze target marketing campaign performance. It also helps in tracking and reporting online and offline marketing campaigns through KPIs such as traffic sources, lead generation metrics, offline product sales, store visitations, customer acquisition, and offline retention and advocacy. Create an editable Defining Generic Target Marketing Techniques Analyze Online And Offline Marketing Campaigns Data Topics PDF that communicates your idea and engages your audience. Whether you are presenting a business or an educational presentation, pre designed presentation templates help save time. Defining Generic Target Marketing Techniques Analyze Online And Offline Marketing Campaigns Data Topics PDF is highly customizable and very easy to edit, covering many different styles from creative to business presentations. Slidegeeks has creative team members who have crafted amazing templates. So, go and get them without any delay.
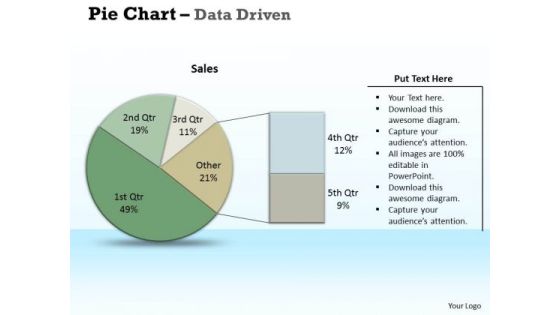
Examples Of Data Analysis Market Driven Pie Chart Research PowerPoint Slides Templates
Chalk It Up With Our examples of data analysis market driven pie chart research powerpoint slides Templates . Add To The Credits Of Your Ideas.

Data Analysis In Excel Column Chart For Business Analytics PowerPoint Templates
Our data analysis in excel column chart for business analytics Powerpoint Templates Heighten Concentration. Your Audience Will Be On The Edge.
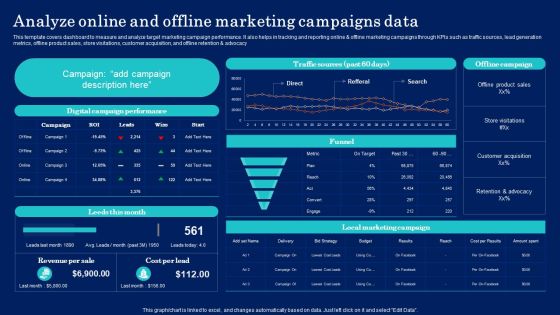
Why Target Market Identification Analyze Online And Offline Marketing Campaigns Data Topics PDF
This template covers dashboard to measure and analyze target marketing campaign performance. It also helps in tracking and reporting online and offline marketing campaigns through KPIs such as traffic sources, lead generation metrics, offline product sales, store visitations, customer acquisition, and offline retention and advocacy. Boost your pitch with our creative Why Target Market Identification Analyze Online And Offline Marketing Campaigns Data Topics PDF. Deliver an awe inspiring pitch that will mesmerize everyone. Using these presentation templates you will surely catch everyones attention. You can browse the ppts collection on our website. We have researchers who are experts at creating the right content for the templates. So you do not have to invest time in any additional work. Just grab the template now and use them.

Comprehensive Customer Data Platform Guide Optimizing Promotional Initiatives Email Campaign Performance Evaluation Information PDF
The following slide depicts email campaign performance dashboard to connect with audience and gather real time insights. It includes elements such as highest open rate, active customers, average engagement per customer, daily performance analysis etc. Take your projects to the next level with our ultimate collection of Comprehensive Customer Data Platform Guide Optimizing Promotional Initiatives Email Campaign Performance Evaluation Information PDF. Slidegeeks has designed a range of layouts that are perfect for representing task or activity duration, keeping track of all your deadlines at a glance. Tailor these designs to your exact needs and give them a truly corporate look with your own brand colors they will make your projects stand out from the rest.

Business Diagram Thumb Diagram With Five Stages For Data Representation PowerPoint Slide
This business diagram displays thumb up with five stages. This diagram contains text boxes for data representation. Use this diagram to display business process workflows in any presentations.

Business Diagram Two Tablets With Growth Bar Graph Data Driven PowerPoint Slide
This business diagram has been designed with comparative charts on tablets. This slide suitable for data representation. You can also use this slide to present business reports and information. Use this diagram to present your views in a wonderful manner.
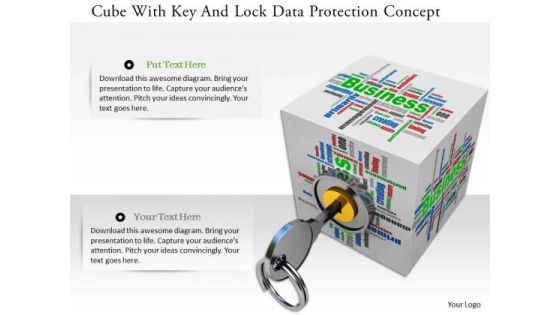
Stock Photo Cube With Key And Lock Data Protection Concept PowerPoint Slide
Graphic of cube with lock and key has been used to design this power point image template. This image template contains the concept of data protection. This image template can e used for data related presentations.
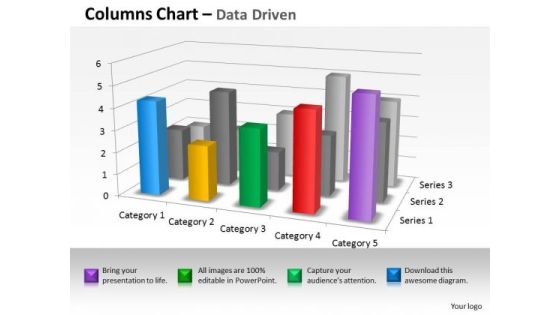
Quantitative Data Analysis 3d Interpretation Of Statistical Quality Control PowerPoint Templates
Land The Idea With Our quantitative data analysis 3d interpretation of statistical quality control Powerpoint Templates . Help It Grow With Your Thoughts.
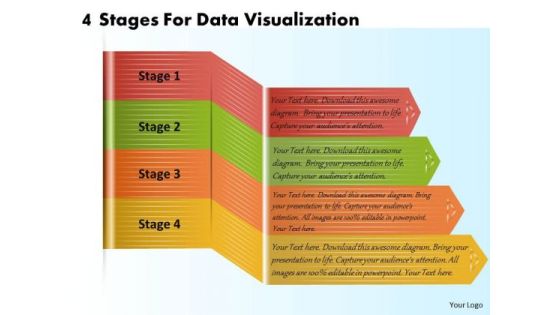
Business Plan And Strategy 4 Stages For Data Visualization Strategic Planning Template Ppt Slide
Your Listeners Will Never Doodle. Our business plan and strategy 4 stages for data visualization strategic planning template ppt slide Powerpoint Templates Will Hold Their Concentration. Do The One Thing With Your Thoughts. Uphold Custom With Our Process and Flows Powerpoint Templates.

Data Analysis Template Driven Stock Chart For Market Trends PowerPoint Slides Templates
Drive Your Team Along The Road To Success. Take The Wheel With Our data analysis template driven stock chart for market trends powerpoint slides Templates .

Examples Of Data Analysis Market 3d Business Trend Series Chart PowerPoint Templates
Duct It Through With Our examples of data analysis market 3d business trend series chart Powerpoint Templates . Your Ideas Will Reach Into Their Minds Intact.
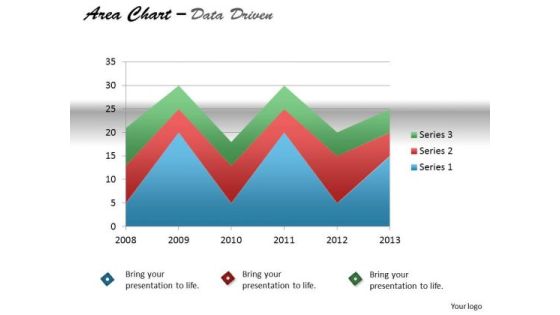
Quantitative Data Analysis Driven Display Series With Area Chart PowerPoint Slides Templates
Our quantitative data analysis driven display series with area chart powerpoint slides Templates Enjoy Drama. They Provide Entertaining Backdrops.

Business Diagram 3d Colorful Pie Graph With Magnifier Data Search PowerPoint Slide
This business slide displays 3d colorful pie graph with magnifier. This diagram is a data visualization tool that gives you a simple way to present statistical information. This slide helps your audience examine and interpret the data you present.

Business Diagram Data Driven Pie Chart Inside The Magnifier PowerPoint Slide
This business slide displays 3d colorful pie graph with magnifier. This diagram is a data visualization tool that gives you a simple way to present statistical information. This slide helps your audience examine and interpret the data you present.

Examples Of Data Analysis Market 3d Business Intelligence And PowerPoint Templates
Our examples of data analysis market 3d business intelligence and Powerpoint Templates Are Dual Purpose. They Help Instruct And Inform At The Same Time.
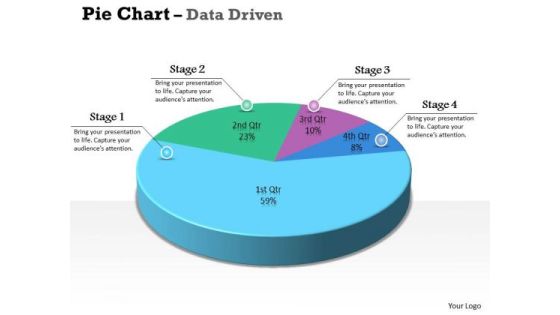
Data Analysis Excel 3d Pie Chart For Marketing Process PowerPoint Templates
Our data analysis excel 3d pie chart for marketing process Powerpoint Templates Team Are A Dogged Lot. They Keep At It Till They Get It Right.
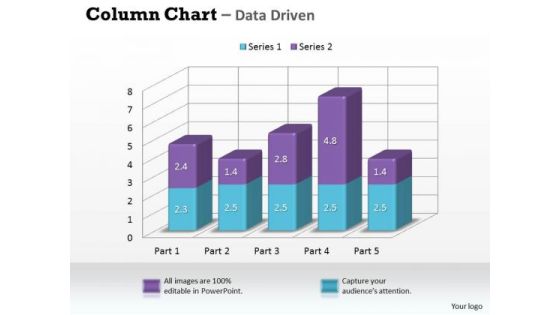
Data Analysis In Excel 3d Column Chart For Market Surveys PowerPoint Templates
Our data analysis in excel 3d column chart for market surveys Powerpoint Templates Leave No One In Doubt. Provide A Certainty To Your Views.

Data Analysis Programs 3d Bar Chart For Market Surveys PowerPoint Templates
Draw On The Experience Of Our data analysis programs 3d bar chart for market surveys Powerpoint Templates . They Imbibe From Past Masters.
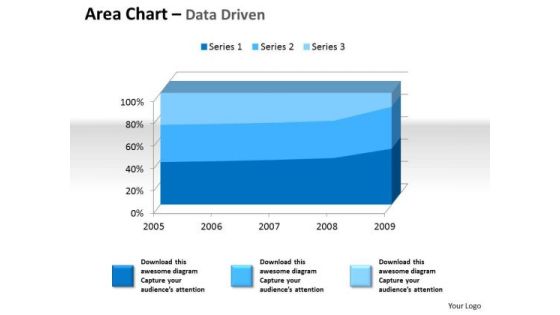
Examples Of Data Analysis Market 3d Area Chart For Quantiative PowerPoint Templates
Drum It Up With Our examples of data analysis market 3d area chart for quantiative Powerpoint Templates . Your Thoughts Will Raise The Tempo.
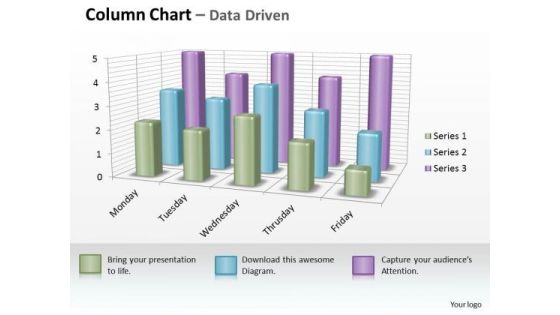
Examples Of Data Analysis Market 3d Business Inspection Procedure Chart PowerPoint Templates
However Dry Your Topic Maybe. Make It Catchy With Our examples of data analysis market 3d business inspection procedure chart Powerpoint Templates .
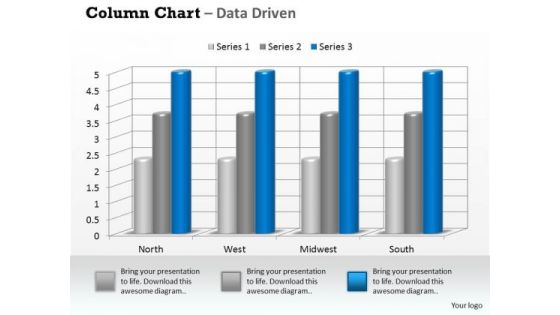
Examples Of Data Analysis Market 3d Business On Regular Intervals PowerPoint Templates
Drum It Out Loud And Clear On Our examples of data analysis market 3d business on regular intervals Powerpoint Templates . Your Words Will Ring In Their Ears.

Examples Of Data Analysis Market Driven Plotting The Business Values PowerPoint Slides Templates
Ring The Duck With Our examples of data analysis market driven plotting the business values powerpoint slides Templates . Acquire The Points With Your Ideas.

Examples Of Data Analysis Market Driven Radar Chart To Compare PowerPoint Slides Templates
Rely On Our examples of data analysis market driven radar chart to compare powerpoint slides Templates In Any Duel. They Will Drive Home Your Point.

Financial Data Analysis Driven Compare Market Share Of Brand PowerPoint Templates
Doll Up Your Thoughts With Our financial data analysis driven compare market share of brand Powerpoint Templates . They Will Make A Pretty Picture.
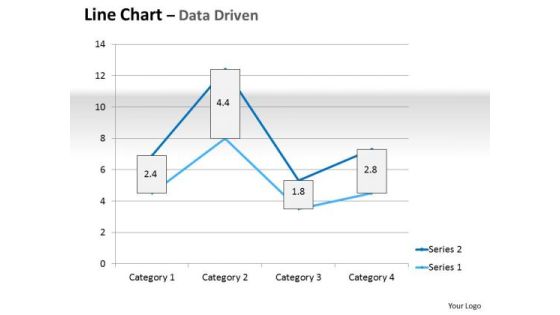
Multivariate Data Analysis Driven Line Chart Market Graph PowerPoint Slides Templates
Plan For All Contingencies With Our multivariate data analysis driven line chart market graph powerpoint slides Templates . Douse The Fire Before It Catches.

Decision Support System What Is Modern Data Warehouse Ppt Icon Outline PDF
This slide represents what a modern data warehouse is and how it supports SQL, machine learning, graphs, spatial processing, and analytical tools that help use data without transferring it. Presenting Decision Support System What Is Modern Data Warehouse Ppt Icon Outline PDF to provide visual cues and insights. Share and navigate important information on one stages that need your due attention. This template can be used to pitch topics like Data Warehouse, Analytics Data Mart, Reporting Tools. In addtion, this PPT design contains high resolution images, graphics, etc, that are easily editable and available for immediate download.

Data Quality Auditing And Threats Reporting Process Ppt Icon Picture PDF
This slide covers auditing process of data quality and reporting risk detected. It includes framework depicting checkpoints needed to audit data quality for data warehouse and business intelligence projects. Presenting Data Quality Auditing And Threats Reporting Process Ppt Icon Picture PDF to dispense important information. This template comprises one stages. It also presents valuable insights into the topics including External Data, Customer Data, Legacy Data. This is a completely customizable PowerPoint theme that can be put to use immediately. So, download it and address the topic impactfully.
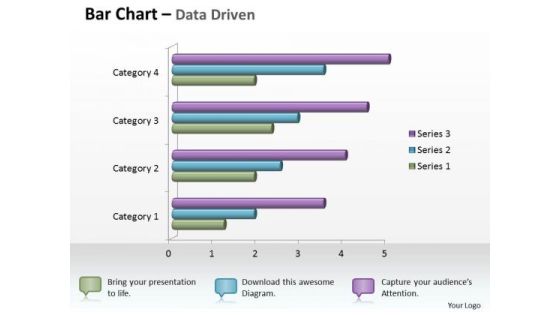
Data Analysis In Excel 3d Bar Chart For Business Statistics PowerPoint Templates
Knock On The Door To Success With Our data analysis in excel 3d bar chart for business statistics Powerpoint Templates . Be Assured Of Gaining Entry.
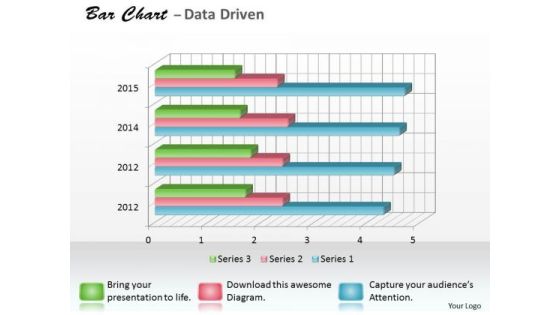
Data Analysis Programs 3d Bar Chart For Research In Statistics PowerPoint Templates
Draw It Out On Our data analysis programs 3d bar chart for research in statistics Powerpoint Templates . Provide Inspiration To Your Colleagues.
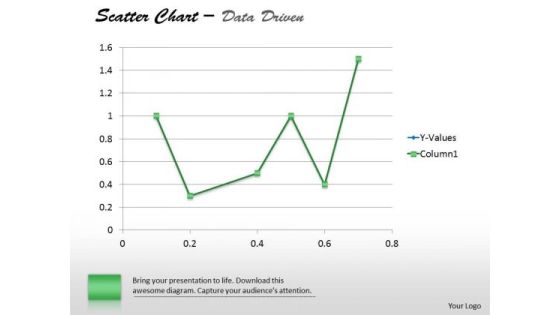
Financial Data Analysis Driven Demonstrate Statistics With Scatter Chart PowerPoint Slides Templates
Establish The Dominance Of Your Ideas. Our financial data analysis driven demonstrate statistics with scatter chart powerpoint slides Templates Will Put Them On Top.
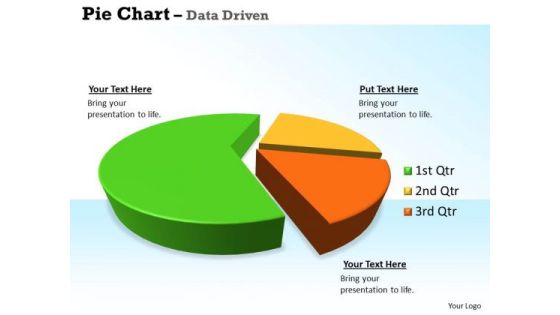
Quantitative Data Analysis 3d Pie Chart For Business Statistics PowerPoint Templates
Our quantitative data analysis 3d pie chart for business statistics Powerpoint Templates Allow You To Do It With Ease. Just Like Picking The Low Hanging Fruit.
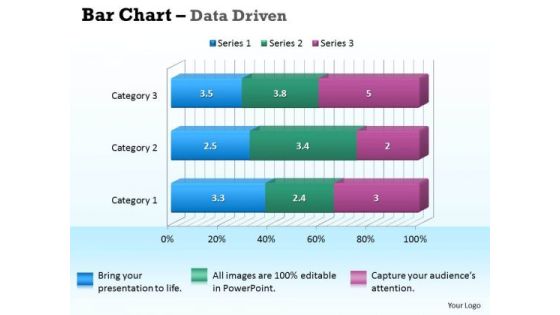
Data Analysis In Excel 3d Bar Chart For Business Information PowerPoint Templates
Our data analysis in excel 3d bar chart for business information Powerpoint Templates Deliver At Your Doorstep. Let Them In For A Wonderful Experience.

Data Analysis In Excel 3d Column Chart For Sets Of Information PowerPoint Templates
Double The Impact With Our data analysis in excel 3d column chart for sets of information Powerpoint Templates . Your Thoughts Will Have An Imposing Effect.
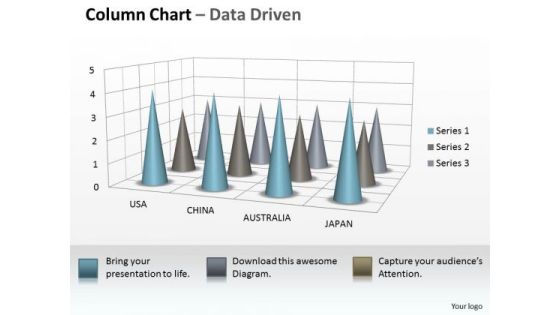
Data Analysis On Excel 3d Chart To Incorporate Business Information PowerPoint Templates
Our data analysis on excel 3d chart to incorporate business information Powerpoint Templates Allow You To Do It With Ease. Just Like Picking The Low Hanging Fruit.

Data Analysis On Excel Driven Sets Of Business Information PowerPoint Slides Templates
Break The Deadlock With Our data analysis on excel driven sets of business information powerpoint slides Templates . Let The Words Start To Flow.
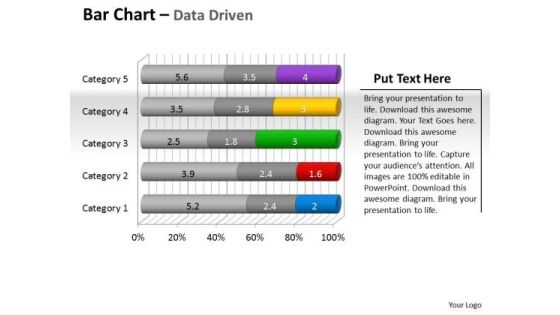
Data Analysis Programs 3d Bar Chart To Put Information PowerPoint Templates
Draw Up Your Agenda On Our data analysis programs 3d bar chart to put information Powerpoint Templates . Coax Your Audience Into Acceptance.
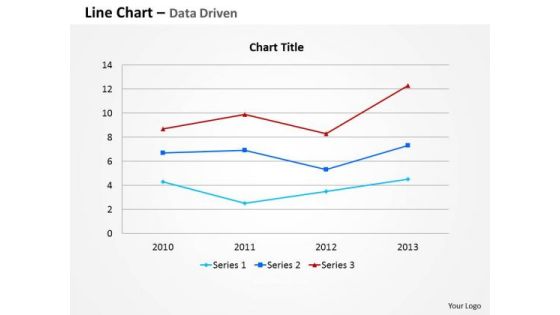
Data Analysis Template Driven Line Chart For Business Information PowerPoint Slides Templates
Your Thoughts Are Dripping With Wisdom. Lace It With Our data analysis template driven line chart for business information powerpoint slides Templates .
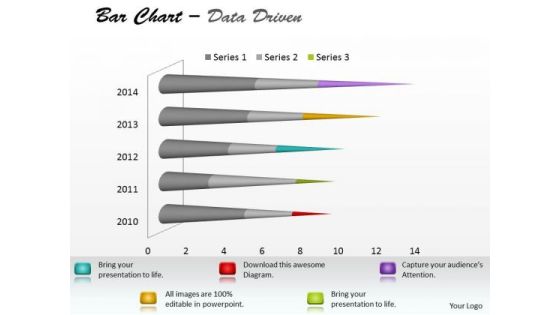
Microsoft Excel Data Analysis Bar Chart To Communicate Information PowerPoint Templates
With Our microsoft excel data analysis bar chart to communicate information Powerpoint Templates You Will Be Doubly Sure. They Possess That Stamp Of Authority.
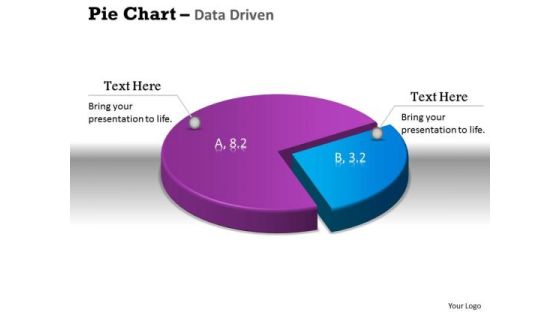
Data Analysis Excel 3d Pie Chart Shows Relative Size Of PowerPoint Templates
Get The Doers Into Action. Activate Them With Our data analysis excel 3d pie chart shows relative size of Powerpoint Templates.

Data Analysis Excel Driven Percentage Breakdown Pie Chart PowerPoint Slides Templates
Be A Donor Of Great Ideas. Display Your Charity On Our data analysis excel driven percentage breakdown pie chart powerpoint slides Templates.

Data Analysis Excel Driven Pie Chart For Business Stratregy PowerPoint Slides Templates
Open Up Doors That Lead To Success. Our data analysis excel driven pie chart for business stratregy powerpoint slides Templates Provide The Handles.
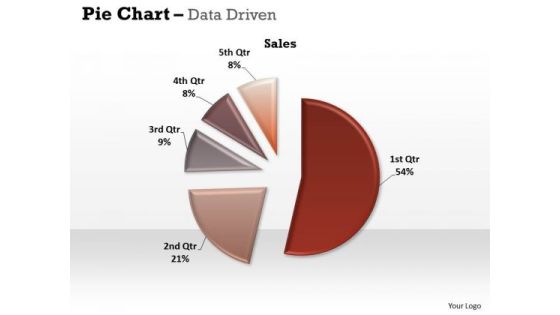
Data Analysis Excel Driven Pie Chart For Easy Comparison PowerPoint Slides Templates
Our data analysis excel driven pie chart for easy comparison powerpoint slides Templates Abhor Doodling. They Never Let The Interest Flag.
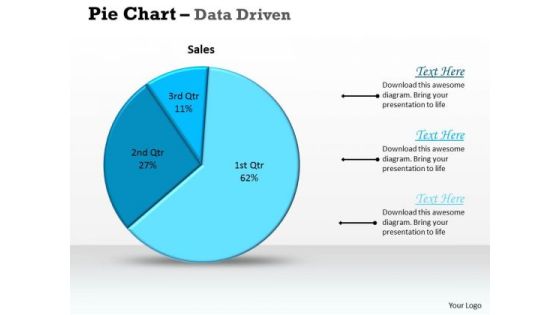
Data Analysis Excel Driven Pie Chart For Sales Process PowerPoint Slides Templates
Deliver The Right Dose With Our data analysis excel driven pie chart for sales process powerpoint slides Templates . Your Ideas Will Get The Correct Illumination.

Data Analysis In Excel 3d Bar Chart For Business Trends PowerPoint Templates
Connect The Dots With Our data analysis in excel 3d bar chart for business trends Powerpoint Templates . Watch The Whole Picture Clearly Emerge.

Data Analysis In Excel 3d Bar Chart For Comparison Of Time Series PowerPoint Templates
Double Your Chances With Our data analysis in excel 3d bar chart for comparison of time series Powerpoint Templates . The Value Of Your Thoughts Will Increase Two-Fold.
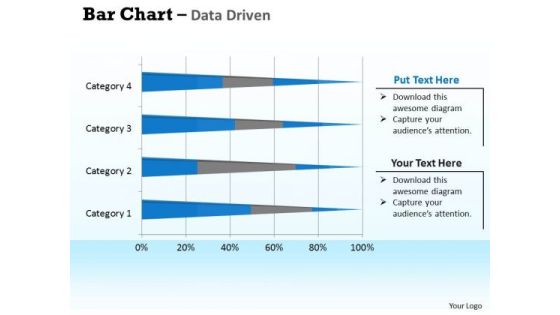
Data Analysis In Excel 3d Bar Chart For Interpretation PowerPoint Templates
Double Up Our data analysis in excel 3d bar chart for interpretation Powerpoint Templates With Your Thoughts. They Will Make An Awesome Pair.
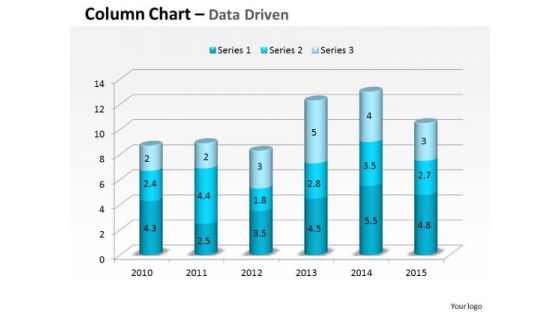
Data Analysis In Excel 3d Compare Yearly Business Performance PowerPoint Templates
Plan For All Contingencies With Our data analysis in excel 3d compare yearly business performance Powerpoint Templates . Douse The Fire Before It Catches.
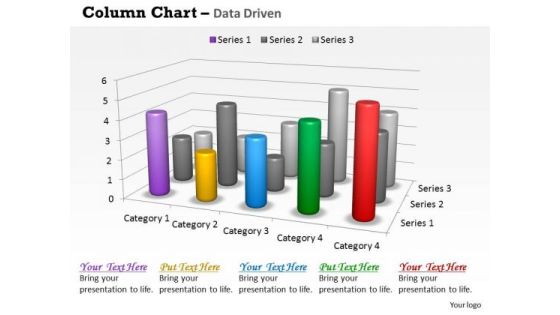
Data Analysis In Excel 3d Survey For Sales Chart PowerPoint Templates
Good Camaraderie Is A Key To Teamwork. Our data analysis in excel 3d survey for sales chart Powerpoint Templates Can Be A Cementing Force.
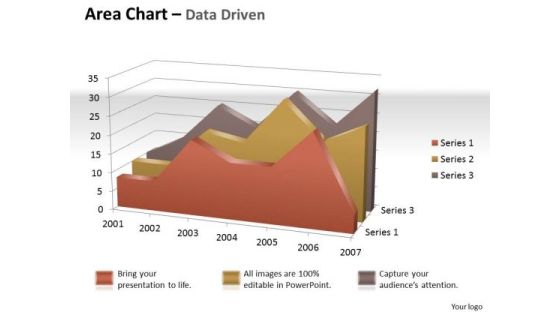
Data Analysis In Excel 3d Visual Display Of Area Chart PowerPoint Templates
Brace Yourself, Arm Your Thoughts. Prepare For The Hustle With Our data analysis in excel 3d visual display of area chart Powerpoint Templates .

Data Analysis In Excel Area Chart For Business Process PowerPoint Templates
Your Grasp Of Economics Is Well Known. Help Your Audience Comprehend Issues With Our data analysis in excel area chart for business process Powerpoint Templates .

Data Analysis In Excel Column Chart For Business Project PowerPoint Templates
Edit Your Work With Our data analysis in excel column chart for business project Powerpoint Templates . They Will Help You Give The Final Form.

Data Analysis In Excel Column Chart Of Various Fields PowerPoint Templates
Land The Idea With Our data analysis in excel column chart of various fields Powerpoint Templates . Help It Grow With Your Thoughts.

Data Analysis On Excel 3d Chart To Monitor Business Process PowerPoint Templates
Make Some Dough With Our data analysis on excel 3d chart to monitor business process Powerpoint Templates . Your Assets Will Rise Significantly.
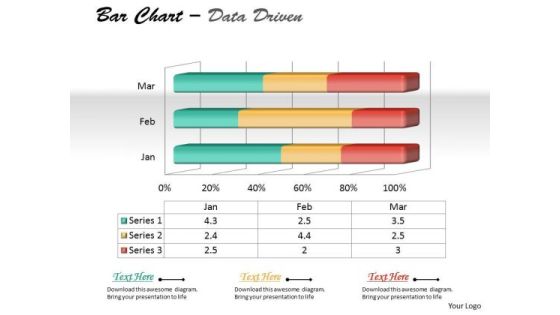
Data Analysis On Excel 3d Chart To Represent Quantitative Differences PowerPoint Templates
Draft It Out On Our data analysis on excel 3d chart to represent quantitative differences Powerpoint Templates . Give The Final Touches With Your Ideas.

Data Analysis On Excel 3d Chart With Sets Of PowerPoint Templates
Reduce The Drag With Our data analysis on excel 3d chart with sets of Powerpoint Templates . Give More Lift To Your Thoughts.
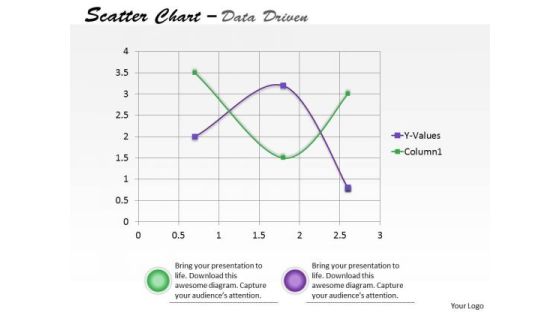
Data Analysis On Excel Driven Scatter Chart To Predict Future Movements PowerPoint Slides Templates
Our data analysis on excel driven scatter chart to predict future movements powerpoint slides Templates Enjoy Drama. They Provide Entertaining Backdrops.

Data Analysis On Excel Driven Stacked Area Chart PowerPoint Slides Templates
Be The Dramatist With Our data analysis on excel driven stacked area chart powerpoint slides Templates . Script Out The Play Of Words.

Data Analysis On Excel Driven Stock Chart For Business Growth PowerPoint Slides Templates
Add Some Dramatization To Your Thoughts. Our data analysis on excel driven stock chart for business growth powerpoint slides Templates Make Useful Props.
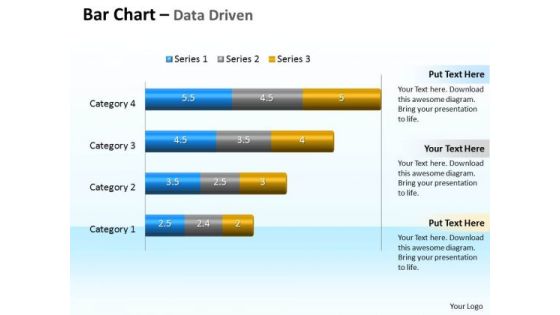
Data Analysis Programs 3d Bar Chart To Compare Categories PowerPoint Templates
Discover Decisive Moments With Our data analysis programs 3d bar chart to compare categories Powerpoint Templates . They Help Make That Crucial Difference.
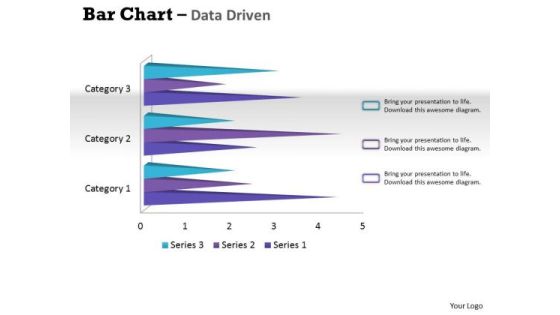
Data Analysis Techniques 3d Bar Chart For Financial Solutions PowerPoint Templates
Make Your Dreams A Reality With Our data analysis techniques 3d bar chart for financial solutions Powerpoint Templates . Your Ideas Will Begin To Take Shape.
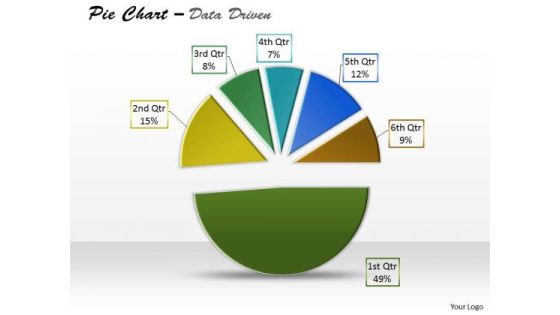
Data Analysis Template Driven Express Business Facts Pie Chart PowerPoint Slides Templates
Display Your Drive On Our data analysis template driven express business facts pie chart powerpoint slides Templates . Invigorate The Audience With Your Fervor.

Data Analysis Template Driven Ineract With Stock Chart PowerPoint Slides Templates
Drive Your Passion With Our data analysis template driven ineract with stock chart powerpoint slides Templates . Steer Yourself To Achieve Your Aims.

Data Analysis Template Driven Line Chart Business Graph PowerPoint Slides Templates
Bottle Your Thoughts In Our data analysis template driven line chart business graph powerpoint slides Templates . Pass It Around For Your Audience To Sip.
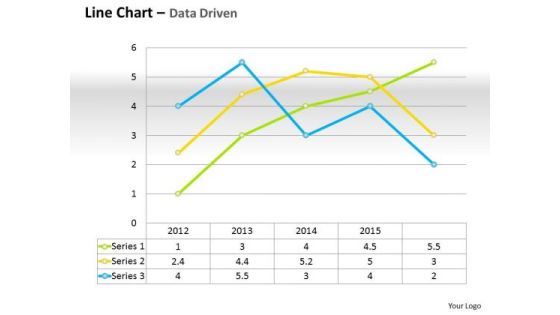
Data Analysis Template Driven Line Chart For Business Performance PowerPoint Slides Templates
Do Not Allow Things To Drift. Ring In Changes With Our data analysis template driven line chart for business performance powerpoint slides Templates .
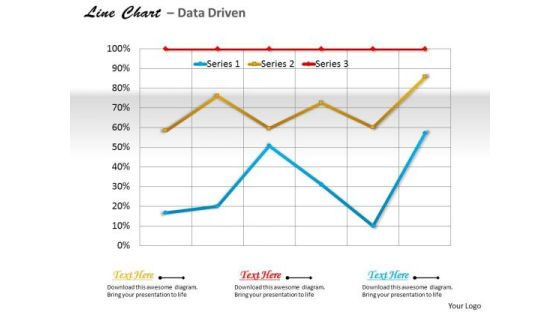
Data Analysis Template Driven Line Chart For Business Trends PowerPoint Slides Templates
Use Our data analysis template driven line chart for business trends powerpoint slides Templates As The Bit. Drill Your Thoughts Into Their Minds.
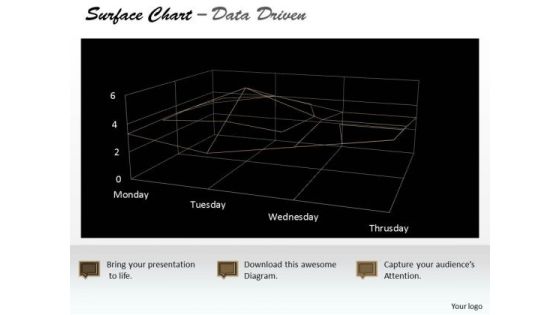
Data Analysis Template Driven Surface Chart Indicating Areas PowerPoint Slides Templates
Highlight Your Drive With Our data analysis template driven surface chart indicating areas powerpoint slides Templates . Prove The Fact That You Have Control.
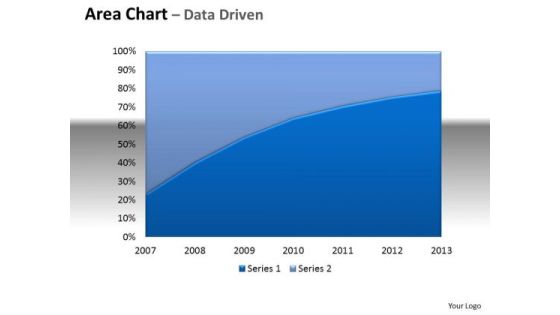
Financial Data Analysis Area Chart With Plotted Line Center PowerPoint Templates
Be The Doer With Our financial data analysis area chart with plotted line center Powerpoint Templates . Put Your Thoughts Into Practice.
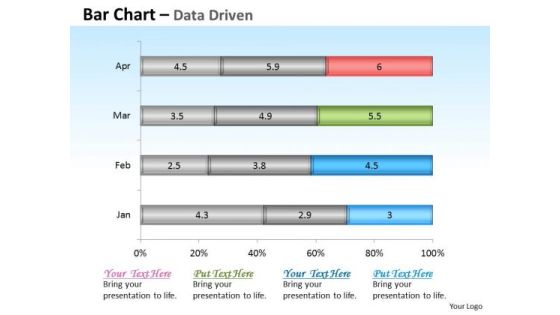
Financial Data Analysis Driven Base Bar Chart Design PowerPoint Slides Templates
Get The Domestics Right With Our financial data analysis driven base bar chart design powerpoint slides Templates . Create The Base For Thoughts To Grow.
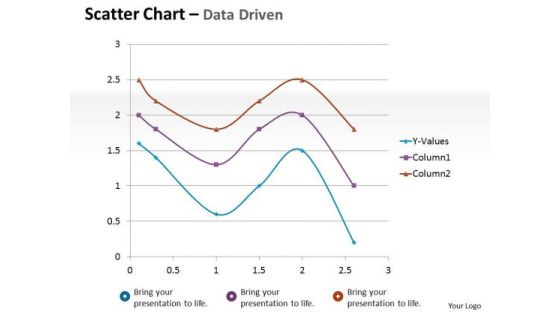
Financial Data Analysis Driven Scatter Chart Mathematical Diagram PowerPoint Slides Templates
Dominate Proceedings With Your Ideas. Our financial data analysis driven scatter chart mathematical diagram powerpoint slides Templates Will Empower Your Thoughts.
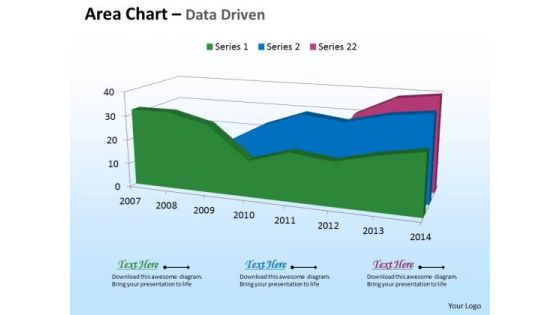
Microsoft Excel Data Analysis 3d Area Chart For Time Based PowerPoint Templates
Deliver The Right Dose With Our microsoft excel data analysis 3d area chart for time based Powerpoint Templates . Your Ideas Will Get The Correct Illumination.
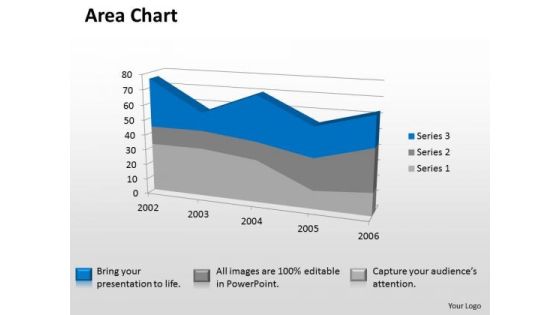
Microsoft Excel Data Analysis 3d Area Chart Showimg Change In Values PowerPoint Templates
Our microsoft excel data analysis 3d area chart showimg change in values Powerpoint Templates Deliver At Your Doorstep. Let Them In For A Wonderful Experience.
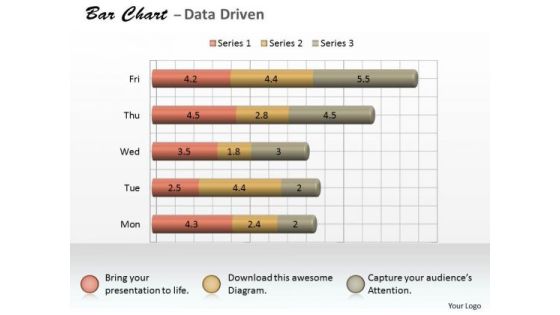
Microsoft Excel Data Analysis 3d Bar Chart As Research Tool PowerPoint Templates
Knock On The Door To Success With Our microsoft excel data analysis 3d bar chart as research tool Powerpoint Templates . Be Assured Of Gaining Entry.
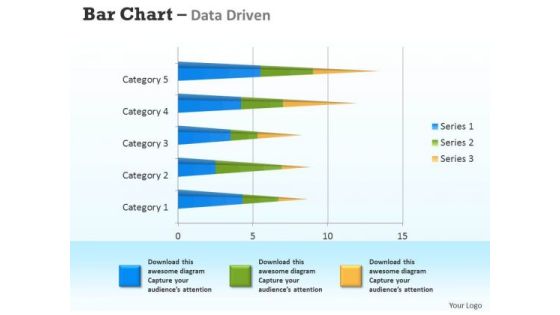
Microsoft Excel Data Analysis 3d Bar Chart For Analyzing Survey PowerPoint Templates
Connect The Dots With Our microsoft excel data analysis 3d bar chart for analyzing survey Powerpoint Templates . Watch The Whole Picture Clearly Emerge.

Microsoft Excel Data Analysis 3d Change In Business Process Chart PowerPoint Templates
Double Your Chances With Our microsoft excel data analysis 3d change in business process chart Powerpoint Templates . The Value Of Your Thoughts Will Increase Two-Fold.

Microsoft Excel Data Analysis 3d Chart For Business Observation PowerPoint Templates
Double Up Our microsoft excel data analysis 3d chart for business observation Powerpoint Templates With Your Thoughts. They Will Make An Awesome Pair.

Microsoft Excel Data Analysis Bar Chart To Compare Quantities PowerPoint Templates
Our microsoft excel data analysis bar chart to compare quantities Powerpoint Templates Leave No One In Doubt. Provide A Certainty To Your Views.
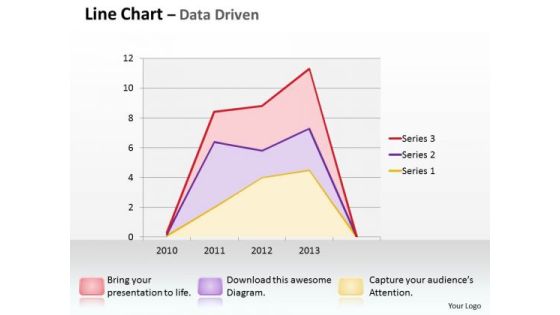
Multivariate Data Analysis Driven Line Chart Shows Revenue Trends PowerPoint Slides Templates
Good Camaraderie Is A Key To Teamwork. Our multivariate data analysis driven line chart shows revenue trends powerpoint slides Templates Can Be A Cementing Force.
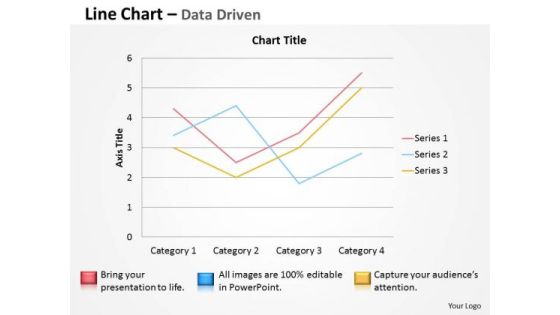
Multivariate Data Analysis Driven Line Chart To Demonstrate PowerPoint Slides Templates
Brace Yourself, Arm Your Thoughts. Prepare For The Hustle With Our multivariate data analysis driven line chart to demonstrate powerpoint slides Templates .
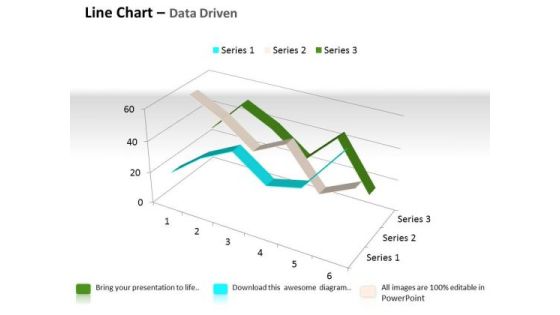
Quantitative Data Analysis 3d Line Chart For Comparison Of PowerPoint Templates
Touch Base With Our quantitative data analysis 3d line chart for comparison of Powerpoint Templates . Review Your Growth With Your Audience.

Quantitative Data Analysis 3d Pie Chart For Business Process PowerPoint Templates
Put Them On The Same Page With Our quantitative data analysis 3d pie chart for business process Powerpoint Templates . Your Team Will Sing From The Same Sheet.

Quantitative Data Analysis Driven Economic Status Line Chart PowerPoint Slides Templates
Be The Dramatist With Our quantitative data analysis driven economic status line chart powerpoint slides Templates . Script Out The Play Of Words.

Quantitative Data Analysis Driven Economic With Column Chart PowerPoint Slides Templates
Add Some Dramatization To Your Thoughts. Our quantitative data analysis driven economic with column chart powerpoint slides Templates Make Useful Props.

Data Analysis On Excel Driven Stock Chart For Market History PowerPoint Slides Templates
Draw Out The Best In You With Our data analysis on excel driven stock chart for market history powerpoint slides Templates . Let Your Inner Brilliance Come To The Surface.
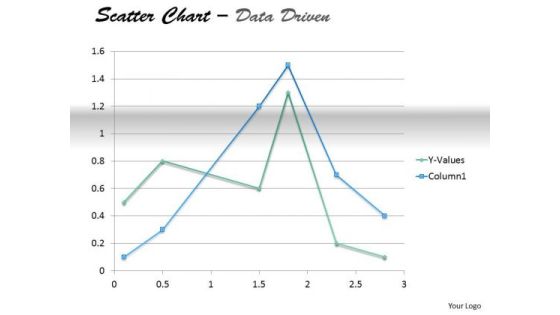
Examples Of Data Analysis Market Driven Present In Scatter Chart PowerPoint Slides Templates
Your Thoughts Will Take To Our examples of data analysis market driven present in scatter chart powerpoint slides Templates Like A Duck To Water. They Develop A Binding Affinity.

Personal Data Visualization On Computer Screen Ppt PowerPoint Presentation Show Layout Ideas
Presenting this set of slides with name personal data visualization on computer screen ppt powerpoint presentation show layout ideas. This is a one stage process. The stages in this process are data visualization icon, research analysis, business focus. This is a completely editable PowerPoint presentation and is available for immediate download. Download now and impress your audience.

Business Diagram 3d Thumb Chart And Tablet For Data Representation PowerPoint Slide
This business diagram displays graphic of 3d thumb up chart with icons on computer screen. This business slide contains the concept of business data representation. Use this diagram to build professional presentations for your viewers.

Data Analysis On Excel 3d Chart Shows Interrelated Sets Of PowerPoint Templates
Put Them On The Same Page With Our data analysis on excel 3d chart shows interrelated sets of Powerpoint Templates . Your Team Will Sing From The Same Sheet.
Business Diagram 3d Capsule With Multiple Icons For Business Data Flow PowerPoint Slide
This diagram has been designed with 3d graphic of capsule with multiple icons. This data driven PowerPoint slide can be used to give your presentations more effective look. It helps in clearly conveying your message to clients and audience.
Business Diagram Flask And Test Tubes For Data Driven PowerPoint Slide
This data driven diagram has been designed with flask and test tubes. Download this diagram to give your presentations more effective look. It helps in clearly conveying your message to clients and audience.
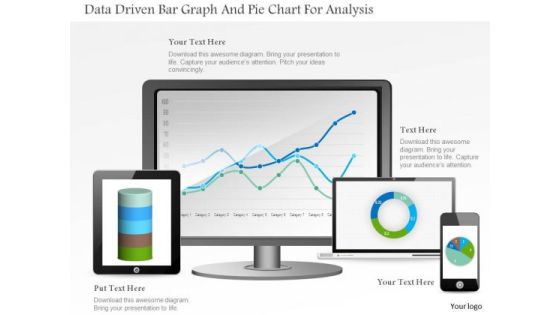
Business Diagram Data Driven Bar Graph And Pie Chart For Analysis PowerPoint Slide
This PowerPoint template displays technology gadgets with various business charts. Use this diagram slide, in your presentations to make business reports for statistical analysis. You may use this diagram to impart professional appearance to your presentations.
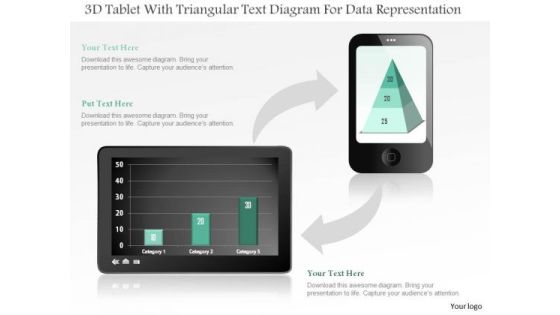
Business Diagram 3d Tablet With Triangular Text Diagram For Data Representation PowerPoint Slide
This business diagram displays bar graph on tablet and pyramid chart on mobile phone. Use this diagram, to make reports for interactive business presentations. Create professional presentations using this diagram.

Tools For HR Business Analytics Understanding Working Of ETL Tools For Data Integration Ideas PDF
This slide represents the workflow of ETL tools which allows businesses to consolidate data from various databases into single repository. It includes three steps of ETL process such as extracting, transforming and loading data. Presenting this PowerPoint presentation, titled Tools For HR Business Analytics Understanding Working Of ETL Tools For Data Integration Ideas PDF, with topics curated by our researchers after extensive research. This editable presentation is available for immediate download and provides attractive features when used. Download now and captivate your audience. Presenting this Tools For HR Business Analytics Understanding Working Of ETL Tools For Data Integration Ideas PDF. Our researchers have carefully researched and created these slides with all aspects taken into consideration. This is a completely customizable Tools For HR Business Analytics Understanding Working Of ETL Tools For Data Integration Ideas PDF that is available for immediate downloading. Download now and make an impact on your audience. Highlight the attractive features available with our PPTs.
Threats Management Of Confidential Data Reports Icon Ppt Ideas Summary PDF
Persuade your audience using this Threats Management Of Confidential Data Reports Icon Ppt Ideas Summary PDF. This PPT design covers two stages, thus making it a great tool to use. It also caters to a variety of topics including Threats Management, Confidential Data Reports, Icon. Download this PPT design now to present a convincing pitch that not only emphasizes the topic but also showcases your presentation skills.

Business Analytics Application Understanding Working Of ETL Tools For Data Structure PDF
This slide represents the workflow of ETL tools which allows businesses to consolidate data from various databases into single repository. It includes three steps of ETL process such as extracting, transforming and loading data. This Business Analytics Application Understanding Working Of ETL Tools For Data Structure PDF from Slidegeeks makes it easy to present information on your topic with precision. It provides customization options, so you can make changes to the colors, design, graphics, or any other component to create a unique layout. It is also available for immediate download, so you can begin using it right away. Slidegeeks has done good research to ensure that you have everything you need to make your presentation stand out. Make a name out there for a brilliant performance.
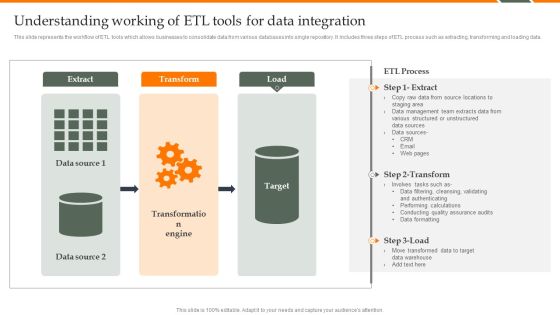
Human Resource Analytics Understanding Working Of ETL Tools For Data Integration Microsoft PDF
This slide represents the workflow of ETL tools which allows businesses to consolidate data from various databases into single repository. It includes three steps of ETL process such as extracting, transforming and loading data. Do you know about Slidesgeeks Human Resource Analytics Understanding Working Of ETL Tools For Data Integration Microsoft PDF These are perfect for delivering any kind od presentation. Using it, create PowerPoint presentations that communicate your ideas and engage audiences. Save time and effort by using our pre-designed presentation templates that are perfect for a wide range of topic. Our vast selection of designs covers a range of styles, from creative to business, and are all highly customizable and easy to edit. Download as a PowerPoint template or use them as Google Slides themes.

Decision Support System Why We Need Data Warehouse Ppt Slides Good PDF
This slide represents the need for a data warehouse in the organization, such as data quality, single point for all data for all users, and the complicated problems that can be solved through a data warehouse. This is a Decision Support System Why We Need Data Warehouse Ppt Slides Good PDF template with various stages. Focus and dispense information on two stages using this creative set, that comes with editable features. It contains large content boxes to add your information on topics like Data Warehouse Offers, Complicated Problems, Data Quality. You can also showcase facts, figures, and other relevant content using this PPT layout. Grab it now.
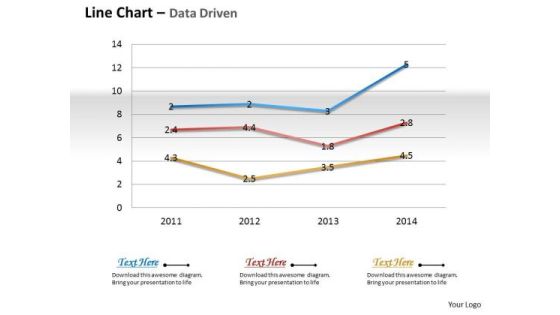
Business Data Analysis Chart Shows Changes Over The Time PowerPoint Templates
Document The Process On Our business data analysis chart shows changes over the time Powerpoint Templates. Make A Record Of Every Detail.

Data Analysis Excel Driven Multiple Series Scatter Chart PowerPoint Slides Templates
Your Listeners Will Never Doodle. Our data analysis excel driven multiple series scatter chart powerpoint slides Templates Will Hold Their Concentration.

Various Stages Data Extraction Process Flow Chart Ppt PowerPoint Presentation Pictures Show PDF
Persuade your audience using this various stages data extraction process flow chart ppt powerpoint presentation pictures show pdf. This PPT design covers five stages, thus making it a great tool to use. It also caters to a variety of topics including interpretation evaluation, data mining, transformation, preprocessing, selection, target data, preprocessed data, transformed data, patterns, knowledge. Download this PPT design now to present a convincing pitch that not only emphasizes the topic but also showcases your presentation skills.

Decision Support System Checklist To Implement Data Warehouse In Company Slides PDF
This slide describes the checklist to implement a data warehouse in the company, including strategies to assess data, organization of data, tools to manage data, and so on. This is a Decision Support System Checklist To Implement Data Warehouse In Company Slides PDF template with various stages. Focus and dispense information on one stages using this creative set, that comes with editable features. It contains large content boxes to add your information on topics like Datas Consistency, Time Stamped, Operational Systems. You can also showcase facts, figures, and other relevant content using this PPT layout. Grab it now.

Decision Support System What Is Operational Data Store Ppt Portfolio Example File PDF
This slide illustrates the operational data store and its architecture, including data sources such as unstructured and structured, ETL operations, and applications. This is a Decision Support System What Is Operational Data Store Ppt Portfolio Example File PDF template with various stages. Focus and dispense information on one stages using this creative set, that comes with editable features. It contains large content boxes to add your information on topics like Operational Data Store, Application, Data Sources, Enterprise Data Warehouse. You can also showcase facts, figures, and other relevant content using this PPT layout. Grab it now.

Decision Support System What Is Dependent Data Mart Ppt Layout PDF
This slide depicts the dependent data mart and how it can be established in two ways, such as access to both data warehouse and data mart or access to only data mart. This is a Decision Support System What Is Dependent Data Mart Ppt Layout PDF template with various stages. Focus and dispense information on one stages using this creative set, that comes with editable features. It contains large content boxes to add your information on topics like Operational Sources, Enterprise Data Warehouse, Dependent Department Datamarts. You can also showcase facts, figures, and other relevant content using this PPT layout. Grab it now.

Decision Support System What Is Cloud Data Warehouse Ppt Visual Aids Pictures PDF
This slide depicts what a cloud data warehouse is and how it can store data from many data sources and is scalable as per the organizational needs. Presenting Decision Support System What Is Cloud Data Warehouse Ppt Visual Aids Pictures PDF to provide visual cues and insights. Share and navigate important information on four stages that need your due attention. This template can be used to pitch topics like Data Sources, Cloud Data Warehouse, Essential Component. In addtion, this PPT design contains high resolution images, graphics, etc, that are easily editable and available for immediate download.

Decision Support System What Is Hybrid Data Mart Ppt Outline Visual Aids PDF
This slide depicts the hybrid data mart and how data is integrated into this type of data mart other than data warehouse and valuable for ad hoc integration. Presenting Decision Support System What Is Hybrid Data Mart Ppt Outline Visual Aids PDF to provide visual cues and insights. Share and navigate important information on three stages that need your due attention. This template can be used to pitch topics like Operational Sources, Enterprise Data Warehouse, Dependent Department Datamarts. In addtion, this PPT design contains high resolution images, graphics, etc, that are easily editable and available for immediate download.

Real Time Data Processing Architecture For Management Systems Ppt Professional Slide Download PDF
This slide covers the real time data processing architecture for energy management systems which focuses on three tier such as data acquisition, processing and presentation with sources, integration, evaluation and data stream application. Persuade your audience using this ocessing Architecture For Management Systems Ppt Professional Slide Download PDF. This PPT design covers one stages, thus making it a great tool to use. It also caters to a variety of topics including Data Acquisition Tier, Data Processing Tier, Data Presentation Tier. Download this PPT design now to present a convincing pitch that not only emphasizes the topic but also showcases your presentation skills.
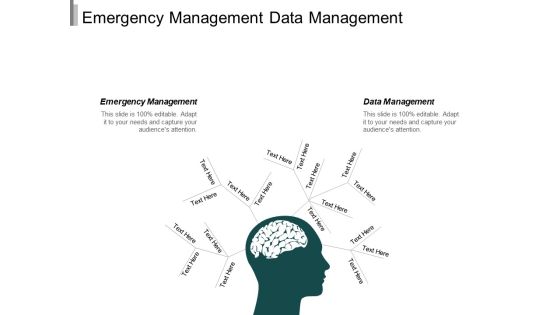
Emergency Management Data Management Management Facility Planning Ppt PowerPoint Presentation Infographics Graphics Tutorials
This is a emergency management data management management facility planning ppt powerpoint presentation infographics graphics tutorials. This is a two stage process. The stages in this process are emergency management, data management, management facility planning.

Multivariate Data Analysis Driven Line Chart For Market Survey PowerPoint Slides Templates
Rake In The Dough With
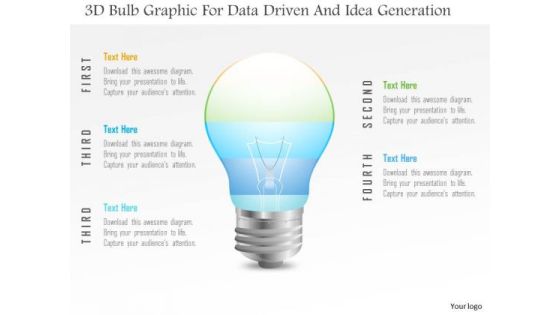
Business Diagram 3d Bulb Graphic For Data Driven And Idea Generation PowerPoint Slide
This Power Point template has been designed with 3d bulb graphic. Use this slide to represent technology idea and strategy concepts. Download this diagram for your business presentations and get exclusive comments on your efforts.
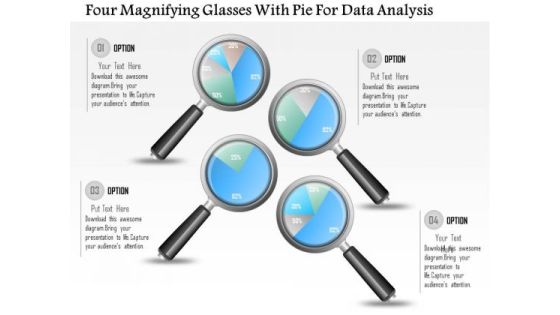
Business Diagram Four Magnifying Glasses With Pie For Data Analysis PowerPoint Slide
This business diagram displays graphic of pie charts in shape of magnifying glasses This business slide is suitable to present and compare business data. Use this diagram to build professional presentations for your viewers.
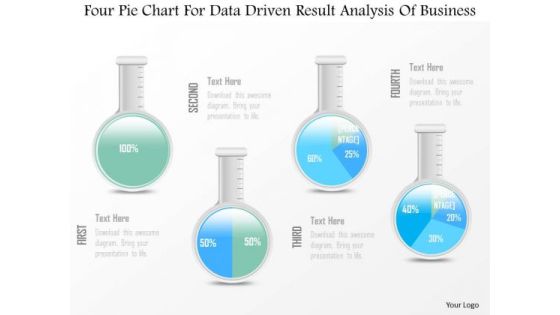
Business Diagram Four Pie Chart For Data Driven Result Analysis Of Business PowerPoint Slide
This business diagram displays graphic of pie charts in shape of flasks. This business slide is suitable to present and compare business data. Use this diagram to build professional presentations for your viewers.
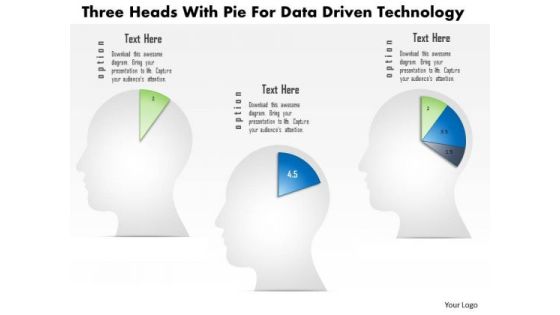
Business Diagram Three Heads With Pie For Data Driven Technology PowerPoint Slide
This business diagram displays three human faces with pie charts. This Power Point template has been designed to compare and present business data. You may use this diagram to impart professional appearance to your presentations.

Internal And External Sources Of Data Generation Ppt PowerPoint Presentation Gallery Information
Presenting this set of slides with name internal and external sources of data generation ppt powerpoint presentation gallery information. This is a three stage process. The stages in this process are data sources, database management, marketing. This is a completely editable PowerPoint presentation and is available for immediate download. Download now and impress your audience.

Data Collection Methods And Tools With Icons Ppt PowerPoint Presentation Pictures Structure
Presenting this set of slides with name data collection methods and tools with icons ppt powerpoint presentation pictures structure. This is a six stage process. The stages in this process are data sources, database management, marketing. This is a completely editable PowerPoint presentation and is available for immediate download. Download now and impress your audience.
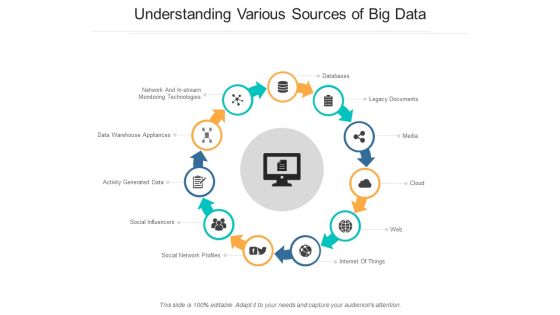
Understanding Various Sources Of Big Data Ppt PowerPoint Presentation Model Slide Download
Presenting this set of slides with name understanding various sources of big data ppt powerpoint presentation model slide download. This is a eleven stage process. The stages in this process are data sources, database management, marketing. This is a completely editable PowerPoint presentation and is available for immediate download. Download now and impress your audience.

Data Collection And Analysis Control Chart Ppt PowerPoint Presentation Example File
This is a data collection and analysis control chart ppt powerpoint presentation example file. This is a four stage process. The stages in this process are business, strategy, marketing, bar graph, growth strategy.

Administered Data And Analytic Quality Playbook Purpose Of This Playbook Topics PDF
This is a Administered Data And Analytic Quality Playbook Purpose Of This Playbook Topics PDF template with various stages. Focus and dispense information on four stages using this creative set, that comes with editable features. It contains large content boxes to add your information on topics like Business Intelligence, Generation Search, Businesses Dashboards You can also showcase facts, figures, and other relevant content using this PPT layout. Grab it now.

Decision Support System What Is Data Mart Ppt Icon Infographic Template PDF
This slide depicts the data mart type of data warehouse, its architecture, and how a single department manages it in an organization through limited sources of information. This is a Decision Support System What Is Data Mart Ppt Icon Infographic Template PDF template with various stages. Focus and dispense information on six stages using this creative set, that comes with editable features. It contains large content boxes to add your information on topics like External Sources, Data Feed, Spreadsheets. You can also showcase facts, figures, and other relevant content using this PPT layout. Grab it now.

Decision Support System Data Warehouse Architecture With Staging Area Diagrams PDF
This slide describes a data warehouse architecture with a staging area and how staging helps clean and process the information before entering it into the data warehouse. This is a Decision Support System Data Warehouse Architecture With Staging Area Diagrams PDF template with various stages. Focus and dispense information on one stages using this creative set, that comes with editable features. It contains large content boxes to add your information on topics like Data Sources, Staging Area, Operational System. You can also showcase facts, figures, and other relevant content using this PPT layout. Grab it now.

Reverse Proxy Server IT Data Center Proxy Server And Its Architecture Ppt Visual Aids Files PDF
This slide depicts the data center proxy server that uses fixed IP addresses and a direct connection to send and respond to requests through data centers. This is a reverse proxy server it data center proxy server and its architecture ppt visual aids files pdf template with various stages. Focus and dispense information on one stages using this creative set, that comes with editable features. It contains large content boxes to add your information on topics like residential, data center, proxy user, central, proxy server. You can also showcase facts, figures, and other relevant content using this PPT layout. Grab it now.

Decision Support System Data Warehouse Is Non Volatile Ppt Professional Vector PDF
This slide illustrates the non-volatile feature of the data warehouse, and it doesnt support operational data changes such as update, insert and delete. This is a Decision Support System Data Warehouse Is Non Volatile Ppt Professional Vector PDF template with various stages. Focus and dispense information on two stages using this creative set, that comes with editable features. It contains large content boxes to add your information on topics like OLTP Databases, Data Warehouse, Decision Support System. You can also showcase facts, figures, and other relevant content using this PPT layout. Grab it now.

Decision Support System Top Down Design Approach Of Data Warehouse Download PDF
This slide represents the top-down design approach of the data warehouse, including its features such as time-variant, non-volatile, subject-oriented, etc. This is a Decision Support System Top Down Design Approach Of Data Warehouse Download PDF template with various stages. Focus and dispense information on four stages using this creative set, that comes with editable features. It contains large content boxes to add your information on topics like Data Warehouse, Integrated Data Repository, Source System. You can also showcase facts, figures, and other relevant content using this PPT layout. Grab it now.

Customer Voice Service Data Flow Charts Ppt PowerPoint Presentation Icon Styles PDF
This slide presents a data flow charts, which includes visual data about the inputs and outputs of entities and processes illustrating the flow of information between client voice services and data verse. it covers procedures including create project, distribute survey, respond to survey and analyse results. Presenting Customer Voice Service Data Flow Charts Ppt PowerPoint Presentation Icon Styles PDF to dispense important information. This template comprises one stages. It also presents valuable insights into the topics including Create Project, Distribute Survey, Analyze Results, Project Information. This is a completely customizable PowerPoint theme that can be put to use immediately. So, download it and address the topic impactfully.

Scale Up Plan For Data Inventory Model Table Of Contents Budget Portrait PDF
This is a scale up plan for data inventory model table of contents budget portrait pdf template with various stages. Focus and dispense information on seven stages using this creative set, that comes with editable features. It contains large content boxes to add your information on topics like project budget, training overview, project roadmap, mitigation strategies, dashboards for monitoring. You can also showcase facts, figures, and other relevant content using this PPT layout. Grab it now.

Decision Support System Bottom Up Design Approach Data Warehouse Download PDF
This slide depicts the bottom-up design approach of the data warehouse and how data mart is built firstly in this approach to satisfy specific business operation needs. Presenting Decision Support System Bottom Up Design Approach Data Warehouse Download PDF to provide visual cues and insights. Share and navigate important information on three stages that need your due attention. This template can be used to pitch topics like Source System, Extract Transform Load, Data Mart. In addtion, this PPT design contains high resolution images, graphics, etc, that are easily editable and available for immediate download.

Decision Support System Data Warehouse Is Subject Oriented Ppt Inspiration Objects PDF
This slide represents the subject-oriented feature of data warehouse and various operational applications and data warehouse subjects sales, product, customer, and so on. Presenting Decision Support System Data Warehouse Is Subject Oriented Ppt Inspiration Objects PDF to provide visual cues and insights. Share and navigate important information on one stages that need your due attention. This template can be used to pitch topics like Operational Applications, Data Warehouse Subjects, Order Processing. In addtion, this PPT design contains high resolution images, graphics, etc, that are easily editable and available for immediate download.
Four Steps Of Cyber Security Data Breach Threats Process Ppt Icon Format Ideas PDF
This slide covers steps utilised to breach data. It includes stages such as probing, performing initial attack, expansion of attacks and data lifting. Presenting Four Steps Of Cyber Security Data Breach Threats Process Ppt Icon Format Ideas PDF to dispense important information. This template comprises one stages. It also presents valuable insights into the topics including Probe, Initial Attack, Expanded Attack, Data Lift. This is a completely customizable PowerPoint theme that can be put to use immediately. So, download it and address the topic impactfully.
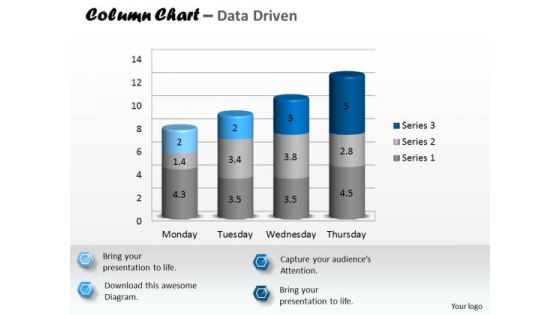
Data Analysis In Excel 3d Column Chart To Represent Information PowerPoint Templates
Rake In The Dough With
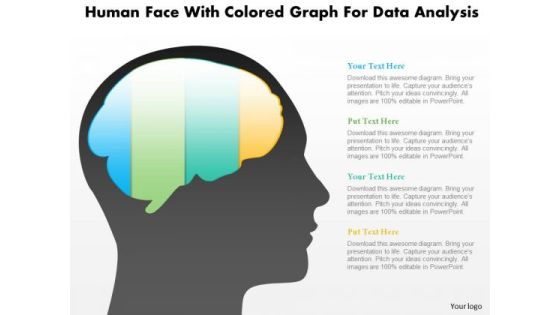
Business Diagram Human Face With Colored Graph For Data Analysis PowerPoint Slide
This diagram displays human face graphic with colored graph. This diagram can be used to represent strategy, planning, thinking of business plan. Display business options in your presentations by using this creative diagram.
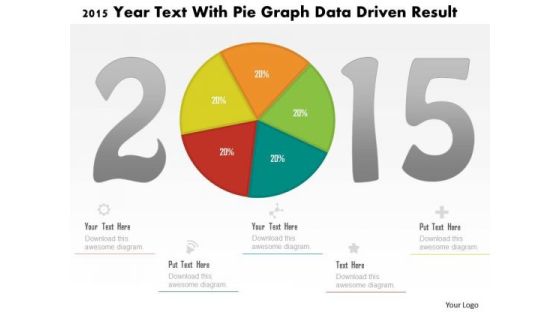
Business Diagram 2015 Year Text With Pie Graph Data Driven Result PowerPoint Slide
This business diagram displays 2015 year numbers with pie chart. This diagram is suitable to display business strategy for year 2015. Download this professional slide to present information in an attractive manner

ETL Repository Big Data Integration Ppt PowerPoint Presentation Ideas Outline PDF
This architecture states that data will be extracted from several source systems and then the data will be transformed and loaded into hadoop data warehouse. End-user visualizations, reports and queries are run on top of this data warehouse.Deliver and pitch your topic in the best possible manner with this ETL Repository Big Data Integration Ppt PowerPoint Presentation Ideas Outline PDF. Use them to share invaluable insights on Server Farm, Staging Area, Dashboards and impress your audience. This template can be altered and modified as per your expectations. So, grab it now.
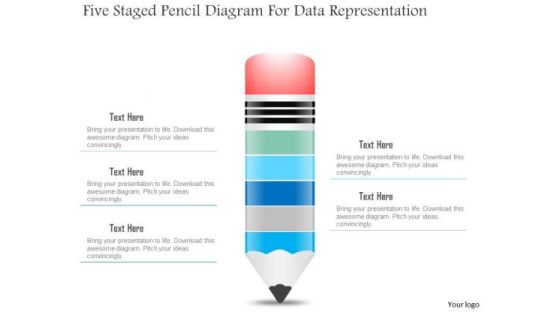
Business Diagram Five Staged Pencil Diagram For Data Representation PowerPoint Slide
This business slide displays five staged pencil diagram. It contains pencil graphic divided into five parts. This diagram slide depicts processes, stages, steps, points, options and education information display. Use this diagram, in your presentations to express your views innovatively.
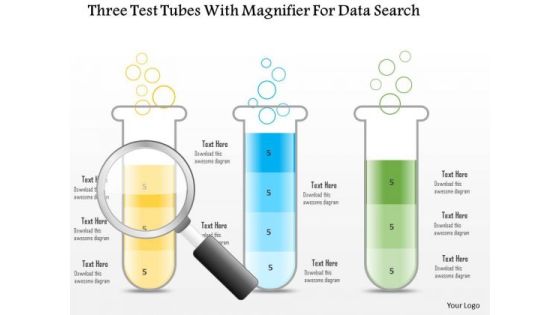
Business Diagram Three Test Tubes With Magnifier For Data Search PowerPoint Slide
This business diagram displays three test tubes with magnifying glass. This diagram is suitable to depict flow of business activities or steps. Download this professional slide to present information in an attractive manner.

Business Diagram Three Trucks For Data Representation For Business PowerPoint Slide
This business diagram displays three trucks graphic. This diagram contains trucks for percentage value growth. Use this diagram to display business growth over a period of time.
Multiple Data Processing Mainframe Vector Icon Ppt PowerPoint Presentation Styles Picture PDF
Presenting multiple data processing mainframe vector icon ppt powerpoint presentation styles picture pdf to dispense important information. This template comprises three stages. It also presents valuable insights into the topics including multiple data processing mainframe vector icon. This is a completely customizable PowerPoint theme that can be put to use immediately. So, download it and address the topic impactfully.

Data Server Room With Computer Mainframe With Neon Lights Ppt PowerPoint Presentation Inspiration Grid PDF
Presenting data server room with computer mainframe with neon lights ppt powerpoint presentation inspiration grid pdf to dispense important information. This template comprises three stages. It also presents valuable insights into the topics including data server room with computer mainframe. This is a completely customizable PowerPoint theme that can be put to use immediately. So, download it and address the topic impactfully.
Hard Disk For Eternal Data Storage Icon Ppt PowerPoint Presentation Show Samples PDF
Presenting hard disk for eternal data storage icon ppt powerpoint presentation show samples pdf to dispense important information. This template comprises three stages. It also presents valuable insights into the topics including hard disk for eternal data storage icon. This is a completely customizable PowerPoint theme that can be put to use immediately. So, download it and address the topic impactfully.
 Home
Home
