Data Challenges/icons/appstore.png

PowerPoint Slide Sales Business Process Ppt Layouts
This Diagram makes information accessible throughout the organization with a collective, visible view of critical data from different perspectives and providing the tools to upcoming business scenarios and plan for change.

Business Diagram 10 Business Steps In Circle Presentation Template
This business consulting diagram helps to explain the course or movement of information in a process. This diagram is ideal for data representation and can also be used to show stages of a business process.
Business Diagram Five Staged Business Process Diagram With Icons Presentation Template
Our above slide displays five staged business process diagram. Download our above diagram to express information in a visual way. Use this diagram and get good comments for data related presentations.
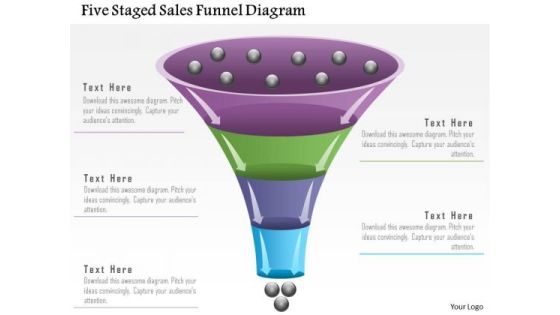
Business Diagram Five Staged Sales Funnel Diagram Presentation Template
Our above slide displays five staged sales funnel diagram. Download our above diagram to express information in a visual way. Use this diagram and get good comments for data related presentations.

Infographic Diagram With Percentage Values Powerpoint Template
Visually support your presentation with our above template containing infographic diagram with percentage values. This diagram is excellent visual tools for explaining huge amounts of information where complex data needs to be explained immediately and clearly.

Arrows Infographic For Strategic Management Concept Powerpoint Template
Our above PPT slide contains four curved arrows infographic design. This business diagram helps to depict business information for strategic management. Use this diagram to impart more clarity to data and to create more sound impact on viewers.

Dashboard With Increasing Values Powerpoint Slides
This innovative, stunningly beautiful dashboard has been designed for data visualization. It contains pie charts with increasing percentage values. This PowerPoint template helps to display your information in a useful, simple and uncluttered way.

Dashboard With Low High Medium Indication Powerpoint Slides
This innovative, stunningly beautiful dashboard has been designed for data visualization. It contains dashboard with low, high and medium indication. This PowerPoint template helps to display your information in a useful, simple and orderly way.

Four Steps Circular Infographic Powerpoint Slides
This innovative, stunningly beautiful dashboard has been designed for data visualization. It contains circular infographic design. This PowerPoint template helps to display your information in a useful, simple and orderly way.

Team Pictures With Names And Profile Powerpoint Slides
This PowerPoint template has been designed with team pictures and profile information. This diagram is excellent visual tools to present team profile. Download this PPT slide to explain complex data immediately and clearly.
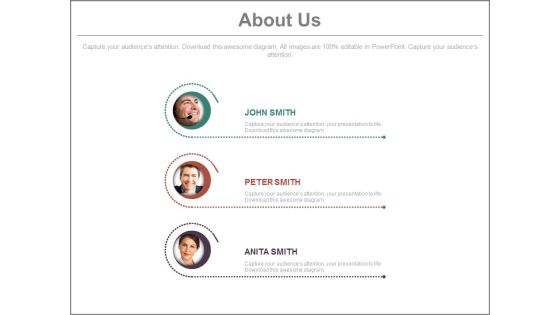
Team Profiles For About Us Slide Powerpoint Slides
This PowerPoint template has been designed with team pictures and profile information. This diagram is excellent visual tools to present team profile. Download this PPT slide to explain complex data immediately and clearly.

Business People Profile For Social Media Powerpoint Slides
This PowerPoint template has been designed with business people profile information. This diagram is excellent visual tools to present team profile with social media. Download this PPT slide to explain complex data immediately and clearly.
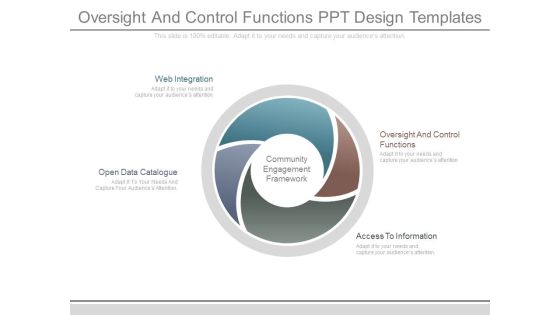
Oversight And Control Functions Ppt Design Templates
This is a oversight and control functions ppt design templates. This is a four stage process. The stages in this process are web integration, oversight and control functions, access to information, open data catalogue, community engagement framework.

Workers Administration Process Powerpoint Layout
This is a workers administration process powerpoint layout. This is a five stage process. The stages in this process are data transfer, activity, decision point, flow of controls, flow of information.

Datafy Phases Of Datafication As A Use Perspective Ideas PDF
This slide represents the phases of datafication from a use perspective and the stages include domain, data generation, analyzing data and generating output, and data-driven interventions. Each phase includes four steps, such as step counter, webshop, Schiphol-asito, and predictive policing. The Datafy Phases Of Datafication As A Use Perspective Ideas PDF is a compilation of the most recent design trends as a series of slides. It is suitable for any subject or industry presentation, containing attractive visuals and photo spots for businesses to clearly express their messages. This template contains a variety of slides for the user to input data, such as structures to contrast two elements, bullet points, and slides for written information. Slidegeeks is prepared to create an impression.

Concept Of Ontology In The Semantic Web Timeline For Semantic Web Deployment Topics PDF
This slide represents the timeline for semantic web deployment and development, including the steps to be performed at each months interval. The steps include discovering data, integrating data with meaningful labels, validating, and exploring methods for data transformation. The Concept Of Ontology In The Semantic Web Timeline For Semantic Web Deployment Topics PDF is a compilation of the most recent design trends as a series of slides. It is suitable for any subject or industry presentation, containing attractive visuals and photo spots for businesses to clearly express their messages. This template contains a variety of slides for the user to input data, such as structures to contrast two elements, bullet points, and slides for written information. Slidegeeks is prepared to create an impression.
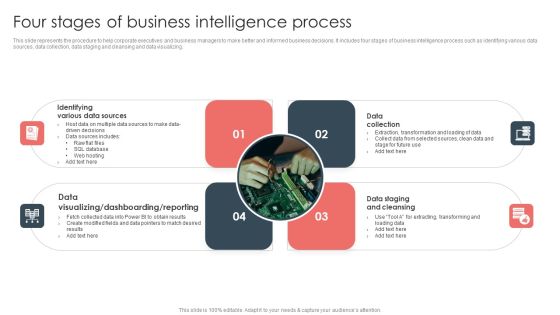
Overview Of BI For Enhanced Decision Making Four Stages Of Business Intelligence Process Template PDF
This slide represents the procedure to help corporate executives and business managers to make better and informed business decisions. It includes four stages of business intelligence process such as identifying various data sources, data collection, data staging and cleansing and data visualizing. Present like a pro with Overview Of BI For Enhanced Decision Making Four Stages Of Business Intelligence Process Template PDF Create beautiful presentations together with your team, using our easy to use presentation slides. Share your ideas in real time and make changes on the fly by downloading our templates. So whether you are in the office, on the go, or in a remote location, you can stay in sync with your team and present your ideas with confidence. With Slidegeeks presentation got a whole lot easier. Grab these presentations today.

PowerPoint Design Cycle Process Chart Ppt Design
PowerPoint Design Cycle Process Chart PPT Design-This Cycle process diagram depicts process stages in a more understandable and vivid manner. Use this diagram to represent data that is easy to comprehend and analyze.-PowerPoint Design Cycle Process Chart PPT Design

PowerPoint Design Gear Process Company Ppt Template
PowerPoint Design Gear Process Company PPT Template-This PowerPoint diagram shows three gears that represent three processes. You can add data depending on the number of processes you want to include in your presentation.-PowerPoint Design Gear Process Company PPT Template
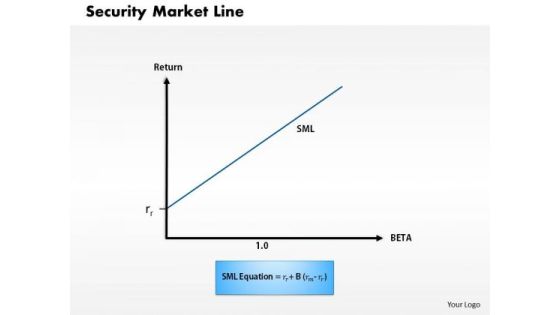
Business Framework Security Market Line 1 PowerPoint Presentation
This diagram displays graph of security market line. You can use line graph to plot changes in data over time, such as monthly revenue and earnings changes or daily changes in stock market prices.

Business Framework Security Market Line 11 PowerPoint Presentation
This diagram displays graph of security market line. You can use line graph to plot changes in data over time, such as monthly revenue and earnings changes or daily changes in stock market prices.
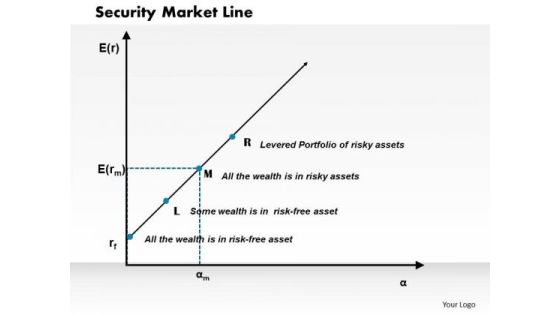
Business Framework Security Market Line PowerPoint Presentation
This diagram displays graph of security market line. You can use line graph to plot changes in data over time, such as monthly revenue and earnings changes or daily changes in stock market prices.
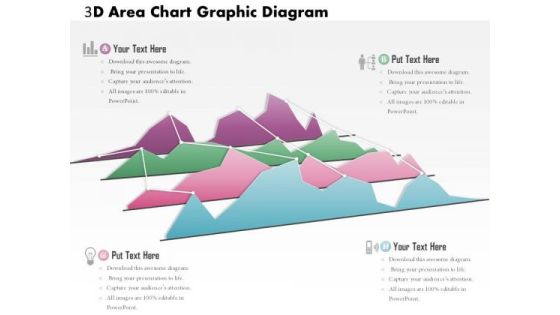
Business Diagram 3d Area Chart Graphic Diagram PowerPoint Ppt Presentation
This slide contains 3d area chart with connecting points. Different colors have been used in the areas below the lines. Use this business diagram to present your data in graphical way.
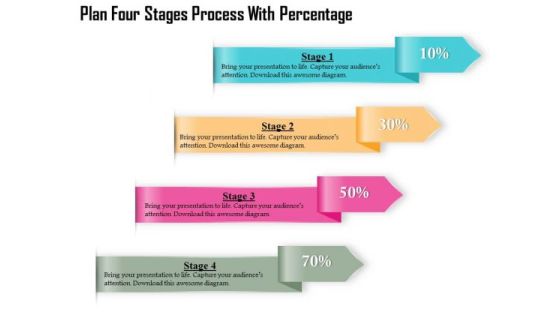
Business Diagram Four Stages Process With Percentage Presentation Template
Four multicolored tags in vertical order has been used to decorate this business diagram. This diagram contains the concept of financial data display with percent values. This diagram can be used for management and finance related presentations.
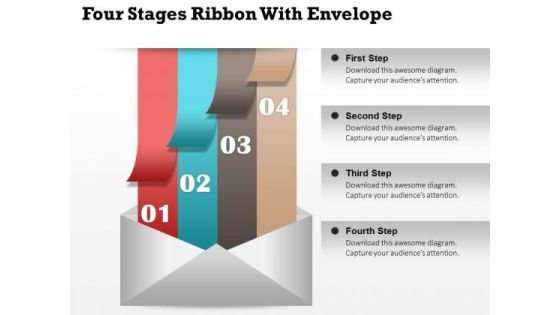
Business Diagram Four Stages Ribbon With Envelope Presentation Template
Concept of data storage and communication has been displayed in this business diagram with graphic of four colored ribbons and envelop. Use this diagram template for business communication related presentations.

Business Diagram Three Stages Process Percentage Presentation Template
Three multicolored tags in vertical order has been used to decorate this business diagram. This diagram contains the concept of financial data display with percent values. This diagram can be used for management and finance related presentations.

Five Staged Vertical Process Diagram Presentation Template
Five staged vertical process diagram has been used to design this power point template. This PPT contains the concept of dependent data representation. Use this PPT and build presentation for business and marketing related topics.
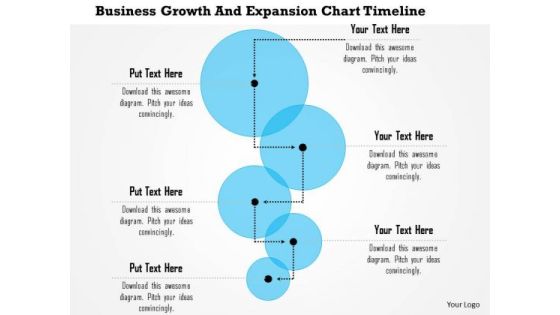
Business Framework Business Growth And Expansion Chart Timeline PowerPoint Presentation
Six staged process flow linear diagram is used to design this Power Point template. This PPT slide contains the concept of data and process flow. This exclusive PPT can be used for linear process flow representation in any presentation.
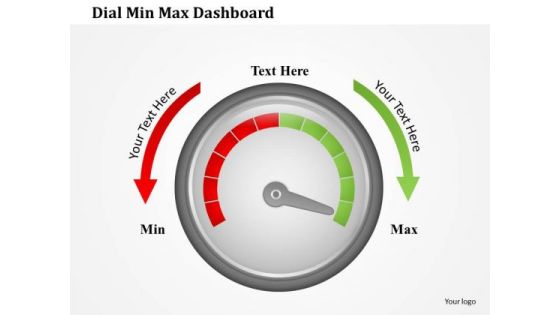
Business Framework Dial Min Max Dashboard PowerPoint Presentation
This professional power point template slide has been crafted with graphic of two funnels. These funnels are used to show any data calculation or process flow. Use this PPT for your business presentation and become a professional presenter.
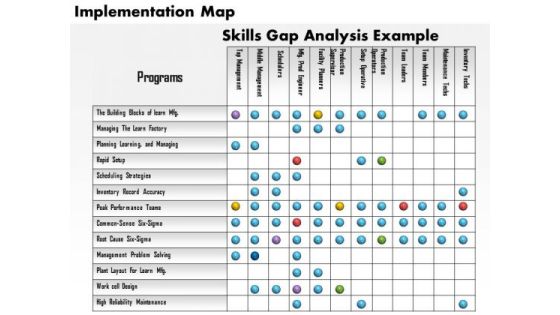
Business Framework Implementation Map PowerPoint Presentation
Graphic of implementation map has been used to decorate this power point diagram slide. This PPT slide contains the concept of data representation. This PPT diagram slide can be used for business and finance related presentations.

Business Diagram Seven Staged Concentric Diagram For Global Agenda Presentation Template
This Power Point template slide has been designed with graphic of seven staged concentric diagram. This PPT slide contains the concept of global agenda. Use this PPT slide for business and global data related presentation.
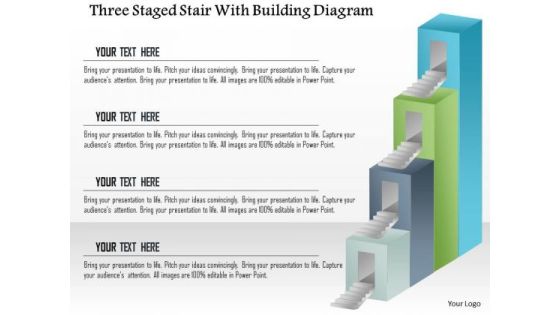
Business Diagram Three Staged Stair With Building Diagram Presentation Template
This Power Point template slide has been designed with graphic of three staged stair diagram. This PPT slide contains the concept of data representation. Use this PPt slide and build innovative presentation for your viewers.
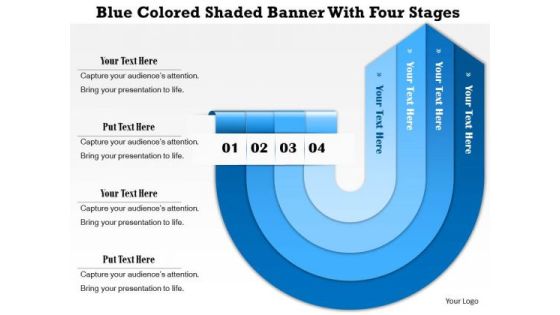
Business Diagram Blue Colored Shaded Banner With Four Stages Presentation Template
Blue colored twisted arrows are used to design this business diagram. These arrows are in banner style with four stages. Use this amazing slide for your data representation in effective manner. Build a unique presentation for your viewers
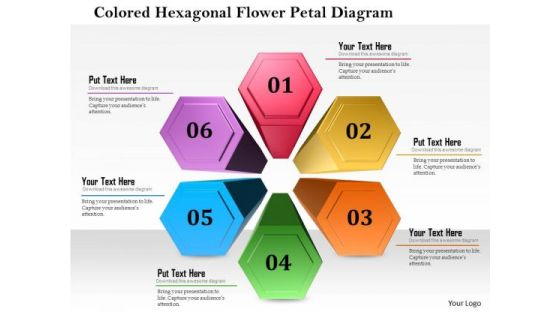
Business Diagram Colored Hexagon Flower Petal Diagram Presentation Template
This business diagram displays colored hexagon flower petal design. This Power Point slide can be used for data representation. Use this PPT slide to show flow of activities in circular manner. Get professional with this exclusive business slide.
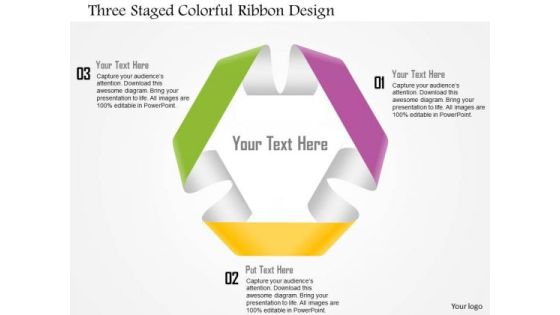
Business Diagram Three Staged Colorful Ribbon Design Presentation Template
This business diagram displays three staged circular ribbon. This Power Point slide can be used for data representation. Use this PPT slide to show flow of activities in circular manner. Get professional with this exclusive business slide.
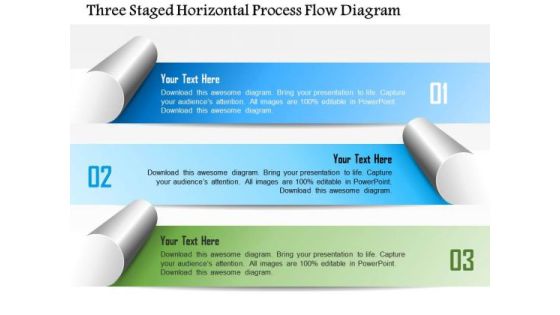
Business Diagram Three Staged Horizontal Process Flow Diagram Presentation Template
This business slide displays three staged horizontal process flow diagram. This diagram is useful for data display. Use this colorful diagram to depict three steps of any business process. It helps in clearly conveying your message to clients and audience.
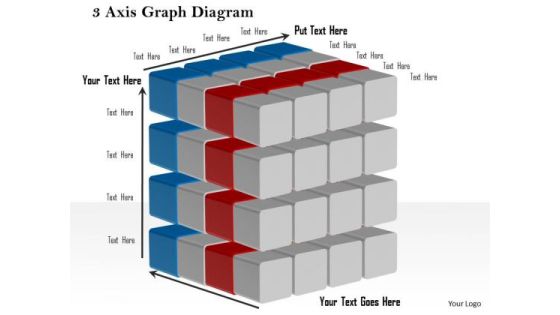
Business Framework 3 Axis Graph Diagram PowerPoint Presentation
This business diagram displays 3 axis graphs with cubes. This editable slide contains the concept of business and success. Use this diagram in your business presentations to display data in graphical manner.

Business Framework Battery Charge Loading Bar PowerPoint Presentation
This business diagram displays bar graph of five battery cells. This business slide contains the concept of business growth shown in multiple levels. Use this diagram to present and compare data in an impressive manner.
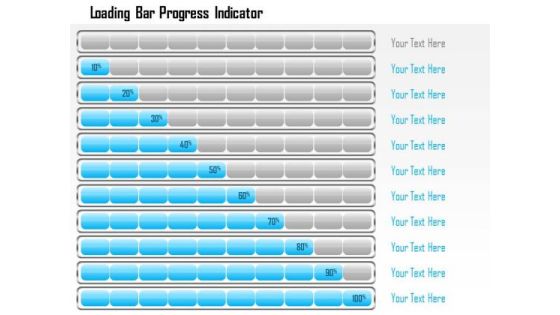
Business Framework Loading Bar Progress Indicator PowerPoint Presentation
This business diagram displays bar progress indicators. This business slide contains the concept of business growth shown in multiple levels. Use this diagram to present and compare data in an impressive manner.

Busines Diagram Four Staged Abstract Vector Banner Set Diagram Presentation Template
Four staged abstract vector banner set diagram has been used to design this business diagram. Use this profession slide for data representation. Deliver amazing presentations to mesmerize your audience.
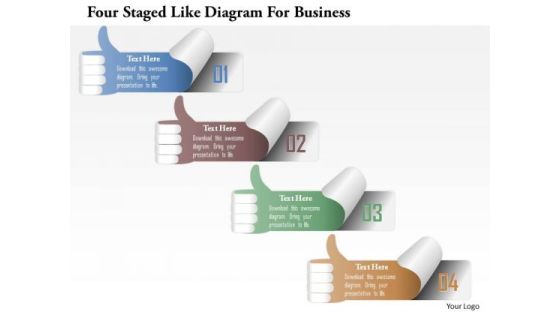
Busines Diagram Four Staged Like Diagram For Business Presentation Template
Four staged like diagram has been used to design this business diagram. This slide contains the concept of data flow and emoticons. This slide offers an excellent background to build professional presentations.
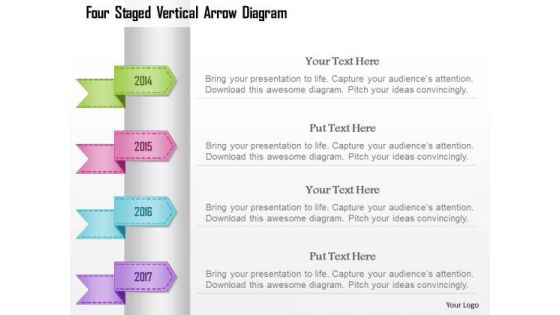
Busines Diagram Four Staged Vertical Arrow Diagram Presentation Template
Four staged vertical arrow diagram has been used to design this business diagram. This business diagram contains the concept of data representation. This pre designed high quality image slide will make your presentations simply the best.
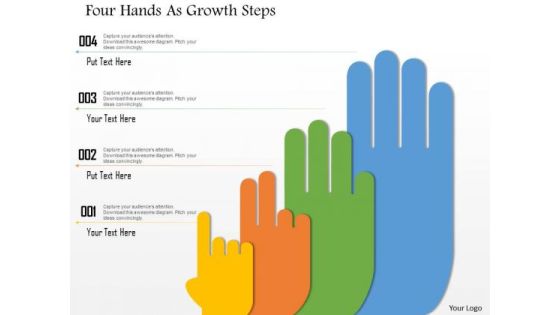
Business Diagram Four Hands As Growth Steps Presentation Template
This business diagram displays four staged hand process diagram. This professional diagram slide helps to display data and process flow. Use this slide for your business and marketing related presentations.
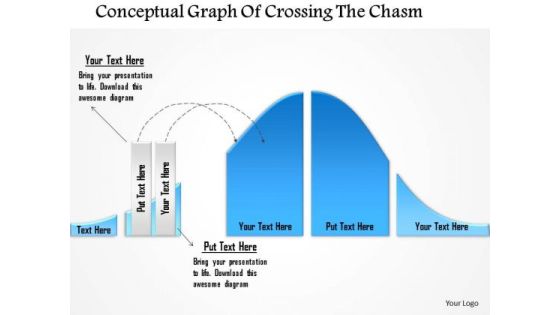
Business Diagram Conceptual Graph Of Crossing The Chasm Presentation Template
This business diagram has been designed with graphic of 3d graph. This slide contains the concept of chasm and data calculation. Use this slide to display chasm crossing condition. This business diagram adds value to your ideas.
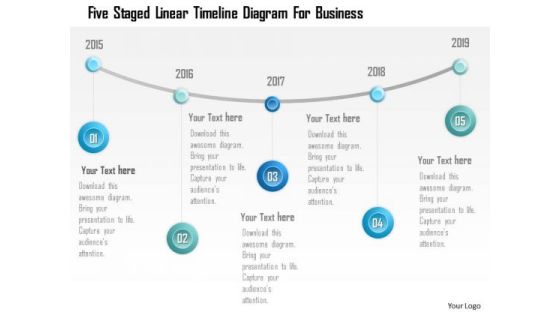
Business Diagram Five Staged Linear Timeline Diagram For Business PowerPoint Template
Five staged linear timeline diagram has been used to design this power point template. This diagram template contains the concept of business data and success strategy representation. Use this PPT for your business and sales related presentations.
Business Diagram Five Staged Timeline Diagram With Icons And Hands Graphics Ppt Template
Five staged timeline diagram with hand icons has been used to develop this power point template. This diagram template contains the concept of business data representation. Use this PPT for your business and sales related presentations.

Business Diagram Four Staged Stair Diagram With Foot Print PowerPoint Template
Four staged stair diagram with foot print has been used to design this power point template. This diagram template contains the concept of success and data flow. Use this PPT for your business and sales related presentations.
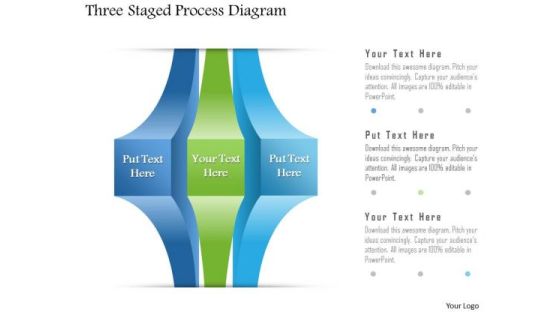
Business Diagram Three Staged Process Diagram PowerPoint Template
Three staged process diagram graphic has been used to design this power point template slide. This PPT contains the concept of data representation for business or marketing. Use this PPT for your business and sales related presentations.
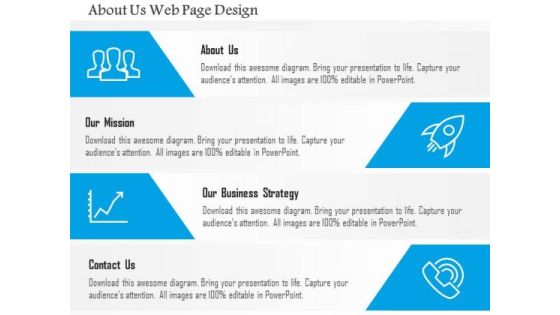
Business Diagram About Us Web Page Design Presentation Template
This power point template diagram has been designed with graphic of four icons. This PPT can represent the concept of building about us. This PPT is suitable for business and data related presentations.

Business Diagram Fishes In Ocean With Four Options Presentation Template
This power point diagram template has been designed with graphic of ocean and fish. This PPT diagram contains the concept of idea generation and data representation. Use this PPT diagram for business and marketing related presentations.
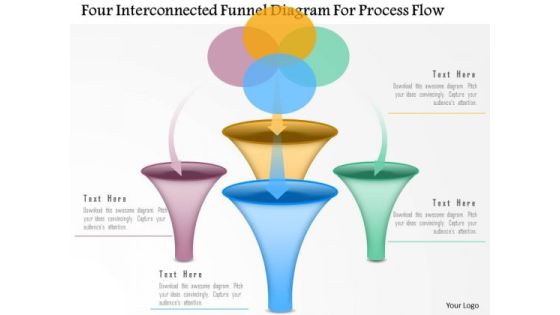
Business Diagram Four Interconnected Funnel Diagram For Process Flow Presentation Template
Graphic of four interconnected funnel diagram has been used to design this power point template diagram. This PPT diagram contains the concept of data and process flow. Use this PPT for marketing and business related presentations.

Business Diagram Four Staged Flag Diagram For Timeline Presentation Template
Graphic of four staged flag diagram has been used to decorate this power point template diagram. This PPT diagram contains the concept of data flow and timeline formation. Use this PPT for marketing and business related presentations.

Business Diagram Four Staged Process Diagram Presentation Template
Graphic of four staged process diagram has been used to craft this power point template diagram. This PPT diagram contains the concept of data and process flow representation. Use this PPT for marketing and business related presentations.

Business Diagram Red Umbrella Under The Magnifier For Search Presentation Template
Graphic of red umbrella and magnifier has been used to craft this PPT diagram. This PPT contains the concept of search. Use this PPT for data and business related presentations.

Business Diagram Three Interconnected Funnel Diagram Presentation Template
Graphic of three interconnected funnel diagram has been used to design this power point template diagram. This PPT diagram contains the concept of data and process flow. Use this PPT for marketing and business related presentations.
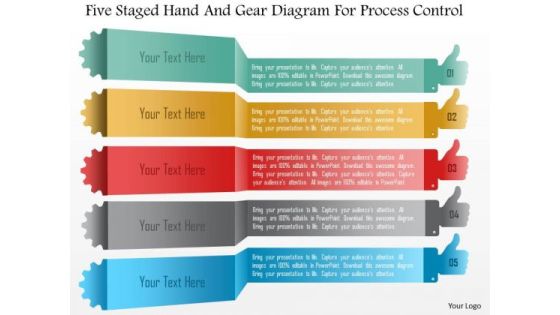
Business Diagram Five Staged Hand And Gear Diagram For Process Control PowerPoint Template
Five staged hand and gear diagram has been used to design this power point template. This PPT contains the concept of data representation and process control. Use this PPT slide for your marketing and business process related presentations.

Business Diagram Three Circular Financial Pie Chart PowerPoint Template
This power point template has been designed with graphic of three circular pie chart. This pie chart is suitable for financial data representation. Use this PPt for your business and finance related presentations.
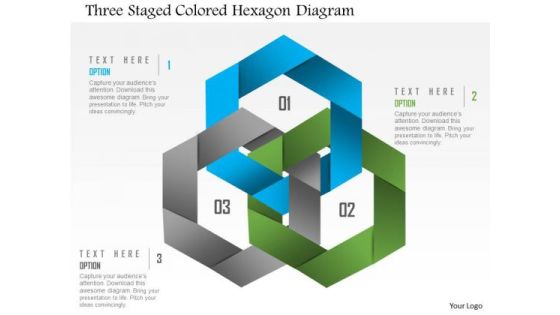
Business Diagram Three Staged Colored Hexagon Diagram PowerPoint Template
Three staged colored hexagon diagram has been used to design this power point template. This PPT contains the concept of study based data representation. This PPT is suitable for business and sales related presentations.
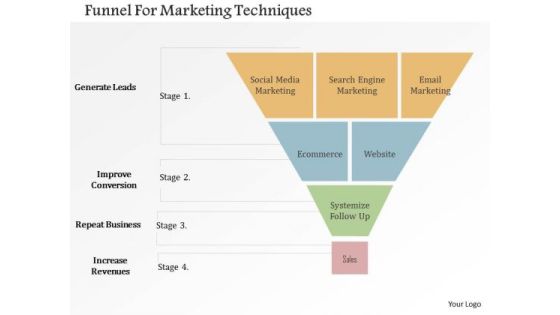
Business Diagram Funnel For Marketing Techniques Presentation Template
Our above slide contains graphics of funnel diagram. It helps to exhibit marketing techniques. Use this diagram to impart more clarity to data and to create more sound impact on viewers.
Business Diagram Icons To Outline Example Presentation Template
Our above slide contains graphics of tags and icons. It helps to display outline of business plan. Use this diagram to impart more clarity to data and to create more sound impact on viewers.


 Continue with Email

 Home
Home


