Data Challenges/icons/appstore.png
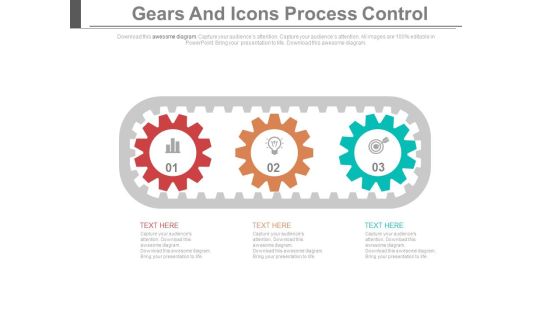
Three Gears Steps For Innovative Process Powerpoint Template
This PowerPoint slide contains graphics of three gears steps. It helps to exhibit innovative process steps. Use this diagram to impart more clarity to data and to create more sound impact on viewers.

Leader With Team And Unique Idea Powerpoint Template
Our above slide contains graphics of leader with team holding idea bulb. This PowerPoint template helps to display teamwork and unique idea. Use this diagram to impart more clarity to data and to create more sound impact on viewers.
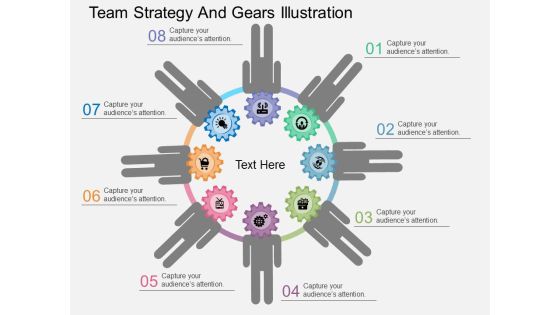
Team Strategy And Gears Illustration Powerpoint Template
Our above PPT slide contains graphics of team gear icons in circular flow. This PowerPoint template may be used to depict team strategy. Use this diagram to impart more clarity to data and to create more sound impact on viewers.
Vulnerability Management Powerpoint Templates Microsoft
This is a vulnerability management powerpoint templates microsoft. This is a six stage process. The stages in this process are vulnerability management, services data centers, security model, current state, goal state, near team.

Business Diagram Pie Chart With Key Performance Indicator Presentation Template
This power point template slide has been crafted with graphic of pie chart and magnifier. This PPT contains the concept of performance indication. Use this PPT for data technology and business related presentations.

Business Diagram Four Staged Arrows With Different Graphics Of Communication Concept Presentation Te
Four staged arrow with different graphics has been used to craft this power point template. This PPT diagram contains the concept of data communication. Use this PPT for business and technology related presentations.
E Business Architecture Planning Example Powerpoint Templates
This is a e business architecture planning example powerpoint templates. This is a four stage process. The stages in this process are technology architecture, data architecture, business architecture, application architecture.

Business Intelligence Pillar Diagram Powerpoint Presentation
This is a business intelligence pillar diagram powerpoint presentation. This is a three stage process. The stages in this process are business intelligence strategy, business process strategy, data strategy, technology strategy.
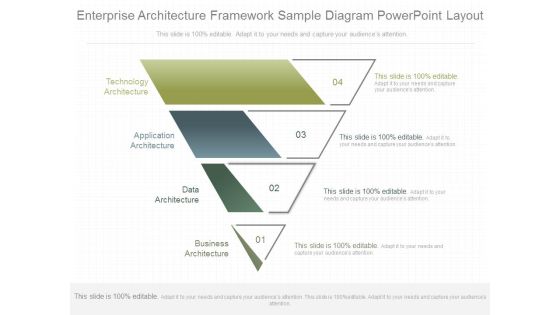
Enterprise Architecture Framework Sample Diagram Powerpoint Layout
This is a enterprise architecture framework sample diagram powerpoint layout. This is a four stage process. The stages in this process are technology architecture, application architecture, data architecture, business architecture.

Business Intelligence Journey Example Ppt Samples Download
This is a business intelligence journey example ppt samples download. This is a five stage process. The stages in this process are automating clerical work, data proficiency, mastering technology, analytic proficiency, computer literacy.
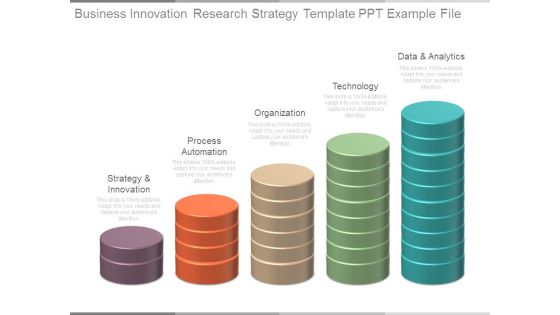
Business Innovation Research Strategy Template Ppt Example File
This is a business innovation research strategy template ppt example file. This is a five stage process. The stages in this process are strategy and innovation, process automation, organization, technology, data and analytics.

Business Transformation Framework Ppt PowerPoint Presentation Gallery Summary
This is a business transformation framework ppt powerpoint presentation gallery summary. This is a five stage process. The stages in this process are implementation strategy, new product launch strategy, selection of right technology, deployment, data conversion, framework execution.

Six Building Blocks Of Digital Transformation Strategy Ppt PowerPoint Presentation Gallery Model
This is a six building blocks of digital transformation strategy ppt powerpoint presentation gallery model. This is a six stage process. The stages in this process are technology, organization, data analytics, process automation, strategy.

Six Building Blocks Of Digital Transformation Ppt PowerPoint Presentation Pictures Example
This is a six building blocks of digital transformation ppt powerpoint presentation pictures example. This is a six stage process. The stages in this process are technology, organization, data analytics, process automation, strategy.

Presentation Outline Ppt PowerPoint Presentation Gallery Outline
This is a presentation outline ppt powerpoint presentation gallery outline. This is a ten stage process. The stages in this process are process automation, organization, technology, data and analytics, strategy and innovation.

Business Framework Put Option Long PowerPoint Presentation
Our above diagram helps to represent data graphically. Use this put option long diagram for stock market related topics. This diagram has area for your own text to assist you get your point across.

Green Class Room Board With Two Tags Presentation Template
Green class room board with two text boxes are used to decorate this PPT. This PPT contains the concept of educational data representation. Use this PPT for your education and class room related presentations.
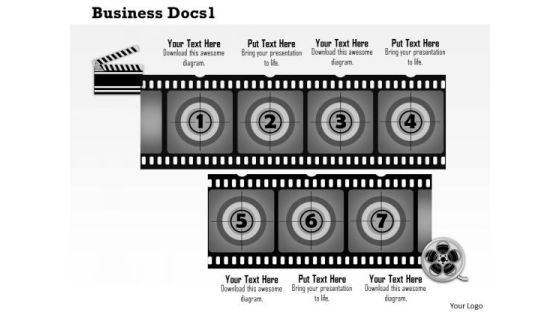
Business Framework Business Docs1 PowerPoint Presentation
Four text boxes with traffic lights are used to decorate this Power Point template slide. This PPT slide contains the concept of data representation. This PPT can be used for business and marketing presentations.
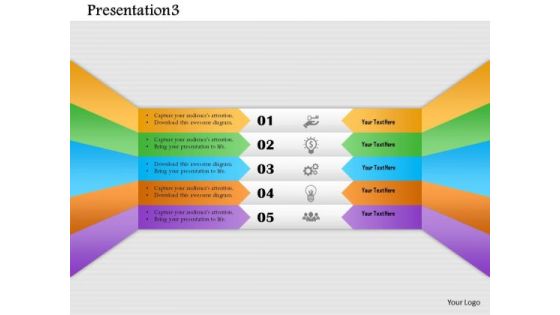
Business Diagram Presentation3 Presentation Template
This business diagram displays five text boxes with icons. This slide is useful for data display. Use this colorful diagram to depict five steps of any business process. It helps in clearly conveying your message to clients and audience.
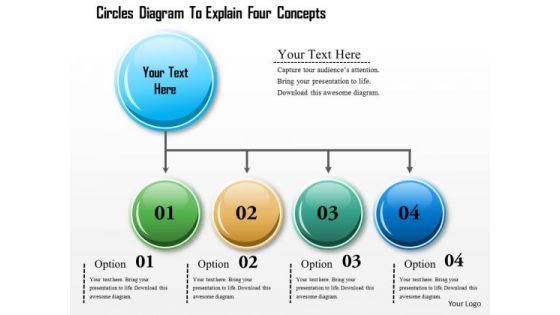
Business Diagram Circles Diagram To Explain Four Concepts Presentation Template
Explain the concept of data flow in any presentation with this unique PPT. This PPT contains the graphic of four staged text boxes. This PPT is suitable for business and sales presentations.
Business Diagram Three Staged Gear Diagram With Icons PowerPoint Template
Graphic of three staged gear and icons diagram has been used to craft this power point template diagram. This PPT contains the concept of data and text representation. Use this PPT diagram for your marketing and management related presentations.
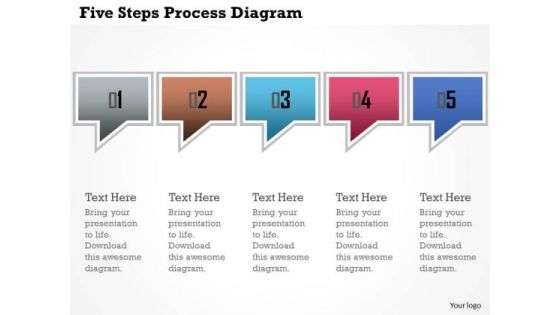
Business Diagram Five Steps Process Diagram Presentation Template
This power point template has been crafted with graphic of five dialogue boxes. This PPT contains the concept of text and data representation. Use this PPT for your business and marketing related presentations.
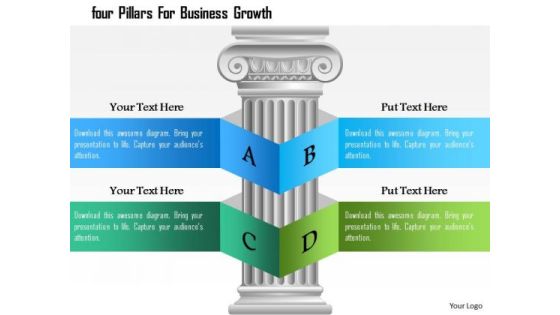
Business Diagram Four Pillars For Business Growth Presentation Template
Concept of text and data representation with business growth has been displayed in this power point template. This PPT contains the graphic of pillar and alphabet ribbons. Use this PPT diagram and get good comments from your viewers.
Business Diagram Three Arrows With Human Icons Presentation Template
This power point template diagram has been designed with graphic of three arrows. This PPT contains the concept of text representation. Use this PPT for business and marketing data related presentations.

Business Diagram Four Semicircular Arrow Diagram Presentation Template
Graphic of four semicircular arrow diagram has been used to craft this power point template diagram. This PPT diagram contains the concept of data and text representation. Use this PPT for marketing and business related presentations.

Business Diagram Circles With Pencils For Business Structures Presentation Template
This business diagram has been designed with graphic of pencils with text circles. This slide helps to depict business data and process. Use this slide to build quality presentations for your viewers.

Business Diagram Colorful Boxes For Business Options Presentation Template
Graphics of colorful text boxes have been used to design this power point template. This diagram contains the concept of data representation. Illustrate your ideas and imprint them in the minds of your team with this template.

Illustration Of Save Money Concept Powerpoint Templates
This business slide has been designed with infographic square. These text boxes can be used for data representation. Use this diagram for your business presentations. Build a quality presentation for your viewers with this unique diagram.

Cylinder With Four Corporate Marketing Steps Powerpoint Template
Our above slide contains graphics of cylinder with four text tags. It may be used to display marketing steps. Use this diagram to impart more clarity to data and to create more sound impact on viewers.

Eight Tags For Business Process Indication Powerpoint Template
Our above PPT slide contains graphics of eight text tags with icons. This PowerPoint template may be used to display business process steps. Use this diagram to impart more clarity to data and to create more sound impact on viewers.

Five Banners For Management Development Process Powerpoint Template
This PowerPoint template has been designed with graphics of five text banners and icons. This diagram may be sued to display management development process. Download this PPT slide to explain complex data immediately and clearly.

Cycle Of Cross Media Overview Diagram Ppt Slides
This is a cycle of cross media overview diagram ppt slides. This is a five stage process. The stages in this process are email, sms, mms text messaging, rich media, landing pages and micro sites, variable data print.
Hands With Bulbs And Two Icons Powerpoint Template
Our above PPT slide contains graphics of hands holding idea bulbs. This business diagram helps to exhibit innovative ideas. Use this diagram to impart more clarity to data and to create more sound impact on viewers.

Arrows With Circles And Idea Bulb Powerpoint Template
Our above slide contains graphics of arrows with circles and idea bulb. It helps to display innovative ideas. Use this diagram to impart more clarity to data and to create more sound impact on viewers.

Profit Growth Graph With Gears Powerpoint Template
This business slide contains profit growth graph with gears. This PowerPoint template helps to display outline of business plan. Use this diagram to impart more clarity to data and to create more sound impact on viewers.

Stock Photo Black Brown Pie Chart For Business Result PowerPoint Slide
This high quality image is designed with pie chart. Use this image to make business reports. Use this outstanding image in presentations relating to data analysis and reports. Go ahead and add charm to your presentations.
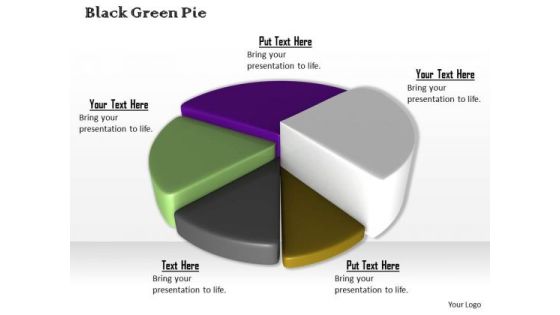
Stock Photo Colorful 3d Pie Chart For Business Result PowerPoint Slide
This high quality image is designed with pie chart. Use this image to make business reports. Use this outstanding image in presentations relating to data analysis and reports. Go ahead and add charm to your presentations.

Business Diagram Six Pie Charts For Result Representation And Percentage Presentation Template
Display the concept of result analysis in your business presentation. This PPT slide contains the graphic of six pie charts. Use this PPT slide for your business and marketing data related presentations.
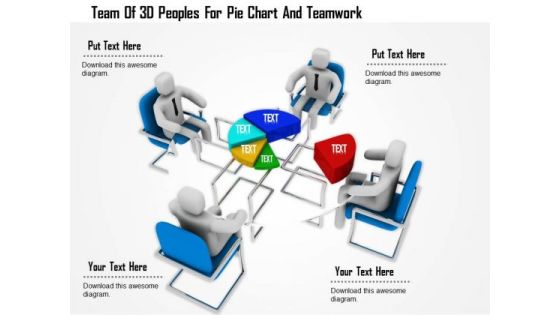
Team Of 3d Peoples For Pie Chart And Teamwork
This Power Point template has been designed with graphic of 3d team forming a pie chart. In this slide team is displaying data analysis. Use this editable slide to build innovative presentation for your viewers.

Team With Bar Graph And Teamwork
This Power Point template has been designed with graphic of 3d team forming a pie chart. In this slide team is displaying data analysis and comparison. Use this editable slide to build innovative presentation for your viewers.

Business Diagram 3d Venn Diagram For Global Business Project Presentation Template
This business diagram displays 3d Venn diagram. This editable slide is suitable to present business reports. Use this diagram for business and finance related topics and display complete data analysis in your presentation.

Business Framework 10 Percent To 90 Percent PowerPoint Presentation
This business diagram has been designed with graphic of multiple pie graphs. This diagram slide contains the concept of result analysis with percentage values. Use this diagram to present and compare data in an impressive manner

Business Framework Golden Circle PowerPoint Presentation
This business diagram has been designed with graphic of blue colored circle. This business slide is suitable to display data analysis in any business presentation. Use this slide to build a unique presentations for your viewers

Business Diagram Business People Over Bar Chart PowerPoint Template
This Power Point template has been designed with graphic of business people and bar chart. This PPT contains the concept of result analysis and business data display. Use this PPT slide for your business and marketing related presentations.
Business Diagram Icons And Charts For Business Growth Presentation Template
Our above slide contains graphics of business charts and icons. It helps to display business reports and analysis. Use this diagram to impart more clarity to data and to create more sound impact on viewers.

Chart Of Four Business Steps Powerpoint Templates
This business diagram displays flow of four business steps. This editable slide is suitable to present growth management. Use this diagram for business and finance related topics and display complete data analysis in your presentation.

Circles With Percentage Values Powerpoint Templates
This PowerPoint template displays circles with percentage values. This business diagram is suitable for financial data analysis. Use this business diagram slide to highlight the key issues of your presentation.

Flower Diagram For Educational Training Powerpoint Template
Colorful flowers have been used to design this PowerPoint diagram. This colorful PPT slide may be used for educational training. You can use this design for data analysis in business presentations

Four Tags For Strategy Planning Process Powerpoint Template
Steps for strategy planning can be explained with this diagram. This PowerPoint template contains diagram of four infographic tags. You can also use this design for data analysis in business presentations
Six Staged Infographics Square With Business Icons Powerpoint Templates
This business diagram displays circular puzzle infographic. This editable slide is suitable to present global communication. Use this diagram for business and finance related topics and display complete data analysis in your presentation.

Bar Graph For Marketing Research Process Powerpoint Slides
This PowerPoint template has been designed with diagram of bar graph. This PPT slide can be used to prepare presentations for profit growth report and also for financial data analysis. You can download finance PowerPoint template to prepare awesome presentations.

Circle Diagram For Business Marketing Mix Powerpoint Slides
This PowerPoint template has been designed with nine steps circle chart. This PPT slide can be used to prepare presentations for profit growth report and also for financial data analysis. You can download finance PowerPoint template to prepare awesome presentations.
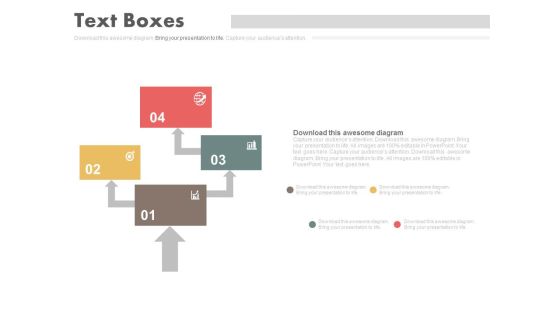
Four Steps Arrow Chart Design Powerpoint Slides
This PowerPoint template has been designed with four steps arrow chart. This PPT slide can be used to prepare presentations for marketing reports and also for financial data analysis. You can download finance PowerPoint template to prepare awesome presentations.

Venn Business Chart With Percentage Value Powerpoint Template
This PPT slide contains Venn business chart with percentage values. This PPT diagram is suitable to present data comparison and analysis. Enlighten others on the process with this innovative PowerPoint template.

Four Steps Circular Infographic Powerpoint Templates
Our above slide contains diagram of three stage circular infographic. It helps to display global business analysis. Use this diagram to impart more clarity to data and to create more sound impact on viewers.
Four Circles Venn Diagram With Icons Powerpoint Slides
Four circles Venn diagram has been used to design this power point template. This PPT helps to portray the concept of business data analysis. Use this PPT for your business and marketing related presentations.
Two Circles Venn Diagram With Icons Powerpoint Slides
Venn diagram of two circles has been used to design this power point template. This PPT helps to portray the concept of business data analysis. Use this PPT for your business and marketing related presentations.

Curve Line Diagram With Icons Powerpoint Template
Our above slide contains diagram of curve line infographic. This infographic slide helps to exhibit business analysis. Use this diagram to impart more clarity to data and to create more sound impact on viewers.
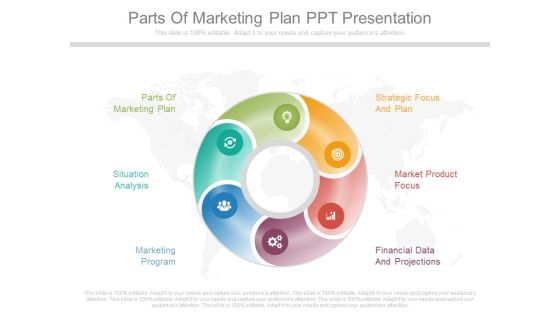
Parts Of Marketing Plan Ppt Presentation
This is a parts of marketing plan ppt presentation. This is a six stage process. The stages in this process are parts of marketing plan, strategic focus and plan, situation analysis, market product focus, marketing program, financial data and projections.

Continuous Auditing Steps Powerpoint Templates
This is a continuous auditing steps powerpoint templates. This is a five stage process. The stages in this process are data analysis, applied analytics, managed analytics, continuous auditing, continuous monitoring.


 Continue with Email

 Home
Home


