Data Architecture Diagram

Dashboard Showing Digital Marketing Campaign Report Ppt Infographic Template Template PDF
This slide represents the campaign report of digital marketing which includes total spend , impressions , clicks , acquisitions, cost per action that results in analyzing marketing efforts to improve market share of business. Pitch your topic with ease and precision using this Dashboard Showing Digital Marketing Campaign Report Ppt Infographic Template Template PDF. This layout presents information on Customer Acquisition, Total Impressions, Total Clicks, Total Acquisition. It is also available for immediate download and adjustment. So, changes can be made in the color, design, graphics or any other component to create a unique layout.
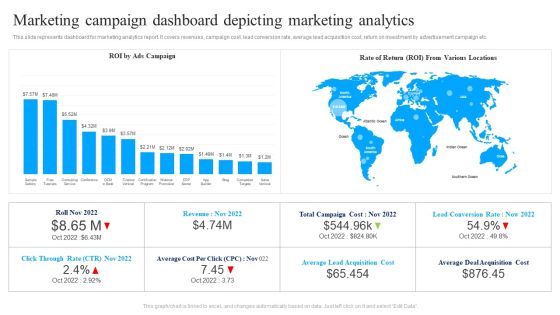
Marketing Campaign Dashboard Depicting Marketing Analytics Ppt Summary Infographics PDF
This slide represents dashboard for marketing analytics report. It covers revenues, campaign cost, lead conversion rate, average lead acquisition cost, return on investment by advertisement campaign etc. Pitch your topic with ease and precision using this Marketing Campaign Dashboard Depicting Marketing Analytics Ppt Summary Infographics PDF. This layout presents information on ROI Ads Campaign, Rate Of Return, Various Locations. It is also available for immediate download and adjustment. So, changes can be made in the color, design, graphics or any other component to create a unique layout.

Marketing Dashboard To Track Marketing Progress Ppt Tips PDF
This slide represents dashboard to track marketing campaign progress. It includes advertisement costs , total clicks, click-through rate, conversion rate, cost per thousand impression etc. Pitch your topic with ease and precision using this Marketing Dashboard To Track Marketing Progress Ppt Tips PDF. This layout presents information on Total Clicks, Total Impression, Total Conversion Rate, Cost Per Click. It is also available for immediate download and adjustment. So, changes can be made in the color, design, graphics or any other component to create a unique layout.
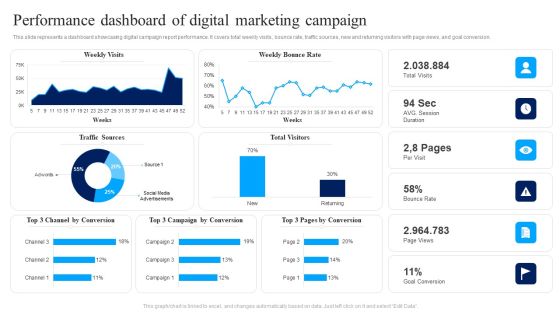
Performance Dashboard Of Digital Marketing Campaign Ppt Show Slide PDF
This slide represents a dashboard showcasing digital campaign report performance. It covers total weekly visits, bounce rate, traffic sources, new and returning visitors with page views, and goal conversion. Pitch your topic with ease and precision using this Performance Dashboard Of Digital Marketing Campaign Ppt Show Slide PDF. This layout presents information on Weekly Visits, Weekly Bounce Rate, Bounce Rate. It is also available for immediate download and adjustment. So, changes can be made in the color, design, graphics or any other component to create a unique layout.

Effect Of Pandemic On Remote Education Learning Platforms Sample PDF
The slide contains various remote learning platforms used by different income-level groups to face COVID effects. Various platforms included are online and broadcasts, television, radio, etc. Pitch your topic with ease and precision using this Effect Of Pandemic On Remote Education Learning Platforms Sample PDF. This layout presents information on Pandemic Situation, High Income Level, Technical Platforms. It is also available for immediate download and adjustment. So, changes can be made in the color, design, graphics or any other component to create a unique layout.

Leadership Recruitment Dashboard With Recruitment Funnel Slides PDF
The slide shows a dashboard for managing recruitment process of an organization for leadership hiring. It includes cost of hiring by different levels, turnover rate by different age groups, hiring funnel and average time taken by each department for hiring. Pitch your topic with ease and precision using this Leadership Recruitment Dashboard With Recruitment Funnel Slides PDF. This layout presents information on Leadership Recruitment, Dashboard With Recruitment. It is also available for immediate download and adjustment. So, changes can be made in the color, design, graphics or any other component to create a unique layout.

Vendor Contracts And Compliance Management Dashboard Effective Vendor Management For Enhancing Download PDF
The following slide represents vendor contracts and compliance management dashboard. It provides information about open risks, contracts, contract renewals, categories, contract concentration, etc. Get a simple yet stunning designed Vendor Contracts And Compliance Management Dashboard Effective Vendor Management For Enhancing Download PDF. It is the best one to establish the tone in your meetings. It is an excellent way to make your presentations highly effective. So, download this PPT today from Slidegeeks and see the positive impacts. Our easy-to-edit Vendor Contracts And Compliance Management Dashboard Effective Vendor Management For Enhancing Download PDF can be your go-to option for all upcoming conferences and meetings. So, what are you waiting for Grab this template today.
Rebranding Project Progress Tracking Dashboard Strategies For Rebranding Without Losing Template PDF
This slide provides information regarding essential characteristics of co branding in terms of strategic partnership, build credibility, developing marketing strategy, develop innovation and value addition, etc. If your project calls for a presentation, then Slidegeeks is your go-to partner because we have professionally designed, easy-to-edit templates that are perfect for any presentation. After downloading, you can easily edit Rebranding Project Progress Tracking Dashboard Strategies For Rebranding Without Losing Template PDF and make the changes accordingly. You can rearrange slides or fill them with different images. Check out all the handy templates
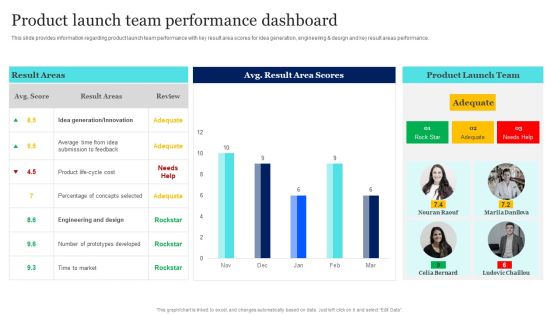
New Product Launch To Market Playbook Product Launch Team Performance Dashboard Introduction PDF
This slide provides information regarding product launch team performance with key result area scores for idea generation, engineering and design and key result areas performance. From laying roadmaps to briefing everything in detail, our templates are perfect for you. You can set the stage with your presentation slides. All you have to do is download these easy to edit and customizable templates. New Product Launch To Market Playbook Product Launch Team Performance Dashboard Introduction PDF will help you deliver an outstanding performance that everyone would remember and praise you for. Do download this presentation today.
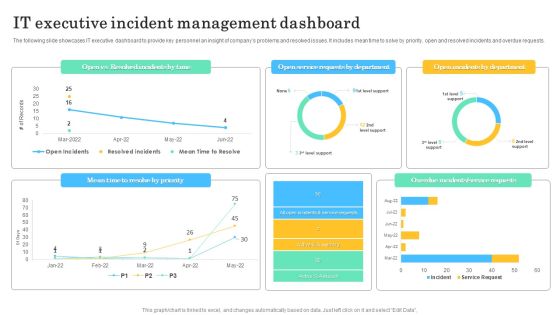
IT Executive Incident Management Dashboard Microsoft PDF
The following slide showcases IT executive dashboard to provide key personnel an insight of companys problems and resolved issues. It includes mean time to solve by priority, open and resolved incidents and overdue requests. Pitch your topic with ease and precision using this IT Executive Incident Management Dashboard Microsoft PDF. This layout presents information on IT Executive Incident, Management Dashboard. It is also available for immediate download and adjustment. So, changes can be made in the color, design, graphics or any other component to create a unique layout.
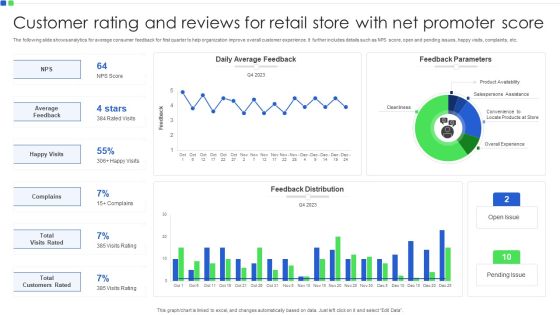
Customer Rating And Reviews For Retail Store With Net Promoter Score Demonstration PDF
The following slide shows analytics for average consumer feedback for first quarter to help organization improve overall customer experience. It further includes details such as NPS score, open and pending issues, happy visits, complaints, etc. Pitch your topic with ease and precision using this Customer Rating And Reviews For Retail Store With Net Promoter Score Demonstration PDF. This layout presents information on Average Feedback, Happy Visits, Complains. It is also available for immediate download and adjustment. So, changes can be made in the color, design, graphics or any other component to create a unique layout.
Safety And Health Kpis For Tracking Performance Graph Mockup PDF
This slide represents graph showing key performance indicators tracked by companies for assessment of safety and health performance of their workplace. It includes key metrics such as workforce awareness, safety meetings held, recordable injuries, lost work days, compliance, severity rates etc. Pitch your topic with ease and precision using this Safety And Health Kpis For Tracking Performance Graph Mockup PDF. This layout presents information on Safety And Health, Kpis For Tracking, Performance Graph. It is also available for immediate download and adjustment. So, changes can be made in the color, design, graphics or any other component to create a unique layout.

Safety Team Performance Management Dashboard With Key Kpis Rules PDF
This slide shows a dashboard representing performance measurement of the safety team of the organization on the basis of key performance indicators. It includes details related to safety team performance ranking, average result area scores etc. Pitch your topic with ease and precision using this Safety Team Performance Management Dashboard With Key Kpis Rules PDF. This layout presents information on Improve Corrective Actions, Safety Manager Objective, Conduct Risk Assessment. It is also available for immediate download and adjustment. So, changes can be made in the color, design, graphics or any other component to create a unique layout.

Research Team Members Performance Evaluation Summary Portrait PDF
This slide shows the report prepared by the director of research team of an organization in order to evaluate the performance of his team members which would help him in taking decision regarding their promotion to higher positions. Pitch your topic with ease and precision using this Research Team Members Performance Evaluation Summary Portrait PDF. This layout presents information on Research Team Members, Performance Evaluation Summary. It is also available for immediate download and adjustment. So, changes can be made in the color, design, graphics or any other component to create a unique layout.
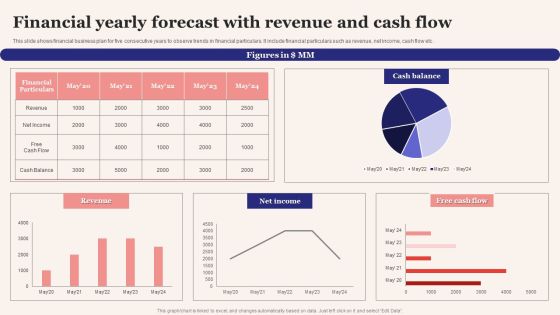
Financial Yearly Forecast With Revenue And Cash Flow Formats PDF
This slide shows financial business plan for five consecutive years to observe trends in financial particulars. It include financial particulars such as revenue, net income, cash flow etc. Pitch your topic with ease and precision using this Financial Yearly Forecast With Revenue And Cash Flow Formats PDF. This layout presents information on Financial Particulars, Cash Balance, Free Cash Flow. It is also available for immediate download and adjustment. So, changes can be made in the color, design, graphics or any other component to create a unique layout.

Category Wise Operation Expenses Of The Company Topics PDF
This slide displays the division of operating expenses that a company is incurring in the three financial years 2020,2021 and 2022 to compare the different expense on multiple steps.Pitch your topic with ease and precision using this Category Wise Operation Expenses Of The Company Topics PDF. This layout presents information on Travelling Expenses, Increased Restrictions, Relaxation. It is also available for immediate download and adjustment. So, changes can be made in the color, design, graphics or any other component to create a unique layout.

Engineering Performance Metrics Dashboard To Track Pull Requests Background PDF
This slide covers engineering KPI dashboard to track pull request. It involves KPIs such as open time of average pull requests, average comment received, revision rounds, frequency of posting pull requests. Pitch your topic with ease and precision using this Engineering Performance Metrics Dashboard To Track Pull Requests Background PDF. This layout presents information on Dashboard Track Pull Requests, Engineering Performance Metrics. It is also available for immediate download and adjustment. So, changes can be made in the color, design, graphics or any other component to create a unique layout.
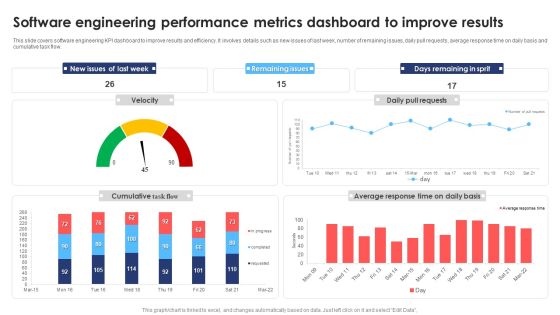
Software Engineering Performance Metrics Dashboard To Improve Results Infographics PDF
This slide covers software engineering KPI dashboard to improve results and efficiency. It involves details such as new issues of last week, number of remaining issues, daily pull requests, average response time on daily basis and cumulative task flow. Pitch your topic with ease and precision using this Software Engineering Performance Metrics Dashboard To Improve Results Infographics PDF. This layout presents information on Software Engineering Performance, Metrics Dashboard Improve Results. It is also available for immediate download and adjustment. So, changes can be made in the color, design, graphics or any other component to create a unique layout.
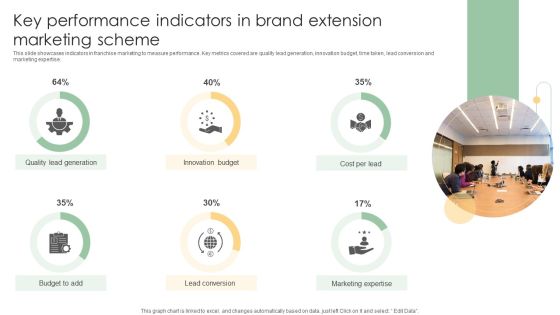
Key Performance Indicators In Brand Extension Marketing Scheme Ideas PDF
This slide showcases indicators in franchise marketing to measure performance. Key metrics covered are quality lead generation, innovation budget, time taken, lead conversion and marketing expertise.Pitch your topic with ease and precision using this Key Performance Indicators In Brand Extension Marketing Scheme Ideas PDF. This layout presents information on Quality Lead Generation, Innovation Budget, Lead Conversion. It is also available for immediate download and adjustment. So, changes can be made in the color, design, graphics or any other component to create a unique layout.
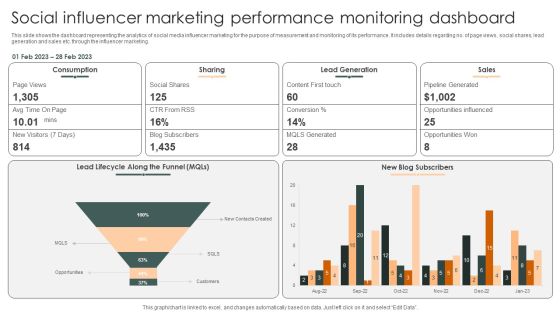
Social Influencer Marketing Performance Monitoring Dashboard Slides PDF
This slide shows the dashboard representing the analytics of social media influencer marketing for the purpose of measurement and monitoring of its performance. It includes details regarding no. of page views, social shares, lead generation and sales etc. through the influencer marketing.Pitch your topic with ease and precision using this Social Influencer Marketing Performance Monitoring Dashboard Slides PDF. This layout presents information on Lead Generation, Pipeline Generated, Opportunities Influenced. It is also available for immediate download and adjustment. So, changes can be made in the color, design, graphics or any other component to create a unique layout.
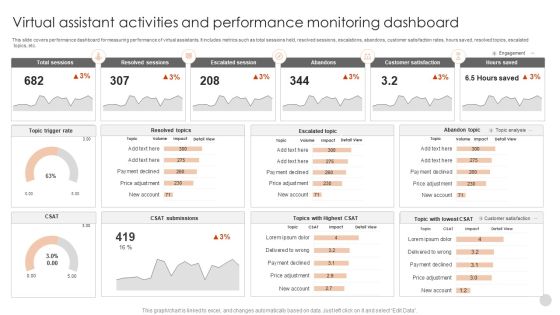
Virtual Assistant Activities And Performance Monitoring Dashboard Guidelines PDF
This slide covers performance dashboard for measuring performance of virtual assistants. It includes metrics such as total sessions held, resolved sessions, escalations, abandons, customer satisfaction rates, hours saved, resolved topics, escalated topics, etc.Pitch your topic with ease and precision using this Virtual Assistant Activities And Performance Monitoring Dashboard Guidelines PDF. This layout presents information on Total Sessions, Resolved Sessions, Escalated Session. It is also available for immediate download and adjustment. So, changes can be made in the color, design, graphics or any other component to create a unique layout.
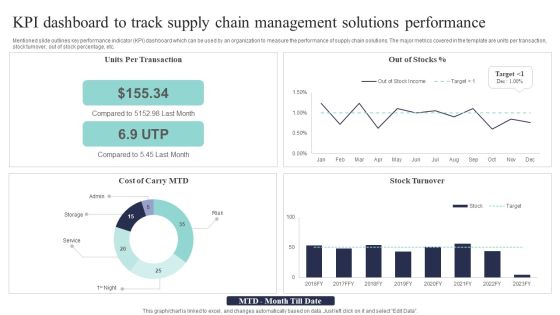
KPI Dashboard To Track Supply Chain Management Solutions Performance Background PDF
Mentioned slide outlines key performance indicator KPI dashboard which can be used by an organization to measure the performance of supply chain solutions. The major metrics covered in the template are units per transaction, stock turnover, out of stock percentage, etc. Pitch your topic with ease and precision using this KPI Dashboard To Track Supply Chain Management Solutions Performance Background PDF. This layout presents information on Per Transaction, Compared Last, Stock Turnover. It is also available for immediate download and adjustment. So, changes can be made in the color, design, graphics or any other component to create a unique layout.

Plant Safety Measures Dashboard With Incidents Work Accidents And Near Misses Template PDF
This slide showcases dashboard to monitor plant safety measures performance indicators. Key metrics covered are incident and injury type, root cause, location, contributing factor, employees at risk and investigation. Pitch your topic with ease and precision using this Plant Safety Measures Dashboard With Incidents Work Accidents And Near Misses Template PDF. This layout presents information on Plant Safety Measures Dashboard, Incidents Work Accidents. It is also available for immediate download and adjustment. So, changes can be made in the color, design, graphics or any other component to create a unique layout.

Leveraging Twitter For Social Lead Generation Forecast For Twitter Campaigns Download PDF
This slide provides information regarding steps to successful run twitter lead generation campaign such as setup conversion tracking, choose campaign ads type, adjust twitter ad targeting option etc. If your project calls for a presentation, then Slidegeeks is your go-to partner because we have professionally designed, easy-to-edit templates that are perfect for any presentation. After downloading, you can easily edit Leveraging Twitter For Social Lead Generation Forecast For Twitter Campaigns Download PDF and make the changes accordingly. You can rearrange slides or fill them with different images. Check out all the handy templates

Logistics KPI Dashboard For Supply Chain Management To Enhance Logistics Operations Professional PDF
This slide displays the logistics dashboard for monitoring and reporting warehouse operations and transportation processes. It include KPIs such as revenue, shipments, avg delivery time, fleet status, delivery status, average loading time and weight, etc. Pitch your topic with ease and precision using this Logistics KPI Dashboard For Supply Chain Management To Enhance Logistics Operations Professional PDF. This layout presents information on Logistics KPI, Dashboard For Supply Chain, Management To Enhance, Logistics Operations. It is also available for immediate download and adjustment. So, changes can be made in the color, design, graphics or any other component to create a unique layout.
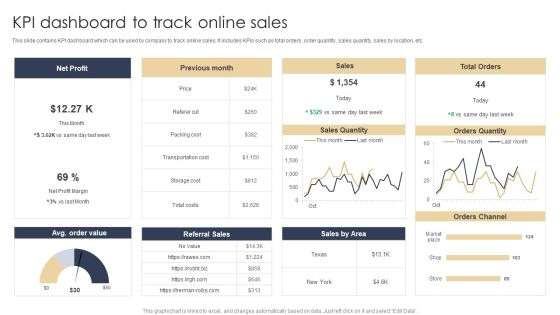
KPI Dashboard To Track Online Sales Structure PDF
This slide contains KPI dashboard which can be used by company to track online sales. It includes KPIs such as total orders, order quantity, sales quantity, sales by location, etc. Pitch your topic with ease and precision using this KPI Dashboard To Track Online Sales Structure PDF. This layout presents information on Net Profit, Sales, Orders Quantity. It is also available for immediate download and adjustment. So, changes can be made in the color, design, graphics or any other component to create a unique layout.

HR Organizational Expense Budget Priorities Template PDF
The following slide depicts the HR budget priorities to take key decisions whether to expand, maintain or contract expense allocation in human resource activities. It constitutes of activities such as recruitment, selection, training and development, payroll, employee health and safety etc. Pitch your topic with ease and precision using this HR Organizational Expense Budget Priorities Template PDF. This layout presents information on Budget, Development Activities, Fund Allocation. It is also available for immediate download and adjustment. So, changes can be made in the color, design, graphics or any other component to create a unique layout.
Project Tracking Bug And Progress Tracker Dashboard Elements PDF
The following slide showcases the progress status of project tracking activities to achieve objectives. It constitutes of elements such as number of projects, features, work items, number of bugs along with the progress status etc. Pitch your topic with ease and precision using this Project Tracking Bug And Progress Tracker Dashboard Elements PDF. This layout presents information on Project Tracking, Progress Tracker Dashboard. It is also available for immediate download and adjustment. So, changes can be made in the color, design, graphics or any other component to create a unique layout.
Project Tracking Planned Vs Actual Project Progress Tracker Pictures PDF
The following slide highlights the variations in the project progress to manage the its and ensure timely delivery. It includes KPIs such as completion percentage and the gap in the planned versus actual hours. Pitch your topic with ease and precision using this Project Tracking Planned Vs Actual Project Progress Tracker Pictures PDF. This layout presents information on Project Tracking Planned, Project Progress Tracker. It is also available for immediate download and adjustment. So, changes can be made in the color, design, graphics or any other component to create a unique layout.

KPI Dashboard To Evaluate Growth In Sales Funnel Reporting Topics PDF
This slide represents the KPI dashboard to measure sales pipeline reporting for increasing customer conversion rate. It includes activity by representative, forecast by month and monthly growth. Pitch your topic with ease and precision using this KPI Dashboard To Evaluate Growth In Sales Funnel Reporting Topics PDF. This layout presents information on Pipeline Requirement, Key Activities, Pipeline Closed Date. It is also available for immediate download and adjustment. So, changes can be made in the color, design, graphics or any other component to create a unique layout.

Region Wise Stock Performance Management Dashboard Introduction PDF
This slide shows regional inventory performance management dashboard that give insights areas to be worked upon for increasing sales. It includes yearly growth rate, monthly sales trends and city wise sales trends etc. Pitch your topic with ease and precision using this Region Wise Stock Performance Management Dashboard Introduction PDF. This layout presents information on Stock Performance, Management Dashboard. It is also available for immediate download and adjustment. So, changes can be made in the color, design, graphics or any other component to create a unique layout.
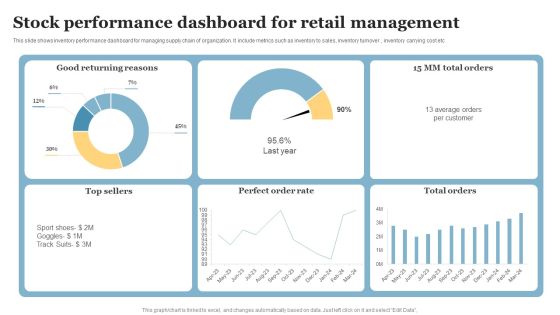
Stock Performance Dashboard For Retail Management Pictures PDF
This slide shows inventory performance dashboard for managing supply chain of organization. It include metrics such as inventory to sales, inventory turnover , inventory carrying cost etc. Pitch your topic with ease and precision using this Stock Performance Dashboard For Retail Management Pictures PDF. This layout presents information on Good Returning Reasons, Perfect Order Rate, Top Sellers. It is also available for immediate download and adjustment. So, changes can be made in the color, design, graphics or any other component to create a unique layout.

Supply Chain Stock Performance Metrics Dashboard Mockup PDF
This slide shows supply chain inventory performance dashboard for analyzing supply trends over the years. It include metric such as inventory turnover, Percent of stock items and carrying cot MTD etc . Pitch your topic with ease and precision using this Supply Chain Stock Performance Metrics Dashboard Mockup PDF. This layout presents information on Supply Chain Stock, Performance Metrics Dashboard. It is also available for immediate download and adjustment. So, changes can be made in the color, design, graphics or any other component to create a unique layout.

Strategies To Improve Staff Retention Rate Brochure PDF
This slide covers various methods to increase retention rate of workforce in an organization. It includes strategies such as work life balance promotion, quarterly employees appraisal and change management training of employees. Pitch your topic with ease and precision using this Strategies To Improve Staff Retention Rate Brochure PDF. This layout presents information on Strategies Improve, Staff Retention Rate. It is also available for immediate download and adjustment. So, changes can be made in the color, design, graphics or any other component to create a unique layout.
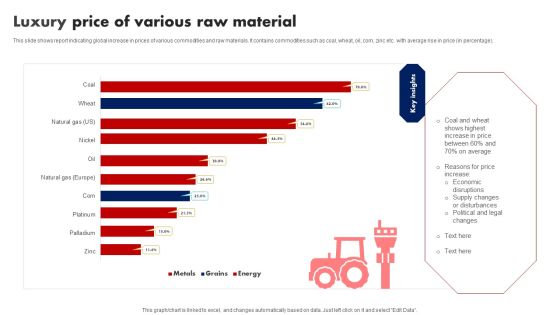
Luxury Price Of Various Raw Material Ppt Professional Outline PDF
This slide shows report indicating global increase in prices of various commodities and raw materials. It contains commodities such as coal, wheat, oil, corn, zinc etc. with average rise in price in percentage. Pitch your topic with ease and precision using this Luxury Price Of Various Raw Material Ppt Professional Outline PDF. This layout presents information on Coal And Wheat, Increase Price, Price Increase. It is also available for immediate download and adjustment. So, changes can be made in the color, design, graphics or any other component to create a unique layout.
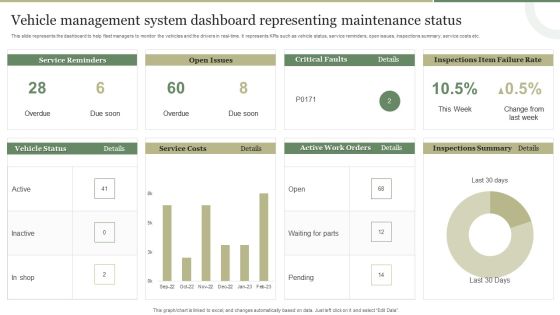
Vehicle Management System Dashboard Representing Maintenance Status Template PDF
This slide represents the dashboard representing the key metrics of the vehicle management system to monitor the vehicles and drivers in real-time. It includes key metrics such as service reminders, fuel costs, open issues, recent comments etc. Pitch your topic with ease and precision using this Vehicle Management System Dashboard Representing Maintenance Status Template PDF This layout presents information on Fuel Costs, Total Cost, Service Reminder, Recent Comments. It is also available for immediate download and adjustment. So, changes can be made in the color, design, graphics or any other component to create a unique layout.

Vehicle Management System Dashboard Graphics PDF
This slide represents the dashboard to help fleet managers to monitor the vehicles and the drivers in real-time. It represents KPIs such as vehicle status, service reminders, open issues, inspections summary, service costs etc. Pitch your topic with ease and precision using this Vehicle Management System Dashboard Graphics PDF. This layout presents information on Vehicle Management System, Representing Maintenance Status. It is also available for immediate download and adjustment. So, changes can be made in the color, design, graphics or any other component to create a unique layout.
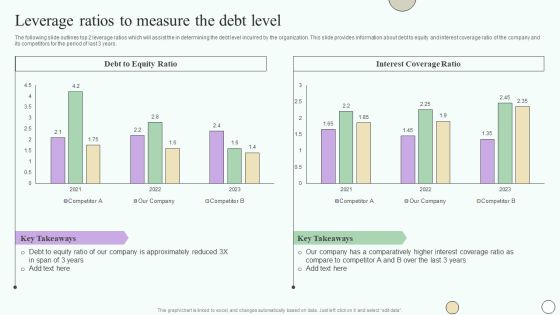
Estimating Business Overall Leverage Ratios To Measure The Debt Level Professional PDF
The following slide outlines top 2 leverage ratios which will assist the in determining the debt level incurred by the organization. This slide provides information about debt to equity and interest coverage ratio of the company and its competitors for the period of last 3 years. If your project calls for a presentation, then Slidegeeks is your go-to partner because we have professionally designed, easy-to-edit templates that are perfect for any presentation. After downloading, you can easily edit Estimating Business Overall Leverage Ratios To Measure The Debt Level Professional PDF and make the changes accordingly. You can rearrange slides or fill them with different images. Check out all the handy templates.

Marketing Followers Strategic Approach To Reduce Cost Infographics PDF
This slide covers the details of positioning strategies and how market followers have a reduce cost compared to others. The purpose of this template is to analyze market followers, challengers and lease It also includes details related to costing and planning. Pitch your topic with ease and precision using this Marketing Followers Strategic Approach To Reduce Cost Infographics PDF. This layout presents information on Positioning Strategies, Activities, Costing. It is also available for immediate download and adjustment. So, changes can be made in the color, design, graphics or any other component to create a unique layout.

B2b Selling Tactics Dashboard To Maintain Productivity Introduction PDF
The following slide represents B2B selling tactics dashboard which allows executives and managers to effectively control sales and monitor them in one central place. It consists of total sales, payments, trends etc.Pitch your topic with ease and precision using this B2b Selling Tactics Dashboard To Maintain Productivity Introduction PDF. This layout presents information on Operational Effects, Stores Sales Trend, Conversion Rate. It is also available for immediate download and adjustment. So, changes can be made in the color, design, graphics or any other component to create a unique layout.
Multiple Project Progress Tracking Report Dashboard With Key Performance Indicators Brochure PDF
This slide shows the dashboard representing status of various projects and tracking their performance with the help of key performance indicators which are as follows schedule, budget, resources, risk and issues and quality of projects.Pitch your topic with ease and precision using this Multiple Project Progress Tracking Report Dashboard With Key Performance Indicators Brochure PDF. This layout presents information on Risks Issues, Quality Open Defects, Techno Blogger. It is also available for immediate download and adjustment. So, changes can be made in the color, design, graphics or any other component to create a unique layout.

Key Performance Indicators Of The Internal Metrics Audit Function Infographics PDF
This slide defines the graphical representation of internal audit key performance indicators. It is a comparison of the means used to evaluate the performance of the internal audit function. Pitch your topic with ease and precision using this Key Performance Indicators Of The Internal Metrics Audit Function Infographics PDF. This layout presents information on High Variance, Budget To Actual, Audit Functions. It is also available for immediate download and adjustment. So, changes can be made in the color, design, graphics or any other component to create a unique layout.
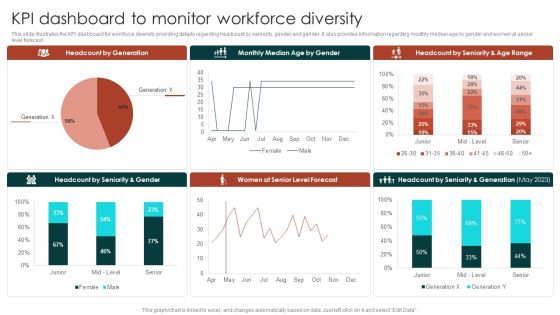
Diversity Management Plan To Improve Workplace Culture KPI Dashboard To Monitor Workforce Microsoft PDF
This slide illustrates the KPI dashboard for workforce diversity providing details regarding headcount by seniority, gender and gender. It also provides information regarding monthly median age by gender and women at senior level forecast.Find a pre-designed and impeccable Diversity Management Plan To Improve Workplace Culture KPI Dashboard To Monitor Workforce Microsoft PDF. The templates can ace your presentation without additional effort. You can download these easy-to-edit presentation templates to make your presentation stand out from others. So, what are you waiting for. Download the template from Slidegeeks today and give a unique touch to your presentation.

Effective Brand Reputation Management Brand Equity Performance Assessment Dashboard Slides PDF
This slide provides information regarding brand equity performance assessment dashboard that highlights customer lifecycle value, customer adoption rate, mentions, engagement, etc. If your project calls for a presentation, then Slidegeeks is your go-to partner because we have professionally designed, easy-to-edit templates that are perfect for any presentation. After downloading, you can easily edit Effective Brand Reputation Management Brand Equity Performance Assessment Dashboard Slides PDF and make the changes accordingly. You can rearrange slides or fill them with different images. Check out all the handy templates.
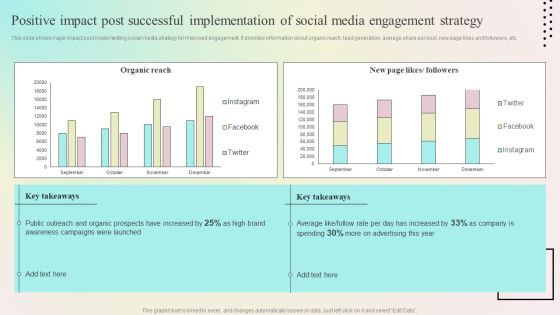
Enhancing Organic Reach Positive Impact Post Successful Implementation Of Social Media Background PDF
This slide shows major impact post implementing social media strategy for improved engagement. It provides information about organic reach, lead generation, average share per post, new page likes and followers, etc. If your project calls for a presentation, then Slidegeeks is your go-to partner because we have professionally designed, easy-to-edit templates that are perfect for any presentation. After downloading, you can easily edit Enhancing Organic Reach Positive Impact Post Successful Implementation Of Social Media Background PDF and make the changes accordingly. You can rearrange slides or fill them with different images. Check out all the handy templates.

Project Tasks Completion Status Summary By Marketing Manager Mockup PDF
This slide shows the report prepared by the marketing teams manager showing the completion status of the marketing teams project. It includes details related to projects health, tasks, progress, time, cost and workload etc. Pitch your topic with ease and precision using thisProject Tasks Completion Status Summary By Marketing Manager Mockup PDF. This layout presents information on Project Tasks, Completion Status, Summary Marketing Manager. It is also available for immediate download and adjustment. So, changes can be made in the color, design, graphics or any other component to create a unique layout.
Successful Brand Management Customer Tracking Dashboard To Monitor Brand Loyalty Elements PDF
This slide provides information brand loyalty tracking dashboard in order to monitor customer engagement, average revenues, new vs. returning visitors performance, etc. This Successful Brand Management Customer Tracking Dashboard To Monitor Brand Loyalty Elements PDF is perfect for any presentation, be it in front of clients or colleagues. It is a versatile and stylish solution for organizing your meetings. The Successful Brand Management Customer Tracking Dashboard To Monitor Brand Loyalty Elements PDF features a modern design for your presentation meetings. The adjustable and customizable slides provide unlimited possibilities for acing up your presentation. Slidegeeks has done all the homework before launching the product for you. So, dont wait, grab the presentation templates today.

Cyber Security Incident Analytics Dashboard With Level Of Security Ppt Ideas Graphics Tutorials PDF
The given slide depicts the cyber threat analytics to track the attacks. It includes the no. of incidents, open and solved tickets, category wise no. of incidents along with malware type etc. Pitch your topic with ease and precision using this Cyber Security Incident Analytics Dashboard With Level Of Security Ppt Ideas Graphics Tutorials PDF. This layout presents information on Power Security Team, Open Incidents, Incidents Solved, Open Tickets. It is also available for immediate download and adjustment. So, changes can be made in the color, design, graphics or any other component to create a unique layout.
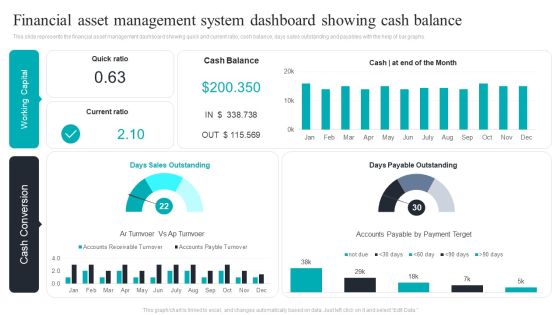
Financial Asset Management System Dashboard Showing Cash Balance Download PDF
This slide represents the financial asset management dashboard showing quick and current ratio, cash balance, days sales outstanding and payables with the help of bar graphs. Pitch your topic with ease and precision using this Financial Asset Management System Dashboard Showing Cash Balance Download PDF. This layout presents information on Financial Asset, Management System, Dashboard Showing, Cash Balance. It is also available for immediate download and adjustment. So, changes can be made in the color, design, graphics or any other component to create a unique layout.
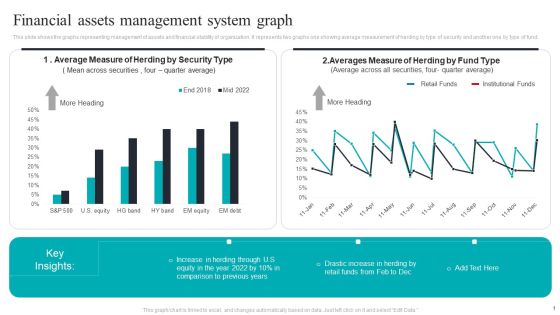
Financial Assets Management System Graph Structure PDF
This slide shows the graphs representing management of assets and financial stability of organization. It represents two graphs one showing average measurement of herding by type of security and another one by type of fund. Pitch your topic with ease and precision using this Financial Assets Management System Graph Structure PDF. This layout presents information on Financial Assets, Management System Graph. It is also available for immediate download and adjustment. So, changes can be made in the color, design, graphics or any other component to create a unique layout.

Consumer Risk Assessment Dashboard Reporting Ppt Layouts Ideas PDF
This slide showcases the customer risk assessment dashboard with major kpis. It includes reporting risks summary, risk mitigation, risk profile, and detail. It also reflects the risk score and score distribution across different areas and activities. Pitch your topic with ease and precision using this Consumer Risk Assessment Dashboard Reporting Ppt Layouts Ideas PDF. This layout presents information on Risk Summary, Customer Risk Dashboard, Risk Profile. It is also available for immediate download and adjustment. So, changes can be made in the color, design, graphics or any other component to create a unique layout.

Advantages Of Consumer Level Risk Assessment And Management For Banks Infographics PDF
This slide highlights the implemention of customer level risk assessment and management by banks. it includes the transformation of customer centric retail strategy from product based risk management and operations of traditional banking to bank wide holistic customer oriented customer level management. Pitch your topic with ease and precision using this Advantages Of Consumer Level Risk Assessment And Management For Banks Infographics PDF. This layout presents information on Reduced Risk, Increased Profits, Accelerated Marketing. It is also available for immediate download and adjustment. So, changes can be made in the color, design, graphics or any other component to create a unique layout.

Risk Assessment Project Portfolio Roadmap And Health Status Summary Mockup PDF
This slide covers timeline and health status report for risk assessment project. It includes KPIs such as BRMS build, customer support, risk assess, credit research and rules engine. Pitch your topic with ease and precision using this Risk Assessment Project Portfolio Roadmap And Health Status Summary Mockup PDF. This layout presents information on Risk Assessment Project, Portfolio Roadmap, Health Status Summary. It is also available for immediate download and adjustment. So, changes can be made in the color, design, graphics or any other component to create a unique layout.
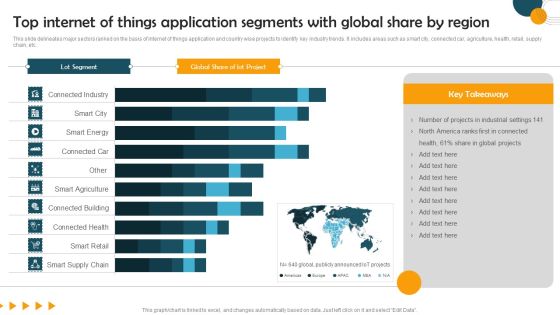
Top Internet Of Things Application Segments With Global Share By Region Formats PDF
This slide delineates major sectors ranked on the basis of internet of things application and country wise projects to identify key industry trends. It includes areas such as smart city, connected car, agriculture, health, retail, supply chain, etc. Pitch your topic with ease and precision using this Top Internet Of Things Application Segments With Global Share By Region Formats PDF. This layout presents information on Lot Segment, Global Share, lot Project. It is also available for immediate download and adjustment. So, changes can be made in the color, design, graphics or any other component to create a unique layout.
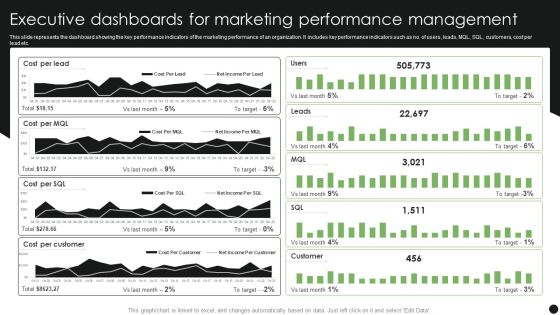
Executive Dashboards For Marketing Performance Management Slides PDF
This slide represents the dashboard showing the key performance indicators of the marketing performance of an organization. It includes key performance indicators such as no. of users, leads, MQL, SQL, customers, cost per lead etc. Pitch your topic with ease and precision using this Executive Dashboards For Marketing Performance Management Slides PDF. This layout presents information on Cost Per Lead, Cost Per Customer. It is also available for immediate download and adjustment. So, changes can be made in the color, design, graphics or any other component to create a unique layout.

Executive Dashboards To Track Sales Performance Guidelines PDF
This slide represents the CEO dashboard for tracking the sales performance of the organization. It includes key performance indicators such as gross, operating and net profit, sales amount by category, income statement etc. Pitch your topic with ease and precision using this Executive Dashboards To Track Sales Performance Guidelines PDF. This layout presents information on Income Statement, Monthly Sales Growth, Days Receivable Outstanding. It is also available for immediate download and adjustment. So, changes can be made in the color, design, graphics or any other component to create a unique layout.

Trade Off Between Profit And Demand For Optimal Price Product Pricing Strategic Guide Rules PDF
This Trade Off Between Profit And Demand For Optimal Price Product Pricing Strategic Guide Rules PDF from Slidegeeks makes it easy to present information on your topic with precision. It provides customization options, so you can make changes to the colors, design, graphics, or any other component to create a unique layout. It is also available for immediate download, so you can begin using it right away. Slidegeeks has done good research to ensure that you have everything you need to make your presentation stand out. Make a name out there for a brilliant performance.
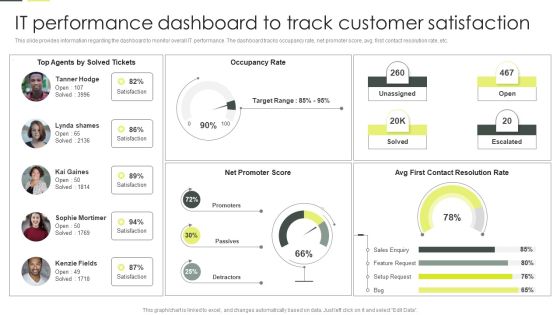
Building An IT Strategy Plan For Business Expansion IT Performance Dashboard To Track Customer Satisfaction Download PDF
This slide provides information regarding the dashboard to monitor overall IT performance. The dashboard tracks occupancy rate, net promoter score, avg. first contact resolution rate, etc. Find a pre designed and impeccable Building An IT Strategy Plan For Business Expansion IT Performance Dashboard To Track Customer Satisfaction Download PDF. The templates can ace your presentation without additional effort. You can download these easy to edit presentation templates to make your presentation stand out from others. So, what are you waiting for Download the template from Slidegeeks today and give a unique touch to your presentation.

Implementing Experimental Marketing Organizing Trade Shows For Audience Attraction And Engagement Clipart PDF
This Implementing Experimental Marketing Organizing Trade Shows For Audience Attraction And Engagement Clipart PDF from Slidegeeks makes it easy to present information on your topic with precision. It provides customization options, so you can make changes to the colors, design, graphics, or any other component to create a unique layout. It is also available for immediate download, so you can begin using it right away. Slidegeeks has done good research to ensure that you have everything you need to make your presentation stand out. Make a name out there for a brilliant performance.
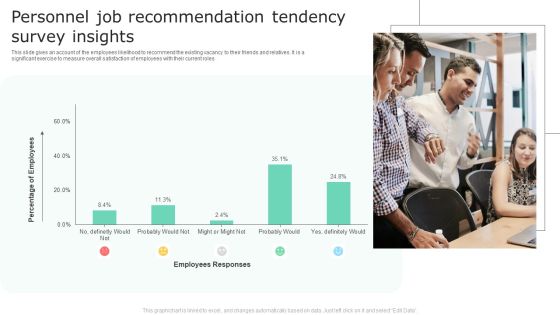
Personnel Job Recommendation Tendency Survey Insights Topics PDF
This slide gives an account of the employees likelihood to recommend the existing vacancy to their friends and relatives. It is a significant exercise to measure overall satisfaction of employees with their current roles. Pitch your topic with ease and precision using this Personnel Job Recommendation Tendency Survey Insights Topics PDF. This layout presents information on Percentage Of Employees, Employees Responses. It is also available for immediate download and adjustment. So, changes can be made in the color, design, graphics or any other component to create a unique layout.
 Home
Home