Data Architecture Diagram
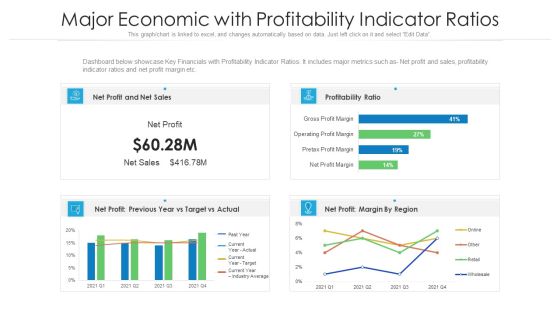
Major Economic With Profitability Indicator Ratios Ppt PowerPoint Presentation Gallery Layouts PDF
Dashboard below showcase Key Financials with Profitability Indicator Ratios. It includes major metrics such as- Net profit and sales, profitability indicator ratios and net profit margin etc. Pitch your topic with ease and precision using this major economic with profitability indicator ratios ppt powerpoint presentation gallery layouts pdf. This layout presents information on sales, profitability ratio, target. It is also available for immediate download and adjustment. So, changes can be made in the color, design, graphics or any other component to create a unique layout.

Companies Implementing Client Life Cycle System Ppt Inspiration Introduction PDF
This slide shows how a customer journey cycle program benefits an organization in terms of increased customer satisfaction, improved average sales cycle time etc. Pitch your topic with ease and precision using this companies implementing client life cycle system ppt inspiration introduction pdf. This layout presents information on return on investment, improved customer satisfaction, average sales cycle. It is also available for immediate download and adjustment. So, changes can be made in the color, design, graphics or any other component to create a unique layout.

Determine Growth Drivers Of Local Advertising Revenue Demonstration PDF
This slide caters details about growth drivers of local advertising revenues in terms of local sources such as advertisement deliveries, new revenues generated through salespeople, etc. Presenting determine growth drivers of local advertising revenue demonstration pdf to provide visual cues and insights. Share and navigate important information on three stages that need your due attention. This template can be used to pitch topics like recurring revenues, advertisements delivery, revenues generated. In addtion, this PPT design contains high resolution images, graphics, etc, that are easily editable and available for immediate download.

Dashboards Showing Consultancy Company Performance With Key Metrics Microsoft PDF
This slide shows the dashboard related to consultancy company performance which includes budget preparation, sales and goals. Company profits and goals etc.Presenting dashboards showing consultancy company performance with key metrics microsoft pdf to provide visual cues and insights. Share and navigate important information on four stages that need your due attention. This template can be used to pitch topics like dashboards showing consultancy company performance with key metrics. In addtion, this PPT design contains high resolution images, graphics, etc, that are easily editable and available for immediate download.
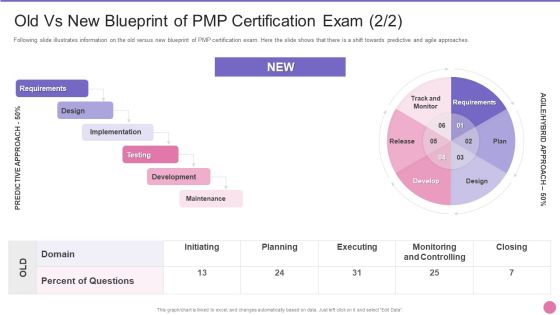
Project Management Professional Certification IT Old Vs New Blueprint Of PMP Certification Exam Initiating Infographics PDF
Following slide illustrates information on the old versus new blueprint of PMP certification exam. Here the slide shows that there is a shift towards predictive and agile approaches. Deliver and pitch your topic in the best possible manner with this project management professional certification it old vs new blueprint of pmp certification exam initiating infographics pdf. Use them to share invaluable insights on requirements, design, implementation, testing, development and impress your audience. This template can be altered and modified as per your expectations. So, grab it now.

Growth Of Ethical Hacking Profession Ppt Infographic Template Templates PDF
This slide represents the growth of the ethical hacking profession, including annual salary, hiring companies, and designation such as information security officer, computer forensics engineer, ethical hacker, and network security engineer. Deliver and pitch your topic in the best possible manner with this growth of ethical hacking profession ppt infographic template templates pdf. Use them to share invaluable insights on growth of ethical hacking profession and impress your audience. This template can be altered and modified as per your expectations. So, grab it now.

Project Delivery Method Dashboard With Service Level Agreement Status Clipart PDF
This slide outlines KPI dashboard which cover details of project delivery metrics. The metrics covered in the dashboard are total investment, revenue generated, total days spent on projects, service level agreement status by individual project etc. Pitch your topic with ease and precision using this project delivery method dashboard with service level agreement status clipart pdf. This layout presents information on project delivery method dashboard with service level agreement status. It is also available for immediate download and adjustment. So, changes can be made in the color, design, graphics or any other component to create a unique layout.

Problem Administration Kpi Dashboard With Bugs Status Ideas PDF
This slide covers dashboard that will help the project managers to keep the track of the bugs faced by the team members during the IT project. Pitch your topic with ease and precision using this problem administration kpi dashboard with bugs status ideas pdf. This layout presents information on problem administration kpi dashboard with bugs status. It is also available for immediate download and adjustment. So, changes can be made in the color, design, graphics or any other component to create a unique layout.
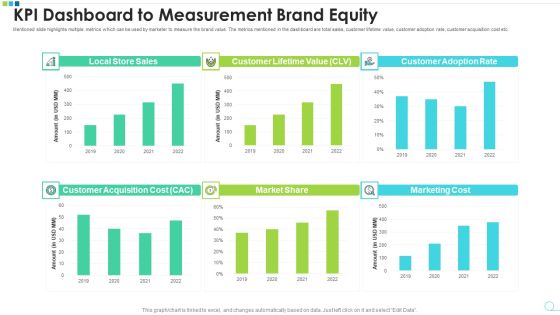
KPI Dashboard To Measurement Brand Equity Microsoft PDF
Mentioned slide highlights multiple metrics which can be used by marketer to measure the brand value. The metrics mentioned in the dashboard are total sales, customer lifetime value, customer adoption rate, customer acquisition cost etc. Pitch your topic with ease and precision using this kpi dashboard to measurement brand equity microsoft pdf. This layout presents information on kpi dashboard to measurement brand equity. It is also available for immediate download and adjustment. So, changes can be made in the color, design, graphics or any other component to create a unique layout.
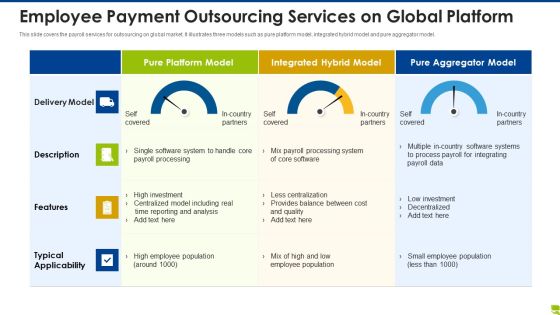
Employee Payment Outsourcing Services On Global Platform Inspiration PDF
This slide covers the payroll services for outsourcing on global market. It illustrates three models such as pure platform model, integrated hybrid model and pure aggregator model. Pitch your topic with ease and precision using this employee payment outsourcing services on global platform inspiration pdf. This layout presents information on employee payment outsourcing services on global platform. It is also available for immediate download and adjustment. So, changes can be made in the color, design, graphics or any other component to create a unique layout.

Project Budget Planning Dashboard With Income Statement Breakdown Professional PDF
This slide covers a dashboard which will help project managers for taking financial business decision by examining the income statement, income statement breakdown, cash flow and internal rate of return. Pitch your topic with ease and precision using this project budget planning dashboard with income statement breakdown professional pdf. This layout presents information on income statement, income statement breakdown, cash flow, internal rate of return . It is also available for immediate download and adjustment. So, changes can be made in the color, design, graphics or any other component to create a unique layout.
Supplier Compensation Due Tracking Dashboard With Paid Invoices Topics PDF
This slide showcases dashboard that can help organization to track the outstanding payment of different vendors and take timely action in case of delay. Its key elements are due by age summary, top 5 vendor by purchases, top 5 vendors by amount due and total invoice vs paid invoices. Pitch your topic with ease and precision using this supplier compensation due tracking dashboard with paid invoices topics pdf. This layout presents information on supplier compensation due tracking dashboard with paid invoices. It is also available for immediate download and adjustment. So, changes can be made in the color, design, graphics or any other component to create a unique layout.

Application Sources For Recruitment On Social Media Tracking Dashboard Microsoft PDF
This slide covers the dashboard for tracking the count of applicants profiles from various sources. It includes the open positions, new roles, total roles, candidates placed , application sources, client decline rates and commission received. Pitch your topic with ease and precision using this application sources for recruitment on social media tracking dashboard microsoft pdf. This layout presents information on application sources for recruitment on social media tracking dashboard. It is also available for immediate download and adjustment. So, changes can be made in the color, design, graphics or any other component to create a unique layout.
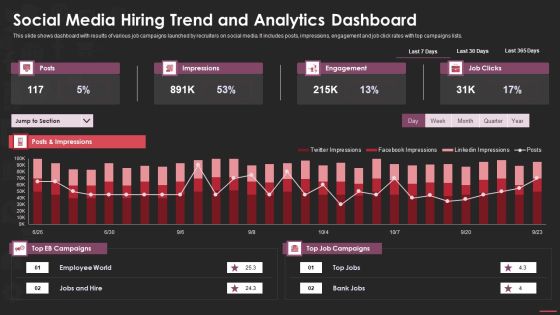
Social Media Hiring Trend And Analytics Dashboard Microsoft PDF
This slide shows dashboard with results of various job campaigns launched by recruiters on social media. It includes posts, impressions, engagement and job click rates with top campaigns lists. Pitch your topic with ease and precision using this social media hiring trend and analytics dashboard microsoft pdf. This layout presents information on social media hiring trend and analytics dashboard. It is also available for immediate download and adjustment. So, changes can be made in the color, design, graphics or any other component to create a unique layout.

Social Media Platforms Used By Recruitment Managers For Hiring Summary PDF
This slide depicts the various social networking sites for both jobs and job candidates. It includes Facebook, LinkedIn, Instagram , twitter and Google plus. Pitch your topic with ease and precision using this social media platforms used by recruitment managers for hiring summary pdf. This layout presents information on social media platforms used by recruitment managers for hiring. It is also available for immediate download and adjustment. So, changes can be made in the color, design, graphics or any other component to create a unique layout.

Dashboard For Tracking Logistics Management Strategy Results Ideas PDF
This slide covers a dashboard for tracking the logistics operations KPIs. It includes metrics such as warehousing operating cost, perfect order rate, total shipments by areas, on time shipments, etc. Pitch your topic with ease and precision using this dashboard for tracking logistics management strategy results ideas pdf. This layout presents information on cost, warehouse, rate. It is also available for immediate download and adjustment. So, changes can be made in the color, design, graphics or any other component to create a unique layout.

Cyber Risk Dashboard With Current Risks And Security Service Formats PDF
The following slide focuses on the cyber threat dashboard which highlights current threats, current risks, regulation and policy coverage, security service and asset control issues. Pitch your topic with ease and precision using this cyber risk dashboard with current risks and security service formats pdf. This layout presents information on current threats, current risks, regulation and policy coverage. It is also available for immediate download and adjustment. So, changes can be made in the color, design, graphics or any other component to create a unique layout.
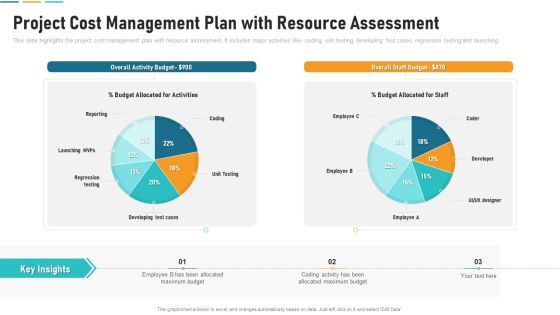
Project Cost Management Plan With Resource Assessment Download PDF
This slide highlights the project cost management plan with resource assessment. It includes major activities like coding, unit testing, developing test cases, regression testing and launching. Pitch your topic with ease and precision using this project cost management plan with resource assessment download pdf. This layout presents information on overall activity budget, overall staff budget, budget allocated for staff. It is also available for immediate download and adjustment. So, changes can be made in the color, design, graphics or any other component to create a unique layout.

Dashboard For Tracking Leadership Growth And Development Program Ideas PDF
This slide exhibits a dashboard for tracking the development of leadership programs for team growth. It covers executive training programs, supervisor competency heatmap, leadership training, etc. Pitch your topic with ease and precision using this dashboard for tracking leadership growth and development program ideas pdf This layout presents information on executive training program, leadership training, completion v or s success It is also available for immediate download and adjustment. So, changes can be made in the color, design, graphics or any other component to create a unique layout.

Dashboard For Tracking Leadership Growth And Development Program Topics PDF
This slide exhibits a dashboard for tracking the development of leadership programs for team growth. It covers executive training programs, supervisor competency heatmap, leadership training, etc. Pitch your topic with ease and precision using this dashboard for tracking leadership growth and development program topics pdf This layout presents information on executive training program, leadership training, completion v or s success It is also available for immediate download and adjustment. So, changes can be made in the color, design, graphics or any other component to create a unique layout.

Business Cashflow Predictive For Operating Financial And Investing Activities Ppt Inspiration Infographic Template PDF
The following slide highlights the business cashflow forecast with for operating financial and investing activities illustrating key headings which includes key headings which includes cashflow statement, revenue, net income, free cash flow and cash balance. Pitch your topic with ease and precision using this business cashflow predictive for operating financial and investing activities ppt inspiration infographic template pdf. This layout presents information on revenue, net income, free cash flow, cash balance, 2020 to 2024. It is also available for immediate download and adjustment. So, changes can be made in the color, design, graphics or any other component to create a unique layout.

Market Potential Report For Business Feasibility Pictures PDF
This slide showcases dashboard that help organization to identify the market viability and potential before launch of final product. Its key components are market growth estimation, market by geography, market with product segment and opportunities available Pitch your topic with ease and precision using this market potential report for business feasibility pictures pdf This layout presents information on geographical location, opportunities in market, growth estimation It is also available for immediate download and adjustment. So, changes can be made in the color, design, graphics or any other component to create a unique layout.

Dashboard Of Project Risk Evaluation With Risk Rating Pictures PDF
The slide highlights the dashboard of project risk assessment with risk rating illustrating total risks, open risk, improving, closed risk, mitigated risk, residual risk, risk rating, inherent risk, control risk and impact probability matrixPitch your topic with ease and precision using this dashboard of project risk evaluation with risk rating pictures pdf This layout presents information on dashboard of project risk evaluation with risk rating It is also available for immediate download and adjustment. So, changes can be made in the color, design, graphics or any other component to create a unique layout.

Retail Outlet Dashboard With Sales Kpis Clipart PDF
This slide covers a metrics dashboard for tracking retail store sales. It includes KPIs such as sales square foot per location, net profit, revues, shrinkage, customer retention rate, etc. Pitch your topic with ease and precision using this retail outlet dashboard with sales kpis clipart pdf This layout presents information on Retail outlet dashboard with sales kpis It is also available for immediate download and adjustment. So, changes can be made in the color, design, graphics or any other component to create a unique layout.

Automobile OEM Report With Forecasted Growth Rate Ppt PowerPoint Presentation File Background Images PDF
This slide showcases report that can help automobile companies to identify the growth rate of aftermarket area. It also showcases incremental growth and growth to be contributed by online channels. Pitch your topic with ease and precision using this automobile oem report with forecasted growth rate ppt powerpoint presentation file background images pdf. This layout presents information on incremental growth, billion dollars, growth, offline segment, market impact, expected growth in 2022. It is also available for immediate download and adjustment. So, changes can be made in the color, design, graphics or any other component to create a unique layout.
OEM Spare Parts Sales Tracking Dashboard Ppt PowerPoint Presentation Gallery Inspiration PDF
This slide showcases dashboard that can help organization to keep track of aftermarket components sales. Its key elements are sold quantity per spare part and deviation of sold units. Pitch your topic with ease and precision using this oem spare parts sales tracking dashboard ppt powerpoint presentation gallery inspiration pdf. This layout presents information on sold quantity, budgeted quantity, quantity ytd ly. It is also available for immediate download and adjustment. So, changes can be made in the color, design, graphics or any other component to create a unique layout.
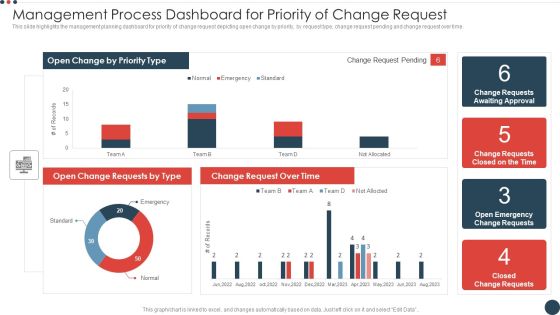
Management Process Dashboard For Priority Of Change Request Demonstration PDF
This slide highlights the management planning dashboard for priority of change request depicting open change by priority, by request type, change request pending and change request over time. Pitch your topic with ease and precision using this management process dashboard for priority of change request demonstration pdf. This layout presents information on management process dashboard for priority of change request. It is also available for immediate download and adjustment. So, changes can be made in the color, design, graphics or any other component to create a unique layout.

Monitoring Monthly Change Implementation Management Process Summary PDF
This slide highlights the monthly change management plan monitoring by showing open change request due next week and due next 30 days, assigned open request and change request by status. Pitch your topic with ease and precision using this monitoring monthly change implementation management process summary pdf. This layout presents information on monitoring monthly change implementation management process. It is also available for immediate download and adjustment. So, changes can be made in the color, design, graphics or any other component to create a unique layout.
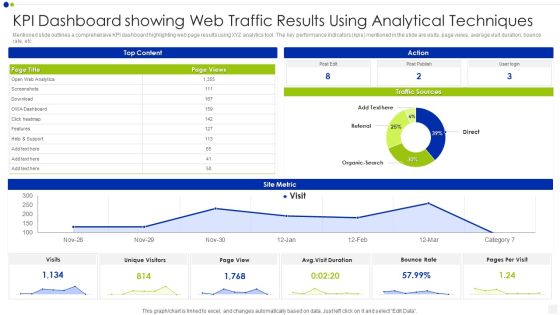
KPI Dashboard Showing Web Traffic Results Using Analytical Techniques Inspiration PDF
Mentioned slide outlines a comprehensive KPI dashboard highlighting web page results using XYZ analytics tool. The key performance indicators kpis mentioned in the slide are visits, page views, average visit duration, bounce rate, etc. Pitch your topic with ease and precision using this kpi dashboard showing web traffic results using analytical techniques inspiration pdf. This layout presents information on bounce rate, traffic sources, analytics. It is also available for immediate download and adjustment. So, changes can be made in the color, design, graphics or any other component to create a unique layout.

Russia Ukraine Conflict Effect Minimize Sanctions On Russia To Control Inflation Clipart PDF
This slides highlights the sanctions on Russia in world map and summary of sanctions that should be relieved from Russia which includes countries should lift from oil imports, swift banking, and Russian flights. Presenting Russia Ukraine Conflict Effect Minimize Sanctions On Russia To Control Inflation Clipart PDF to provide visual cues and insights. Share and navigate important information on one stages that need your due attention. This template can be used to pitch topics like Countries With Sanction On Russia, Summary Sanctions Relieved, Countries Imposed Sanctions Individually. In addtion, this PPT design contains high resolution images, graphics, etc, that are easily editable and available for immediate download.
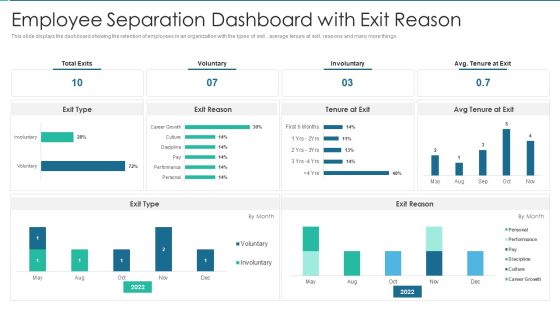
Employee Separation Dashboard With Exit Reason Rules PDF
This slide displays the dashboard showing the retention of employees in an organization with the types of exit , average tenure at exit, reasons and many more things. Pitch your topic with ease and precision using this Employee Separation Dashboard With Exit Reason Rules PDF This layout presents information on Employee Separation Dashboard With Exit Reason It is also available for immediate download and adjustment. So, changes can be made in the color, design, graphics or any other component to create a unique layout.
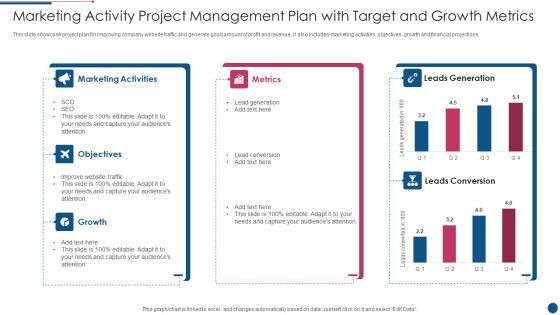
Marketing Activity Project Management Plan With Target And Growth Metrics Introduction PDF
This slide showcase project plan for improving company website traffic and generate good amount of profit and revenue, it also includes marketing activities, objectives, growth and financial projections. Pitch your topic with ease and precision using this Marketing Activity Project Management Plan With Target And Growth Metrics Introduction PDF. This layout presents information on Marketing Activities, Metrics, Growth. It is also available for immediate download and adjustment. So, changes can be made in the color, design, graphics or any other component to create a unique layout.
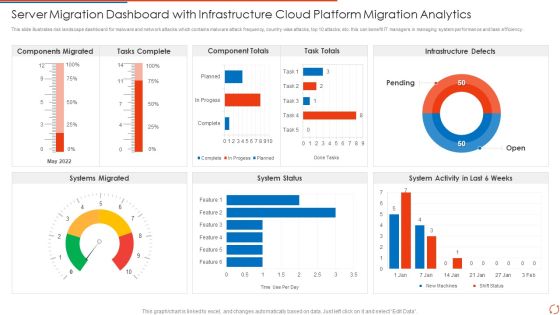
Server Migration Dashboard With Infrastructure Cloud Platform Migration Analytics Elements PDF Portrait PDF
This slide illustrates risk landscape dashboard for malware and network attacks which contains malware attack frequency, country wise attacks, top 10 attacks, etc. this can benefit IT managers in managing system performance and task efficiency Pitch your topic with ease and precision using this Server Migration Dashboard With Infrastructure Cloud Platform Migration Analytics Elements PDF Portrait PDF. This layout presents information on Tasks Complete, Component Totals, Task Totals. It is also available for immediate download and adjustment. So, changes can be made in the color, design, graphics or any other component to create a unique layout.

Marketing Kpi Dashboard Showing Campaign Outcomes Pictures PDF
The purpose of this slide is to outline KPI dashboard of various results generated from marketing campaign. The results highlighted in the slide are total visits, average session duration, bounce rate, traffic sources, top channels by conversion etc. Pitch your topic with ease and precision using this Marketing Kpi Dashboard Showing Campaign Outcomes Pictures PDF. This layout presents information on Marketing Kpi Dashboard Showing Campaign Outcomes. It is also available for immediate download and adjustment. So, changes can be made in the color, design, graphics or any other component to create a unique layout.

Smartphone App Installation Metrics Dashboard With User Sessions Microsoft PDF
This slide showcases dashboard that can help organization to identify the installation trend of mobile application and formulate strategies in case of declining downloads. Its key components are installs trend, total installs, total sessions and total media source breakdown by revenue. Pitch your topic with ease and precision using this Smartphone App Installation Metrics Dashboard With User Sessions Microsoft PDF. This layout presents information on Smartphone App Installation Metrics Dashboard With User Sessions. It is also available for immediate download and adjustment. So, changes can be made in the color, design, graphics or any other component to create a unique layout.

HR Budget Vs Actual KPI Dashboard Ppt PowerPoint Presentation File Structure PDF
The given below slide highlights the key metrics of HR budget to manage expense stream and take assist decision making. It includes KPAs such as month wise variations in budget, total amount allocated, actual expenditures etc. Pitch your topic with ease and precision using this HR Budget Vs Actual KPI Dashboard Ppt PowerPoint Presentation File Structure PDF. This layout presents information on Amount Allocated, Expenses by Heads, Budget Achieved. It is also available for immediate download and adjustment. So, changes can be made in the color, design, graphics or any other component to create a unique layout.
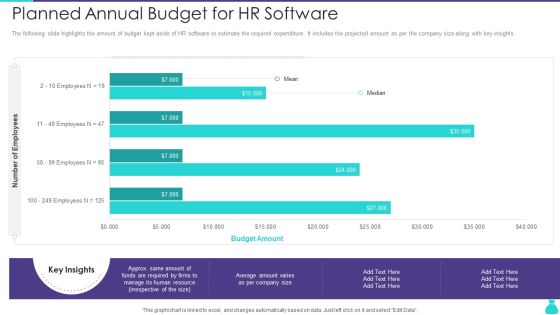
Planned Annual Budget For HR Software Ppt PowerPoint Presentation Gallery Outfit PDF
The following slide highlights the amount of budget kept aside of HR software to estimate the required expenditure. It includes the projected amount as per the company size along with key insights. Pitch your topic with ease and precision using this Planned Annual Budget For HR Software Ppt PowerPoint Presentation Gallery Outfit PDF. This layout presents information on Budget Amount, Employee. It is also available for immediate download and adjustment. So, changes can be made in the color, design, graphics or any other component to create a unique layout.
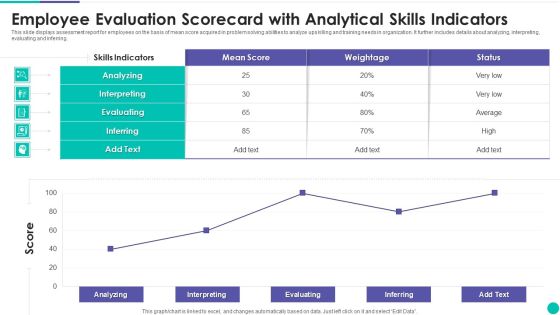
Employee Evaluation Scorecard With Analytical Skills Indicators Clipart PDF
This slide displays assessment report for employees on the basis of mean score acquired in problem solving abilities to analyze upskilling and training needs in organization. It further includes details about analyzing, interpreting, evaluating and inferring. Pitch your topic with ease and precision using this Employee Evaluation Scorecard With Analytical Skills Indicators Clipart PDF. This layout presents information on Analyzing, Interpreting, Evaluating. It is also available for immediate download and adjustment. So, changes can be made in the color, design, graphics or any other component to create a unique layout.
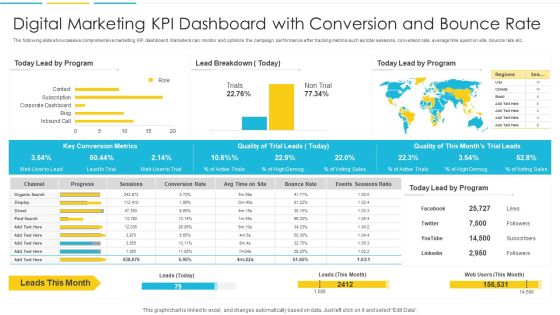
Digital Marketing KPI Dashboard With Conversion And Bounce Rate Introduction PDF
The following slide showcases a comprehensive marketing KPI dashboard. Marketers can monitor and optimize the campaign performance after tracking metrics such as total sessions, conversion rate, average time spent on site, bounce rate etc. Pitch your topic with ease and precision using this Digital Marketing KPI Dashboard With Conversion And Bounce Rate Introduction PDF. This layout presents information on Organic, Progress, Conversion Rate. It is also available for immediate download and adjustment. So, changes can be made in the color, design, graphics or any other component to create a unique layout

Digital Marketing KPI Dashboard With Goal Conversion Rate Ideas PDF
The following slide showcases a marketing KPI dashboard. The various metrics highlighted in the slide are total sessions, bounce rate, goal completions, goal conversion rate, top channels which generated revenue. Pitch your topic with ease and precision using this Digital Marketing KPI Dashboard With Goal Conversion Rate Ideas PDF. This layout presents information on Rate, Goal, Conversions. It is also available for immediate download and adjustment. So, changes can be made in the color, design, graphics or any other component to create a unique layout.

KPI Dashboard Highlighting Results Of SEO Campaign Topics PDF
The following slide showcases marketing KPI dashboard which shows the performance measuring metrics of SEO campaign. The metrics covered in the slide are most viewed pages from SEO, most search engines used, traffic type, top known keywords etc. Pitch your topic with ease and precision using this KPI Dashboard Highlighting Results Of SEO Campaign Topics PDF. This layout presents information on Search Engines, Traffic, Organic. It is also available for immediate download and adjustment. So, changes can be made in the color, design, graphics or any other component to create a unique layout.
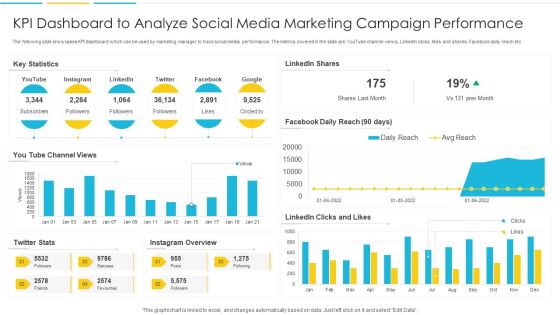
KPI Dashboard To Analyze Social Media Marketing Campaign Performance Rules PDF
The following slide showcases KPI dashboard which can be used by marketing manager to track social media performance. The metrics covered in the slide are YouTube channel views, LinkedIn clicks, likes and shares, Facebook daily reach etc. Pitch your topic with ease and precision using this KPI Dashboard To Analyze Social Media Marketing Campaign Performance Rules PDF. This layout presents information on Dashboard, Marketing, Analyze. It is also available for immediate download and adjustment. So, changes can be made in the color, design, graphics or any other component to create a unique layout.
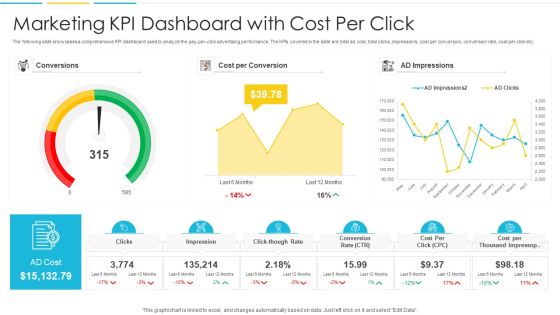
Marketing KPI Dashboard With Cost Per Click Infographics PDF
The following slide showcases a comprehensive KPI dashboard used to analyze the pay-per-click advertising performance. The KPIs covered in the slide are total ad cost, total clicks, impressions, cost per conversion, conversion rate, cost per click etc. Pitch your topic with ease and precision using this Marketing KPI Dashboard With Cost Per Click Infographics PDF. This layout presents information on Conversions, Cost, Impressions. It is also available for immediate download and adjustment. So, changes can be made in the color, design, graphics or any other component to create a unique layout.
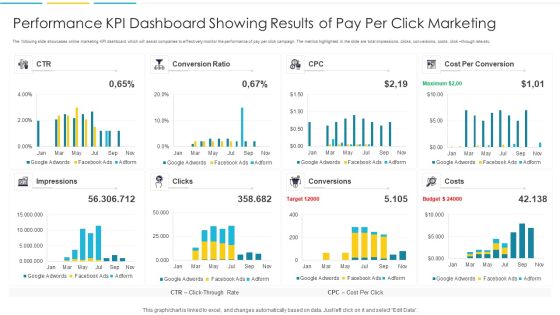
Performance KPI Dashboard Showing Results Of Pay Per Click Marketing Portrait PDF
The following slide showcases online marketing KPI dashboard which will assist companies to effectively monitor the performance of pay per click campaign. The metrics highlighted in the slide are total impressions, clicks, conversions, costs, click through rate etc. Pitch your topic with ease and precision using this Performance KPI Dashboard Showing Results Of Pay Per Click Marketing Portrait PDF. This layout presents information on Impressions, Target, Budget. It is also available for immediate download and adjustment. So, changes can be made in the color, design, graphics or any other component to create a unique layout.

Assessing The Efforts Made By Employees For Enhancing Sales Skills Brochure PDF
The given below slide highlights of employee engage themselves in various activities to enhance their current sales skills set. It includes activities such as attended training session, peer learning, webinars, individual coaching etc.Pitch your topic with ease and precision using this Assessing The Efforts Made By Employees For Enhancing Sales Skills Brochure PDF This layout presents information on Learning Events, Maximum Of The Them Attended, Training Sessions It is also available for immediate download and adjustment. So, changes can be made in the color, design, graphics or any other component to create a unique layout.

Garment Production Quality KPI Dashboard Portrait PDF
The following slide shows dashboard that shows KPIs to measure garment manufacturing quality . Major KPIs covered are factory efficiency , quality to production, cut to ship ratio.Pitch your topic with ease and precision using this Garment Production Quality KPI Dashboard Portrait PDF This layout presents information on Production Downtime, Time Delivery Over The Quarters, Average Style Changeover Time It is also available for immediate download and adjustment. So, changes can be made in the color, design, graphics or any other component to create a unique layout.

Cyber Intelligence Risk Assessment Dashboard With Heat Map Portrait PDF
This slide exhibits risk rating breakdown and heat map for analyzing current cyber security measures effectiveness. It covers top 5 vulnerabilities and clients under scrutiny. Pitch your topic with ease and precision using this Cyber Intelligence Risk Assessment Dashboard With Heat Map Portrait PDF This layout presents information on Risk Rating Breakdown, Action Plan Breakdown, Risk Possibility It is also available for immediate download and adjustment. So, changes can be made in the color, design, graphics or any other component to create a unique layout.

Corporate Loan Approval And Bank Portfolio Summary Portrait PDF
This slide covers the dashboard with bank loan approval details. It include KPIs such as facility limits, available funds, total number of loans distributed, total value of loan disbursed, interest earned, overdue amount, monthly trend, etc. Pitch your topic with ease and precision using this Corporate Loan Approval And Bank Portfolio Summary Portrait PDF. This layout presents information on Interest Earnings, Available Funds, Facility Limits. It is also available for immediate download and adjustment. So, changes can be made in the color, design, graphics or any other component to create a unique layout.

Corporate Loan Operations Dashboard For Banks Introduction PDF
This slide displays the dashboard for corporate loan operations management. It include KPIs such as open cases with service level agreements, average open cases by agents, open cases by age, proposed exposure by risk rating, etc. Pitch your topic with ease and precision using this Corporate Loan Operations Dashboard For Banks Introduction PDF. This layout presents information on Proposed Exposure By Risk Rating, Open Cases By Age, Application Pipeline. It is also available for immediate download and adjustment. So, changes can be made in the color, design, graphics or any other component to create a unique layout.
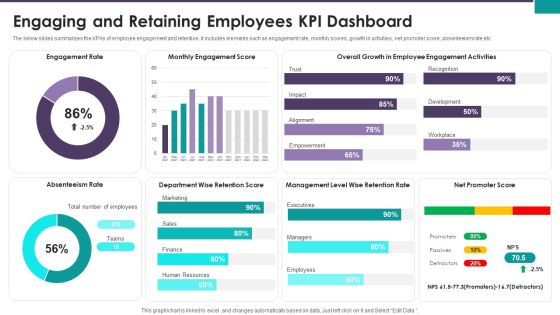
Engaging And Retaining Employees KPI Dashboard Ppt Slides Show PDF
The below slides summarizes the KPAs of employee engagement and retention. It includes elements such as engagement rate, monthly scores, growth in activities, net promoter score, absenteeism rate etc. Pitch your topic with ease and precision using this Engaging And Retaining Employees KPI Dashboard Ppt Slides Show PDF. This layout presents information on Engagement Rate Monthly, Engagement Score Overall, Growth Employee Engagement. It is also available for immediate download and adjustment. So, changes can be made in the color, design, graphics or any other component to create a unique layout.

Search Engine Optimization Services Dashboard With Google Ranking Ppt Gallery Demonstration PDF
This slide covers the different SEO services and the impact of them on the business. It includes the number of website visitors, Google ranking , site audit score, audience growth graph and many more things. Pitch your topic with ease and precision using this Search Engine Optimization Services Dashboard With Google Ranking Ppt Gallery Demonstration PDF. This layout presents information on Audience Growth Paid, Adwords Conversions Score. It is also available for immediate download and adjustment. So, changes can be made in the color, design, graphics or any other component to create a unique layout.

Startup Business Company Financial Model Showing Operating Expenses Professional PDF
This slide represents the financial model prepared by the financial forecasting team of startup company showing the increase in operating expenses of the organization in the upcoming financial years. Pitch your topic with ease and precision using this Startup Business Company Financial Model Showing Operating Expenses Professional PDF. This layout presents information on General And Administrative, Total Payroll Travel, Sales And Marketing. It is also available for immediate download and adjustment. So, changes can be made in the color, design, graphics or any other component to create a unique layout.

Startup Business Financial Dashboard With Key Metrics Sample PDF
This slide represents the financial dashboard for startup company with key performance indicators. It includes details related to current working capital, cash conversion cycle in days and vendor payment error rate. Pitch your topic with ease and precision using this Startup Business Financial Dashboard With Key Metrics Sample PDF. This layout presents information on Cash Conversion Cycle, Current Working Capital, Current Liabilities Debt. It is also available for immediate download and adjustment. So, changes can be made in the color, design, graphics or any other component to create a unique layout.
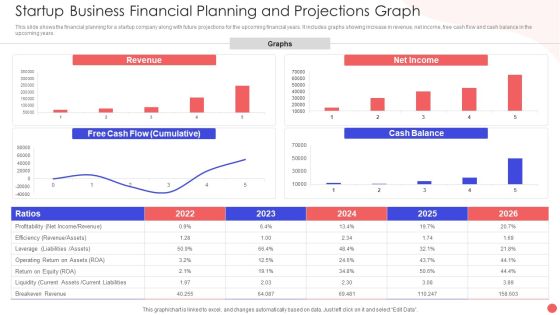
Startup Business Financial Planning And Projections Graph Slides PDF
This slide shows the financial planning for a startup company along with future projections for the upcoming financial years. It includes graphs showing increase in revenue, net income, free cash flow and cash balance in the upcoming years. Pitch your topic with ease and precision using this Startup Business Financial Planning And Projections Graph Slides PDF. This layout presents information on Revenue Graphs Operating, Free Cash Flow, Net Income Ration. It is also available for immediate download and adjustment. So, changes can be made in the color, design, graphics or any other component to create a unique layout.
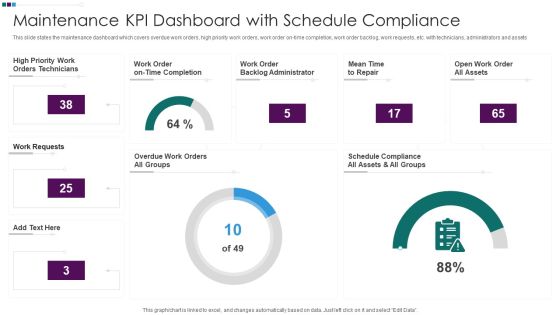
Maintenance KPI Dashboard With Schedule Compliance Ppt Styles Demonstration PDF
This slide states the maintenance dashboard which covers overdue work orders, high priority work orders, work order on-time completion, work order backlog, work requests, etc. with technicians, administrators and assets. Pitch your topic with ease and precision using this Maintenance KPI Dashboard With Schedule Compliance Ppt Styles Demonstration PDF. This layout presents information on High Priority Work, Work Order Backlog, Mean Time Repair, Open Work Order. It is also available for immediate download and adjustment. So, changes can be made in the color, design, graphics or any other component to create a unique layout.

Customer Relationship Management Software Dashboard For Customer Support System Demonstration PDF
This slide shows the dashboard to be used by the customer support system of the organisation. It represents the number of unresolved issues, average response time and level of customer satisfaction.Pitch your topic with ease and precision using this Customer Relationship Management Software Dashboard For Customer Support System Demonstration PDF This layout presents information on Customer Support, Vendor Management, Loyalty Programs It is also available for immediate download and adjustment. So, changes can be made in the color, design, graphics or any other component to create a unique layout.

Debt Recovery Dashboard With Cash Flow Metrics Summary PDF
This slide showcase debt collection dashboard with cash flow metrics which contains 12 month collection totals by client, non payers, client with most debtors, paid vs. owed debtor and income by agent. It can assist businesses in reviewing the money collected and lent to various clients.Pitch your topic with ease and precision using this Debt Recovery Dashboard With Cash Flow Metrics Summary PDF This layout presents information on Debt Recovery, Dashboard Cash, Flow Metrics It is also available for immediate download and adjustment. So, changes can be made in the color, design, graphics or any other component to create a unique layout.
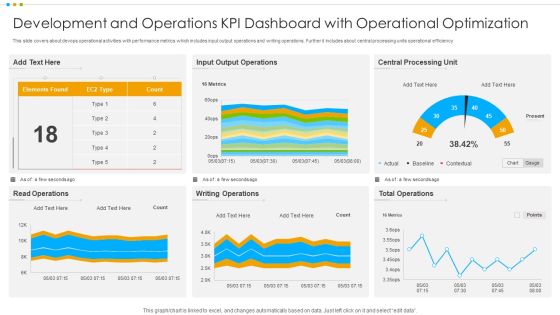
Development And Operations KPI Dashboard With Operational Optimization Pictures PDF
This slide covers about devops operational activities with performance metrics which includes input output operations and writing operations. Further it includes about central processing units operational efficiency.Pitch your topic with ease and precision using this Development And Operations KPI Dashboard With Operational Optimization Pictures PDF This layout presents information on Output Operations, Central Processing, Total Operations It is also available for immediate download and adjustment. So, changes can be made in the color, design, graphics or any other component to create a unique layout.

Online Marketing Report To Analyze Website Traffic Trend Introduction PDF
This slide shows digital marketing report which includes total sessions, bounce rate, goal completions, goal conversion rate, top channels, etc. that helps business to analyze audience traffic on website for making better decisions.Pitch your topic with ease and precision using this Online Marketing Report To Analyze Website Traffic Trend Introduction PDF This layout presents information on Goal Completions, Goal Conversion, Total Sessions It is also available for immediate download and adjustment. So, changes can be made in the color, design, graphics or any other component to create a unique layout.
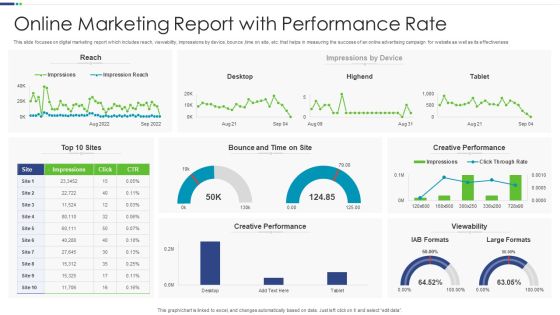
Online Marketing Report With Performance Rate Microsoft PDF
This slide focuses on digital marketing report which includes reach, viewability, impressions by device, bounce ,time on site, etc. that helps in measuring the success of an online advertising campaign for website as well as its effectiveness.Pitch your topic with ease and precision using this Online Marketing Report With Performance Rate Microsoft PDF This layout presents information on Creative Performance, Viewability, Creative Performance It is also available for immediate download and adjustment. So, changes can be made in the color, design, graphics or any other component to create a unique layout.
 Home
Home