Data Architecture Diagram

IT Professional Data Certification Program AWS Certified Solutions Architect Job Description Diagrams PDF
This slide covers AWS Certified Solutions Architect certifications Training and Exam Cost, Job Description, Roles and responsibilities and average salary package etc. Presenting IT Professional Data Certification Program AWS Certified Solutions Architect Job Description Diagrams PDF to provide visual cues and insights. Share and navigate important information on six stages that need your due attention. This template can be used to pitch topics like Network, Technology, Teams. In addtion, this PPT design contains high resolution images, graphics, etc, that are easily editable and available for immediate download.

6 Months Strategy Roadmap For Data Analysis Integration To Business Diagrams
Introducing our 6 months strategy roadmap for data analysis integration to business diagrams. This PPT presentation is Google Slides compatible, therefore, you can share it easily with the collaborators for measuring the progress. Also, the presentation is available in both standard screen and widescreen aspect ratios. So edit the template design by modifying the font size, font type, color, and shapes as per your requirements. As this PPT design is fully editable it can be presented in PDF, JPG and PNG formats.

Telehealth Collect Medically Meaningful And True To Life Data Cost Effectively Diagrams PDF
This slide outlines how digital biomarkers capture clinically meaningful and objective information cost-effectively. It also includes the cognitive impairment diagnosis process covering hand-drawn clock test, physician judgment, eye tracking rest, and so on. Slidegeeks has constructed Telehealth Collect Medically Meaningful And True To Life Data Cost Effectively Diagrams PDF after conducting extensive research and examination. These presentation templates are constantly being generated and modified based on user preferences and critiques from editors. Here, you will find the most attractive templates for a range of purposes while taking into account ratings and remarks from users regarding the content. This is an excellent jumping-off point to explore our content and will give new users an insight into our top-notch PowerPoint Templates.
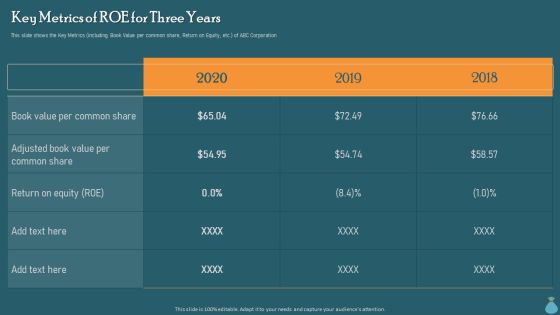
Financial Data Revelation To Varied Stakeholders Key Metrics Of Roe For Three Years Diagrams PDF
This slide shows the Key Metrics including Book Value per common share, Return on Equity, etc. of ABC Corporation. Coming up with a presentation necessitates that the majority of the effort goes into the content and the message you intend to convey. The visuals of a PowerPoint presentation can only be effective if it supplements and supports the story that is being told. Keeping this in mind our experts created Financial Data Revelation To Varied Stakeholders Key Metrics Of Roe For Three Years Diagrams PDF to reduce the time that goes into designing the presentation. This way, you can concentrate on the message while our designers take care of providing you with the right template for the situation.

Optimizing Fiber Distributed Data Interface To Enhance Processes Overview Of Target Token Rotation Time Diagrams PDF
This slide explains target token rotation time, which is an essential parameter of FDDI for network performance optimization, also increasing it enhances throughput. Welcome to our selection of the Optimizing Fiber Distributed Data Interface To Enhance Processes Overview Of Target Token Rotation Time Diagrams PDF. These are designed to help you showcase your creativity and bring your sphere to life. Planning and Innovation are essential for any business that is just starting out. This collection contains the designs that you need for your everyday presentations. All of our PowerPoints are 100 percent editable, so you can customize them to suit your needs. This multi purpose template can be used in various situations. Grab these presentation templates today.

Quarterly Road Ahead Achievement Playbook Roadmap For Data Scientist Executive Diagrams
Presenting our jaw dropping quarterly road ahead achievement playbook roadmap for data scientist executive diagrams. You can alternate the color, font size, font type, and shapes of this PPT layout according to your strategic process. This PPT presentation is compatible with Google Slides and is available in both standard screen and widescreen aspect ratios. You can also download this well researched PowerPoint template design in different formats like PDF, JPG, and PNG. So utilize this visually appealing design by clicking the download button given below.
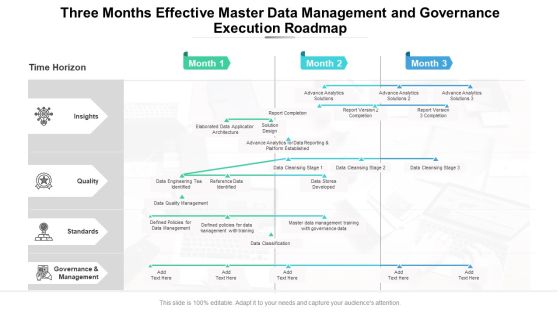
Three Months Effective Master Data Management And Governance Execution Roadmap Diagrams
Presenting our jaw dropping three months effective master data management and governance execution roadmap diagrams. You can alternate the color, font size, font type, and shapes of this PPT layout according to your strategic process. This PPT presentation is compatible with Google Slides and is available in both standard screen and widescreen aspect ratios. You can also download this well researched PowerPoint template design in different formats like PDF, JPG, and PNG. So utilize this visually appealing design by clicking the download button given below.
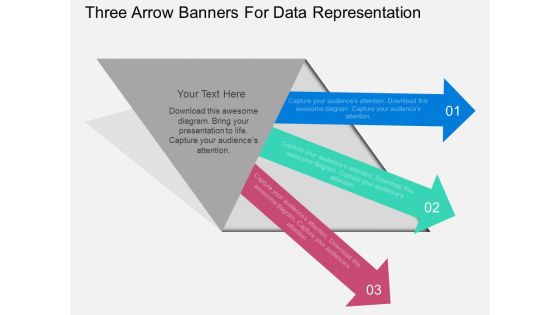
Three Arrow Banners For Data Representation Powerpoint Template
This business diagram contains graphics three arrow banners. Our professionally designed business diagram helps to portray business concepts in visual manner. Enlighten your audience with your breathtaking ideas.

Bar Graph For Data Distribution And Analysis Powerpoint Slides
This PowerPoint template has been designed with bar graph. This PowerPoint diagram is useful for data distribution and analysis This diagram slide can be used to make impressive presentations.
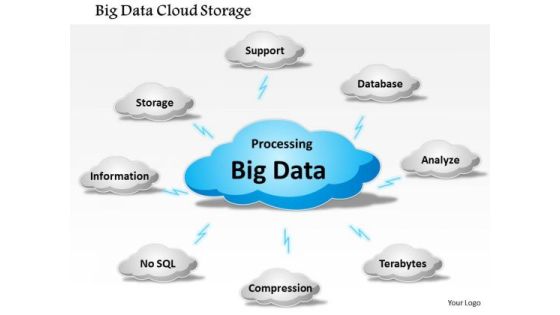
Business Framework Big Data Cloud Storage PowerPoint Presentation
This power point diagram slide has been designed with graphic of cloud and connecting sub clouds. This diagram slide is representing the concept of data storage in cloud computing. Use this diagram slide for cloud computing and data storage related presentations.
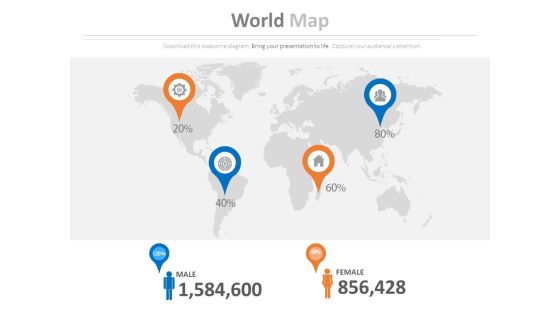
World Map With Male And Female Population Data Powerpoint Slides
This professionally designed PowerPoint template displays diagram of world map with male female icons. You can download this diagram to exhibit male female ratio in world. Above PPT slide is suitable for business presentation.
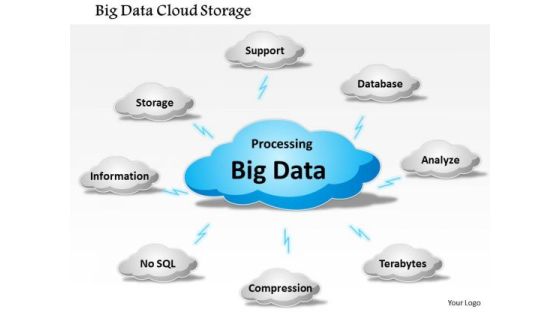
Business Framework Big Data Cloud Storage PowerPoint Presentation 1
Explain the concept of big data storage on cloud service with this power point diagram slide. This diagram contains the graphic of big cloud and connected sub clouds in network. Use this image for data storage and data networking related presentations.
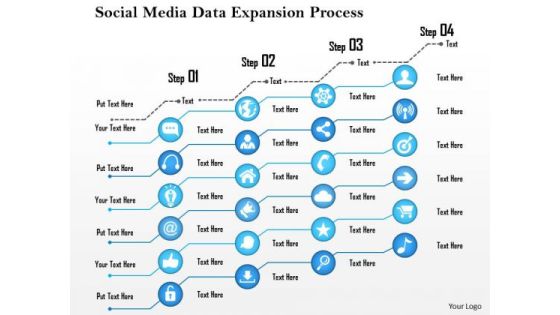
Business Framework Social Media Data Expansion Process PowerPoint Presentation
Four staged data process diagram has been used to decorate this power point template slide. This PPT slide contains the concept of social media data expansion. Display this data expansion in your presentations with this unique PPT slide.

Six Steps With Arrows For Data Display Powerpoint Template
This business slide has been designed with six steps with arrows. You may download this PowerPoint slide to display business data. Convey your views with this diagram slide.

Five Staged Infographics With Diary For Data Storage PowerPoint Template
Five staged info graphic with diary has been used to design this power point template. This PPT contains the concept of data flow. Use this PPT diagram to represent the marketing and business data in any presentation.
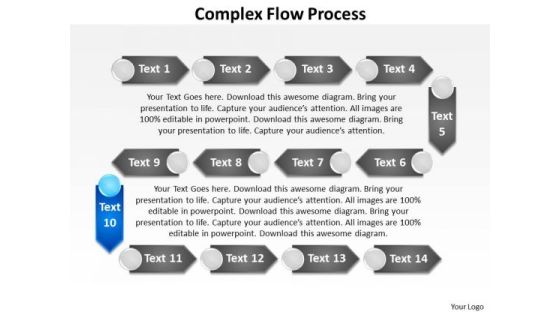
Ppt Circuitous Flow Data Mining Process PowerPoint Presentation Templates
PPT circuitous flow data mining process powerpoint presentation Templates-Use this data flow diagram to show the logical flow of data through a set of processes or procedures. It represents processing requirements of a program and the information flows. It helps to focus the minds of your team-PPT circuitous flow data mining process powerpoint presentation Templates-Advice, Analyze, Arrow, Background, Business, Chart, Concept, Creativity, Decision, Design, Determination, Diagram, Draw, Education, Flowchart, Graphic, Idea, Means, Method, Office, Plan, Pointing, Presentation, Process, Sign, Strategy, Technology
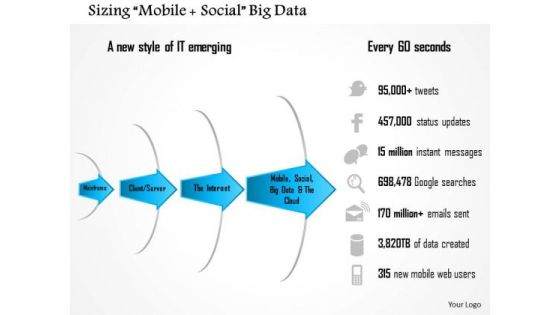
Business Framework Sizing Mobile Social Big Data PowerPoint Presentation
This Power Point template slide has been designed with graphic of four layer semi-circle diagram. This four staged arrow diagram may be used to display the data. This PPT slide contains the social big data. Use this PPT slide in your business presentations.

Four Staged Vertical Text Boxes For Data Display Presentation Template
Four staged vertical text boxes diagram has been used to design this power point template. This PPT contains the concept of data representation. Use this PPT and build presentation for business and marketing related topics.
Laptop With Data Storage And Management Icons Powerpoint Template
This PowerPoint template has been designed with graphics of laptop with icons. This PPT diagram can be used to display data storage and management concepts. Capture the attention of your audience with this slide.

Three Arrow Tags For Data Analysis PowerPoint Template
Our professionally designed business diagram is as an effective tool to display data analysis. It contains graphics of three arrow tags. This template is specifically created to highlight you points.

Bar Graph For Marketing Research Data Powerpoint Slides
This PowerPoint template has been designed with diagram of bar graph. This PPT slide can be used to prepare presentations for profit growth report and also for financial data analysis. You can download finance PowerPoint template to prepare awesome presentations.
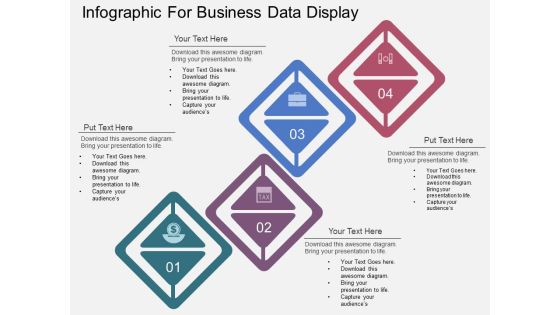
Four Steps Infographic For Business Data Display Powerpoint Template
This PowerPoint template has been designed with four steps infographic layout. This diagram can be used to display business data in visual manner. Capture the attention of your audience with this slide.

Data Interpretations Market Analysis Templates For Business Plan PowerPoint
We present our data interpretations market analysis templates for business plan PowerPoint.Present our Circle Charts PowerPoint Templates because Our PowerPoint Templates and Slides come in all colours, shades and hues. They help highlight every nuance of your views. Use our Business PowerPoint Templates because Our PowerPoint Templates and Slides will let you Hit the right notes. Watch your audience start singing to your tune. Download our Shapes PowerPoint Templates because Our PowerPoint Templates and Slides will fulfill your every need. Use them and effectively satisfy the desires of your audience. Present our Signs PowerPoint Templates because Our PowerPoint Templates and Slides will provide you a launch platform. Give a lift off to your ideas and send them into orbit. Use our Metaphors-Visual Concepts PowerPoint Templates because You have a driving passion to excel in your field. Our PowerPoint Templates and Slides will prove ideal vehicles for your ideas.Use these PowerPoint slides for presentations relating to business, chart, circle, circular, diagram, economy, finance, framework, graph, isolated, percentage, pie chart, results, scheme, statistics, stats, strategy, success. The prominent colors used in the PowerPoint template are Blue, Green, Blue light.

Bar Graph Of Lego Blocks For Data Analysis Powerpoint Slides
This PowerPoint template contains bar graph made of Lego blocks. You may use this slide to display growth process. This diagram provides an effective way of displaying information you can edit text, color, shade and style as per you need.
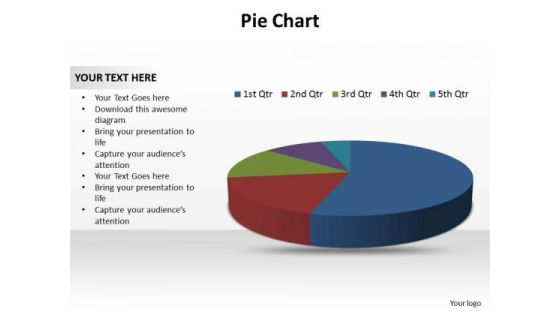
Buisness Leadership PowerPoint Templates Business Pie Chart Data Ppt Slides
Business Leadership PowerPoint Templates Business pie chart data PPT Slides-use this diagram to show your ideas all together to form the complete picture and reach the goal-Business Leadership PowerPoint Templates Business pie chart data PPT Slides-This ppt can be used for concepts relating to-Answer, Assemble, Assembly, Attention, Background, Brains, Build, Business, Challenge, Challenging, Clue, Complete, Complex, Concentration, Concept, Connect, Connection, Education, Entertainment, Finish

Four Stages Of Data Computation Cycle Graphics PDF
This slide covers the diagram depicting 4 stages of processing data in an organization. The purpose of this template is to analyze the process of converting raw data into final product. It includes information related to data collection, data input, data processing and data output. Persuade your audience using this Four Stages Of Data Computation Cycle Graphics PDF. This PPT design covers four stages, thus making it a great tool to use. It also caters to a variety of topics including Data Collection, Data Input, Data Processing. Download this PPT design now to present a convincing pitch that not only emphasizes the topic but also showcases your presentation skills.

Quarterly Hiring Process Flow Data Trends Infographics PDF
This slide illustrates funnel diagram and key data statistics regarding recruitment process. It includes visitors and prospects, applicants, shortlisted candidates etc. Persuade your audience using this Quarterly Hiring Process Flow Data Trends Infographics PDF. This PPT design covers five stages, thus making it a great tool to use. It also caters to a variety of topics including Applicants, Average, Key Statistics. Download this PPT design now to present a convincing pitch that not only emphasizes the topic but also showcases your presentation skills.
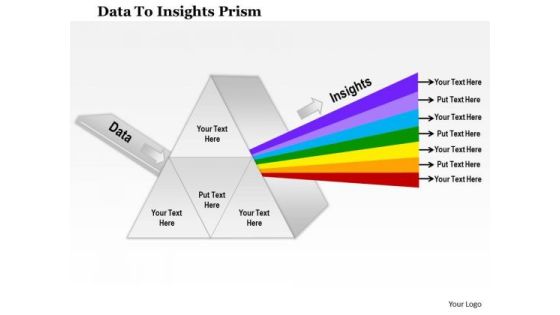
Business Framework Data To Insights Prism PowerPoint Presentation
Four staged cyclic text box diagram has been used to decorate this PPT slide. This PPT slide contain the concept of placement style strategy map which can be used to display various strategies. Use this PPT slide for business strategy related presentations.

Finland Map With Economic Data Analysis Powerpoint Slides
This PowerPoint template has been designed with Finland Map and areas highlighted. You may use this slide to display financial strategy analysis. This diagram provides an effective way of displaying information you can edit text, color, shade and style as per you need.

Business Arrows PowerPoint Templates Business Data Mining Process Ppt Slides
Business Arrows PowerPoint Templates Business data mining process PPT Slides-Use this diagram to show Data Mining Process as a mechanism or group of parts performing one function or serving one purpose in a complex situation-Business Arrows PowerPoint Templates Business data mining process PPT Slides-This template can be used for presentations relating to Analysis, Anomaly, Artificial, Break, Clean, Computer, Cut, Data, Database, Decision, Detection, Discovery, Divide, Explore, Extract, Hammer, Helmet, Human, Index, Intelligence, Kdd, knowledge, Learning, Light, Mallet, Management, Mining, Model, Movement, Pattern, Predictive, Process, Records, Recycle, Repair, Safety, Science

Data And Metadata Management In Enterprise Performance Management Brochure PDF
This slide covers the diagram illustrating the relationship between data and metadata in enterprise performance management. The purpose of this template is to define structure of metadata in EPM enterprise performance management. It also includes details related to business information, rules, etc. Showcasing this set of slides titled Data And Metadata Management In Enterprise Performance Management Brochure PDF. The topics addressed in these templates are Data Business Information, Metadata Object, Customers. All the content presented in this PPT design is completely editable. Download it and make adjustments in color, background, font etc. as per your unique business setting.

Data Integration Maturity Framework Icon Ppt Portfolio Professional PDF
Presenting Data Integration Maturity Framework Icon Ppt Portfolio Professional PDF to dispense important information. This template comprises three stages. It also presents valuable insights into the topics including Data Integration, Maturity Framework, Icon. This is a completely customizable PowerPoint theme that can be put to use immediately. So, download it and address the topic impactfully.
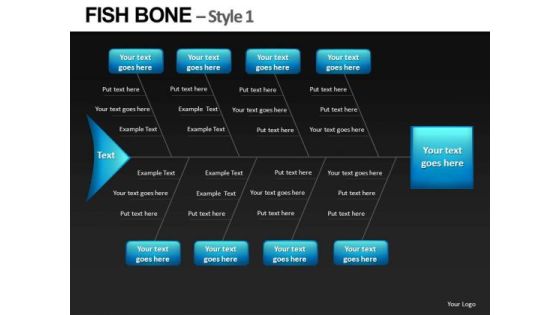
Fishbone Diagram PowerPoint Slides
Fishbone Diagram PowerPoint Slides-These high quality powerpoint pre-designed slides and powerpoint templates have been carefully created by our professional team to help you impress your audience. All slides have been created and are 100% editable in powerpoint. Each and every property of any graphic - color, size, orientation, shading, outline etc. can be modified to help you build an effective powerpoint presentation. Any text can be entered at any point in the powerpoint template or slide. Simply DOWNLOAD, TYPE and PRESENT!These PowerPoint Presentation slides can be used for themes relating to--Arrow, cause, defect, deficiency, diagram, document, effect, envelope, environment, fishbone, flow, industry, kahashiwara, machine, manufacture, material, paper, pencil, safety, sketch

Data Governance Plan Critical Components Ppt Slides Guidelines PDF
The purpose of this slide is to illustrate a set of rules that eliminates the complexity by providing a guide for developing a plan to address these priorities and needs with data and executing that plan. The key components include data architecture, data quality, data management, and data software tools. Presenting Data Governance Plan Critical Components Ppt Slides Guidelines PDF to dispense important information. This template comprises four stages. It also presents valuable insights into the topics including Data Architecture, Data Quality, Data Management, Data Software Tools. This is a completely customizable PowerPoint theme that can be put to use immediately. So, download it and address the topic impactfully.
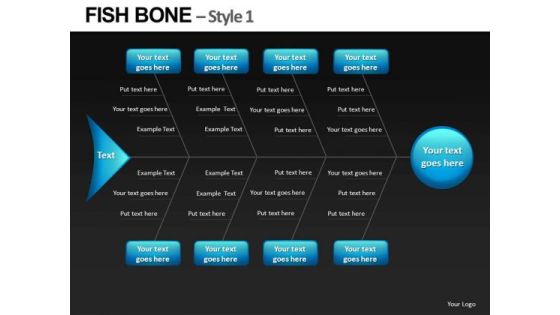
Ppt Slide Fishbone Diagram
PPT Slide FishBone Diagram-These high quality powerpoint pre-designed slides and powerpoint templates have been carefully created by our professional team to help you impress your audience. All slides have been created and are 100% editable in powerpoint. Each and every property of any graphic - color, size, orientation, shading, outline etc. can be modified to help you build an effective powerpoint presentation. Any text can be entered at any point in the powerpoint template or slide. Simply DOWNLOAD, TYPE and PRESENT!These PowerPoint Presentation slides can be used for themes relating to--Arrow, cause, defect, deficiency, diagram, document, effect, envelope, environment, fishbone, flow, industry, kahashiwara, machine, manufacture, material, paper, pencil, safety, sketch

Circular Diagram Rules PDF
Presenting circular diagram rules pdf to provide visual cues and insights. Share and navigate important information on four stages that need your due attention. This template can be used to pitch topics like circular diagram. In addtion, this PPT design contains high resolution images, graphics, etc, that are easily editable and available for immediate download.

Circular Diagram Download PDF
Presenting circular diagram download pdf to provide visual cues and insights. Share and navigate important information on six stages that need your due attention. This template can be used to pitch topics like circular diagram. In addtion, this PPT design contains high resolution images, graphics, etc, that are easily editable and available for immediate download.

Circular Diagram Demonstration PDF
Presenting circular diagram demonstration pdf to provide visual cues and insights. Share and navigate important information on five stages that need your due attention. This template can be used to pitch topics like circular diagram. In addtion, this PPT design contains high resolution images, graphics, etc, that are easily editable and available for immediate download.

Circular Diagram Slides PDF
Presenting circular diagram slides pdf to provide visual cues and insights. Share and navigate important information on four stages that need your due attention. This template can be used to pitch topics like circular diagram. In addtion, this PPT design contains high resolution images, graphics, etc, that are easily editable and available for immediate download.
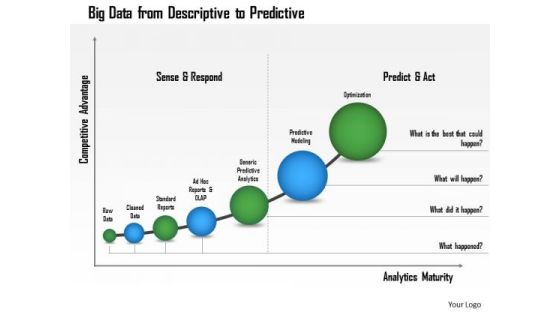
Business Framework Big Data From Descriptive To Predictive PowerPoint Presentation
Two funnel diagrams with text boxes are used to design this Power point template slide. This PPT slide contains the concept of AIDA marketing. Use this PPT for marketing and business presentations.
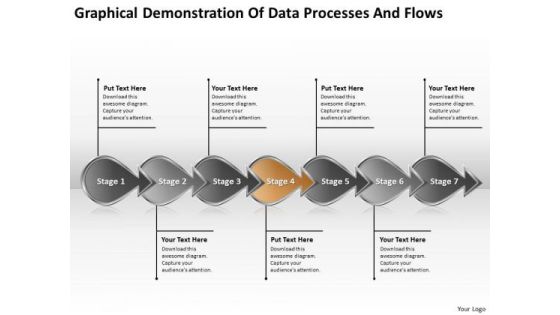
Demonstration Of Data Processes And Flows Chart Flowcharting PowerPoint Templates
We present our demonstration of data processes and flows chart flowcharting PowerPoint templates.Download and present our Leadership PowerPoint Templates because you know what it takes to keep it fit and healthy. Use our Business PowerPoint Templates because this template helps you to grab the attention of your listeners. Download our Arrows PowerPoint Templates because it helps to anticipate the doubts and questions in the minds of your colleagues and enlighten them with your inspired strategy to garner desired success. Download our Marketing PowerPoint Templates because the mind is always whirring with new ideas. Use our Process and Flows PowerPoint Templates because forward thinking is the way to go.Use these PowerPoint slides for presentations relating to Arrow Arrows Block Business Chart Design Development Diagram Direction Element Flow Flowchart Graph Linear Management Organization Process Program Section Sign Solution Symbol. The prominent colors used in the PowerPoint template are Orange, Gray, Black. Use our demonstration of data processes and flows chart flowcharting PowerPoint templates are Gorgeous. Presenters tell us our Block PowerPoint templates and PPT Slides are Radiant. Presenters tell us our demonstration of data processes and flows chart flowcharting PowerPoint templates are Tasteful. You can be sure our Development PowerPoint templates and PPT Slides are Versatile. PowerPoint presentation experts tell us our demonstration of data processes and flows chart flowcharting PowerPoint templates are Clever. Professionals tell us our Block PowerPoint templates and PPT Slides are Second to none.
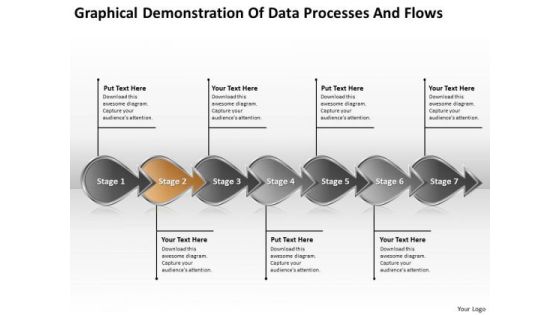
Demonstration Of Data Processes And Flows Flowcharting PowerPoint Templates
We present our demonstration of data processes and flows flowcharting PowerPoint templates.Download and present our Leadership PowerPoint Templates because presenting your views using our innovative slides, will be assured of leaving a lasting impression. Download our Business PowerPoint Templates because spell out your advertising plans to increase market share. The feedback has been positive and productive. Present our Arrows PowerPoint Templates because brilliant ideas are your forte. Present our Marketing PowerPoint Templates because The marketplace is the merger of your dreams and your ability. Download and present our Process and Flows PowerPoint Templates because displaying your ideas and highlighting your ability will accelerate the growth of your company and yours.Use these PowerPoint slides for presentations relating to Arrow Arrows Block Business Chart Design Development Diagram Direction Element Flow Flowchart Graph Linear Management Organization Process Program Section Sign Solution Symbol. The prominent colors used in the PowerPoint template are Orange, Gray, Black. Use our demonstration of data processes and flows flowcharting PowerPoint templates are Tasteful. Presenters tell us our Design PowerPoint templates and PPT Slides are Versatile. Presenters tell us our demonstration of data processes and flows flowcharting PowerPoint templates are Ritzy. You can be sure our Chart PowerPoint templates and PPT Slides are Whimsical. PowerPoint presentation experts tell us our demonstration of data processes and flows flowcharting PowerPoint templates are Nice. Professionals tell us our Chart PowerPoint templates and PPT Slides are Pretty.
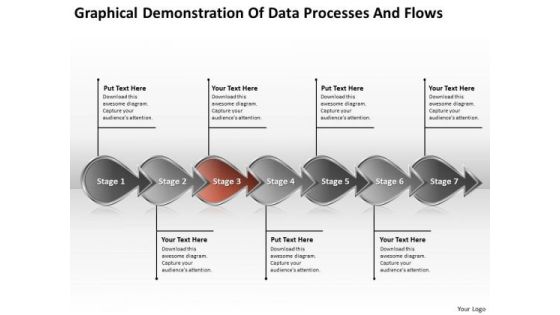
Demonstration Of Data Processes And Flows Business Flowcharting PowerPoint Templates
We present our demonstration of data processes and flows business flowcharting PowerPoint templates.Use our Leadership PowerPoint Templates because you can Raise your Company stocks at the Opening Bell. Present our Business PowerPoint Templates because you can Flutter your wings and enchant the world. Impress them with the innate attractiveness of your thoughts and words. Present our Arrows PowerPoint Templates because with the help of our Slides you can Illustrate your plans to your listeners with the same accuracy. Present our Marketing PowerPoint Templates because you can Determine your targets and sequence them as per your priorities. Present our Process and Flows PowerPoint Templates because our template will illustrate what you want to say.Use these PowerPoint slides for presentations relating to Arrow Arrows Block Business Chart Design Development Diagram Direction Element Flow Flowchart Graph Linear Management Organization Process Program Section Sign Solution Symbol. The prominent colors used in the PowerPoint template are Orange, Gray, Black. Use our demonstration of data processes and flows business flowcharting PowerPoint templates are Nifty. Presenters tell us our Direction PowerPoint templates and PPT Slides are Classic. Presenters tell us our demonstration of data processes and flows business flowcharting PowerPoint templates look good visually. You can be sure our Development PowerPoint templates and PPT Slides are Vintage. PowerPoint presentation experts tell us our demonstration of data processes and flows business flowcharting PowerPoint templates are Enchanting. Professionals tell us our Block PowerPoint templates and PPT Slides are Attractive.
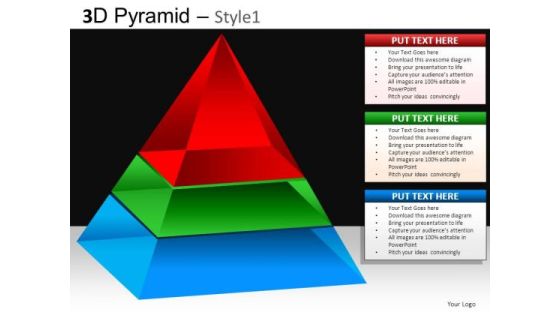
Process Diagram Pyramid Ppt
Process Diagram Pyramid PPT-These high quality powerpoint pre-designed slides and powerpoint templates have been carefully created by our professional team to help you impress your audience. All slides have been created and are 100% editable in powerpoint. Each and every property of any graphic - color, size, orientation, shading, outline etc. can be modified to help you build an effective powerpoint presentation. Any text can be entered at any point in the powerpoint template or slide. Simply DOWNLOAD, TYPE and PRESENT!

Funnel Diagram PowerPoint Templates
Funnel Diagram PowerPoint Templates-These high quality powerpoint pre-designed slides and powerpoint templates have been carefully created by our professional team to help you impress your audience. All slides have been created and are 100% editable in powerpoint. Each and every property of any graphic - color, size, orientation, shading, outline etc. can be modified to help you build an effective powerpoint presentation. Any text can be entered at any point in the powerpoint template or slide. Simply DOWNLOAD, TYPE and PRESENT!

PowerPoint Cycle Diagram Chart
PowerPoint Cycle Diagram ChartThese high quality powerpoint pre-designed slides and powerpoint templates have been carefully created by our professional team to help you impress your audience. All slides have been created and are 100% editable in powerpoint. Each and every property of any graphic - color, size, orientation, shading, outline etc. can be modified to help you build an effective powerpoint presentation. Any text can be entered at any point in the powerpoint template or slide. Simply DOWNLOAD, TYPE and PRESENT!

Business Flow Diagram Ppt
Business Flow Diagram PPT-These high quality powerpoint pre-designed slides and powerpoint templates have been carefully created by our professional team to help you impress your audience. All slides have been created and are 100% editable in powerpoint. Each and every property of any graphic - color, size, orientation, shading, outline etc. can be modified to help you build an effective powerpoint presentation. Any text can be entered at any point in the powerpoint template or slide. Simply DOWNLOAD, TYPE and PRESENT!

Cube Diagram PowerPoint Slides
Cube Diagram PowerPoint Slides-These high quality powerpoint pre-designed slides and powerpoint templates have been carefully created by our professional team to help you impress your audience. All slides have been created and are 100% editable in powerpoint. Each and every property of any graphic - color, size, orientation, shading, outline etc. can be modified to help you build an effective powerpoint presentation. Any text can be entered at any point in the powerpoint template or slide. Simply DOWNLOAD, TYPE and PRESENT!

Checklist Diagram PowerPoint
Checklist Diagram PowerPointThese high quality powerpoint pre-designed slides and powerpoint templates have been carefully created by our professional team to help you impress your audience. All slides have been created and are 100% editable in powerpoint. Each and every property of any graphic - color, size, orientation, shading, outline etc. can be modified to help you build an effective powerpoint presentation. Any text can be entered at any point in the powerpoint template or slide. Simply DOWNLOAD, TYPE and PRESENT!
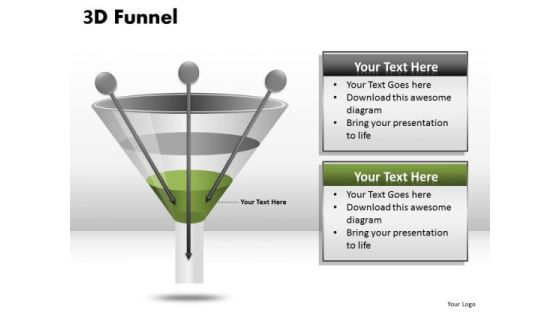
Funnel Diagram PowerPoint Template
Funnel Diagram PowerPoint template-These high quality powerpoint pre-designed slides and powerpoint templates have been carefully created by our professional team to help you impress your audience. All slides have been created and are 100% editable in powerpoint. Each and every property of any graphic - color, size, orientation, shading, outline etc. can be modified to help you build an effective powerpoint presentation. Any text can be entered at any point in the powerpoint template or slide. Simply DOWNLOAD, TYPE and PRESENT! These PowerPoint presentation slides can be used to represent themes relating to -

Decision Support System Guidelines For Data Warehouse Design Sample PDF
This slide represents the guidelines for data warehouse design, such as describing the business requirements, development of conceptual design, logical and physical design, and so on. This is a Decision Support System Guidelines For Data Warehouse Design Sample PDF template with various stages. Focus and dispense information on six stages using this creative set, that comes with editable features. It contains large content boxes to add your information on topics like Physical Designs, Physical Structure, Physical Architecture. You can also showcase facts, figures, and other relevant content using this PPT layout. Grab it now.
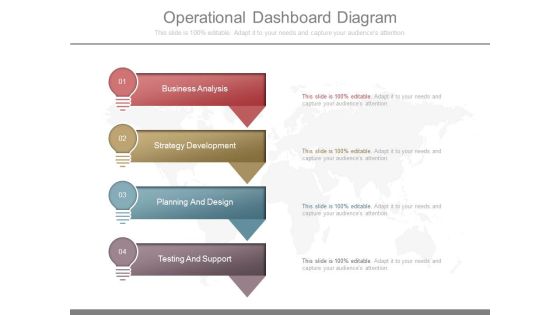
Operational Dashboard Diagram
This is a operational dashboard diagram. This is a four stage process. The stages in this process are business analysis, strategy development, planning and design, testing and support.

Business Diagram Five Staged Pencil Style Text Boxes Presentation Template
Our above slide displays five staged pencil style text boxes. Download our above diagram to express information in a visual way. Use this diagram and get good comments for data related presentations.

Financial Enterprise Data Governance Plan Ppt Icon Visuals PDF
This slide showcases an ideal structure to utilize data within the organization to ensure security and reliability of data in enterprises according to the data usage policies and standards. The key strategies include identify data source, define data, standardize data and data handling. Persuade your audience using this Financial Enterprise Data Governance Plan Ppt Icon Visuals PDF. This PPT design covers four stages, thus making it a great tool to use. It also caters to a variety of topics including Identify Data Source, Define Data, Standardize Data, Data Handling. Download this PPT design now to present a convincing pitch that not only emphasizes the topic but also showcases your presentation skills.

5 Steps Of A Data Science Project Lifecycle Inspiration PDF
This slide showcases data science process using OSEMN framework. Key steps of this framework are data gathering, data cleaning, data analysis, data forecasting and data interpretation. Presenting 5 Steps Of A Data Science Project Lifecycle Inspiration PDF to dispense important information. This template comprises five stages. It also presents valuable insights into the topics including Data Forcasting, Data Interpretation, Data Analysis. This is a completely customizable PowerPoint theme that can be put to use immediately. So, download it and address the topic impactfully.

Data Analytics Vector Icon Ppt Powerpoint Presentation Icon Designs
This is a data analytics vector icon ppt powerpoint presentation icon designs. This is a four stage process. The stages in this process are data visualization icon, data management icon.

Challenges And Solutions Of Data Governance Operating Framework Rules PDF
This slide illustrates challenges associated with implementation of data governance operating model. It includes functional areas such as data insights, data quality, data ownership, etc. Presenting Challenges And Solutions Of Data Governance Operating Framework Rules PDF to dispense important information. This template comprises five stages. It also presents valuable insights into the topics including Data Insights, Data Quality, Data Ownership. This is a completely customizable PowerPoint theme that can be put to use immediately. So, download it and address the topic impactfully.

Service Price Matrix For Big Data Analytics Themes PDF
This slide includes various data management services which can be used by companies to build competitive advantage. It includes services such as data migration, data integration, data security, data analytics and data quality management. Pitch your topic with ease and precision using this Service Price Matrix For Big Data Analytics Themes PDF. This layout presents information on Assessment Of Business, Financial Data, Data Quality Management. It is also available for immediate download and adjustment. So, changes can be made in the color, design, graphics or any other component to create a unique layout.

Data Enablement Framework And Security Training Program Icons PDF
This slide illustrates three day training workshop for data enablement and data security. It includes audience, objectives, data governance, data security, etc. Presenting Data Enablement Framework And Security Training Program Icons PDF to dispense important information. This template comprises three stages. It also presents valuable insights into the topics including Cloud Data Foundation, Security Model Introduction, User Management. This is a completely customizable PowerPoint theme that can be put to use immediately. So, download it and address the topic impactfully.

Lego Blocks Design For Data Representation Powerpoint Slides
This PowerPoint template has been designed with Lego blocks diagram. You can use this ppt slide for statistical analysis or for data representation. Download this PPT slide to build impressive presentations.

 Home
Home