Data Architecture Diagram
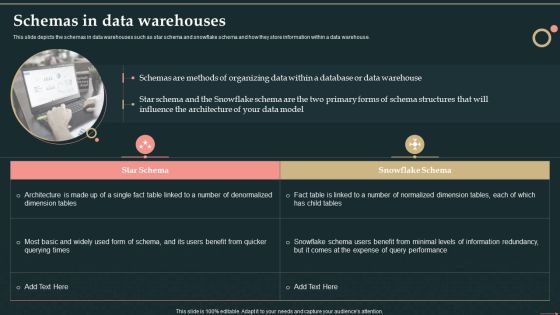
Management Information System Schemas In Data Warehouses Infographics PDF
This slide depicts the schemas in data warehouses such as star schema and snowflake schema and how they store information within a data warehouse.This is a Management Information System Schemas In Data Warehouses Infographics PDF template with various stages. Focus and dispense information on two stages using this creative set, that comes with editable features. It contains large content boxes to add your information on topics like Snowflake Schema, Architecture Made, Benefit Quicker. You can also showcase facts, figures, and other relevant content using this PPT layout. Grab it now.

Big Data And Analytics Framework Implementation Challenges Themes PDF
This slide provide information about various challenges faced while implementing big data and analytics architecture in organization along with its solutions. It includes challenges such as complexity, skillset, technology maturity and security Pitch your topic with ease and precision using this Big Data And Analytics Framework Implementation Challenges Themes PDF. This layout presents information on Challenges, Description, Solutions . It is also available for immediate download and adjustment. So, changes can be made in the color, design, graphics or any other component to create a unique layout.

Multi Segment Circle For Data Interpretation Powerpoint Template
This PowerPoint template has been designed with circular web diagram. This diagram is useful to display outline of a business plan. Visual effect helps in maintaining the flow of the discussion and provides more clarity to the subject.

Consulting Slides Bar Chart For Data Interpretation Business Presentation
This pre-designed and appealing bar chart for PowerPoint offer an optimized possibility to illustrate your business strategy. You can use this diagram for data interpretation. This diagram is editable and can be easily adjusted.

Apache Hadoop IT Apache Pig Tool For Big Data Management In Hadoop Diagrams PDF
This slide depicts the Apache pig tool for big data management in Hadoop, including its architecture, features, and various functions such as a filter, join, etc.Deliver and pitch your topic in the best possible manner with this apache hadoop it apache pig tool for big data management in hadoop diagrams pdf Use them to share invaluable insights on execution engine, programmers can build, data transformations and impress your audience. This template can be altered and modified as per your expectations. So, grab it now.

Semantic Data Searching Technique Overview Of Semantic Web Layers Diagrams PDF
This slide represents the overview of semantic web layers that includes trust, proof, logic, ontology vocabulary, RDF and RDF schema, XML and NS and XML schema, Unicode, URI, and digital signature. It also caters to the working of every layer in the architecture. The best PPT templates are a great way to save time, energy, and resources. Slidegeeks have 100 percent editable powerpoint slides making them incredibly versatile. With these quality presentation templates, you can create a captivating and memorable presentation by combining visually appealing slides and effectively communicating your message. Download Semantic Data Searching Technique Overview Of Semantic Web Layers Diagrams PDF from Slidegeeks and deliver a wonderful presentation.

Decision Support System Main Types Of Data Warehouse Ppt File Diagrams PDF
This slide depicts the various types of data warehouses, such as enterprise data warehouses, operational data stores, and data marts. Presenting Decision Support System Main Types Of Data Warehouse Ppt File Diagrams PDF to provide visual cues and insights. Share and navigate important information on three stages that need your due attention. This template can be used to pitch topics like Data Warehouse, Data Mart, Enterprise Data Warehouse, Operational Data Store. In addtion, this PPT design contains high resolution images, graphics, etc, that are easily editable and available for immediate download.

Decision Support System What Are The Stages Of Data Warehousing Diagrams PDF
This slide represents the stages of data warehouse such as operational database, offline data warehouse, real-time data warehouse, and integrated data warehouse. Presenting Decision Support System What Are The Stages Of Data Warehousing Diagrams PDF to provide visual cues and insights. Share and navigate important information on four stages that need your due attention. This template can be used to pitch topics like Operational Database, Offline Data Warehouse, Integrated Data Warehouse. In addtion, this PPT design contains high resolution images, graphics, etc, that are easily editable and available for immediate download.

Information Transformation Process Toolkit Data Analytics Work Streams With Its Roles And Responsibilities Diagrams PDF
This slide highlights the key responsibilities, data work streams and. and data head roles for constructing data analytics project. Presenting Information Transformation Process Toolkit Data Analytics Work Streams With Its Roles And Responsibilities Diagrams PDF to provide visual cues and insights. Share and navigate important information on six stages that need your due attention. This template can be used to pitch topics like Data Engineer, Project Executive, Data Analyst. In addtion, this PPT design contains high resolution images, graphics, etc, that are easily editable and available for immediate download.
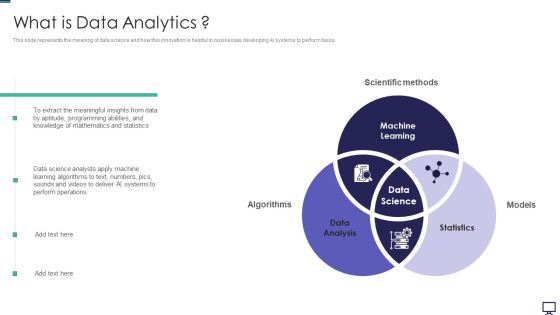
What Is Data Analytics Ppt Professional Slide PDF
This slide represents the meaning of data science and how this innovation is helpful in businesses developing AI systems to perform tasks. Presenting what is data analytics ppt professional slide pdf to provide visual cues and insights. Share and navigate important information on three stages that need your due attention. This template can be used to pitch topics like data analysis, statistics, machine learning. In addtion, this PPT design contains high resolution images, graphics, etc, that are easily editable and available for immediate download.

Scientific Computing IT Computational Science Vs Data Science Introduction PDF
This slide represents a comparison between computational science and data science, including the sub-components of both data science and computational science.Presenting scientific computing it computational science vs data science introduction pdf to provide visual cues and insights. Share and navigate important information on three stages that need your due attention. This template can be used to pitch topics like domain knowledge, statistics and machine learning, engineering In addtion, this PPT design contains high resolution images, graphics, etc, that are easily editable and available for immediate download.

Business Diagram Fishbowl Diagram With 2014 And 2015 Year Text For Business Timeline Presentation Te
This business slide displays fish bowl diagram with 2014 and 2015 year numbers. This diagram depicts fish moving from year 2014 to year 2015. Use this diagram to build exclusive presentations for your viewers.

Business Diagram Four Fish Bowl Diagram For 2013 And 2016 Year Text For Business Timeline Presentati
This business slide displays fish bowl diagram with 2013 and 2016 year numbers. This diagram depicts fish moving from year 2015 to year 2016. Use this diagram to build exclusive presentations for your viewers.

Executive Information Database System Guidelines For Data Warehouse Design Diagrams PDF
This slide represents the guidelines for data warehouse design, such as describing the business requirements, development of conceptual design, logical and physical design, and so on.Deliver and pitch your topic in the best possible manner with this Executive Information Database System Guidelines For Data Warehouse Design Diagrams PDF. Use them to share invaluable insights on Data Warehouses, Concerns Relationships, Recovery Operations and impress your audience. This template can be altered and modified as per your expectations. So, grab it now.
Online Data Safety Maturity Framework Vector Icon Ppt PowerPoint Presentation Icon Diagrams PDF
Presenting online data safety maturity framework vector icon ppt powerpoint presentation icon diagrams pdf to dispense important information. This template comprises three stages. It also presents valuable insights into the topics including online data safety maturity framework vector icon. This is a completely customizable PowerPoint theme that can be put to use immediately. So, download it and address the topic impactfully.
Four Ds Data Sets Shape Icons Diagrams Ppt PowerPoint Presentation Guidelines
This is a four ds data sets shape icons diagrams ppt powerpoint presentation guidelines. This is a four stage process. The stages in this process are deposit, discover, design, decide.

Busines Diagram Four Staged Infographics Process Flow Presentation Template
This slide displays four staged info graphics has been used to depict flow of business steps. This professional diagram can be used for business and marketing presentations. Use this slide to build quality presentations for your viewers.

Healthcare Data Mining And Analysis Icon Ppt PowerPoint Presentation Styles Diagrams PDF
Pitch your topic with ease and precision using this Healthcare Data Mining And Analysis Icon Ppt PowerPoint Presentation Styles Diagrams PDF. This layout presents information on Healthcare Data, Mining Analysis Icon. It is also available for immediate download and adjustment. So, changes can be made in the color, design, graphics or any other component to create a unique layout.

Bar Chart Representing Strategies To Promote Data Driven Organizational Culture Diagrams PDF
Showcasing this set of slides titled bar chart representing strategies to promote data driven organizational culture diagrams pdf. The topics addressed in these templates are bar chart representing strategies to promote data driven organizational culture. All the content presented in this PPT design is completely editable. Download it and make adjustments in color, background, font etc. as per your unique business setting.

Data Analytics IT Tasks And Skills Of Statistician Ppt Pictures Diagrams PDF
This slide represents the tasks performed by a statistician in data science and his skills such as data mining, distributive computing, database systems, and cloud tools. Presenting data analytics it tasks and skills of statistician ppt pictures diagrams pdf to provide visual cues and insights. Share and navigate important information on six stages that need your due attention. This template can be used to pitch topics like statistical theories and methodologies, cloud tools, database systems, distributive computing, data mining and ml. In addtion, this PPT design contains high resolution images, graphics, etc, that are easily editable and available for immediate download.

Cloud Security Assessment Cloud Security Checklist Backup And Data Recovery Diagrams PDF
This slide represents the importance of data backup and data recovery in cloud security. It also shows how organizations should know about the data backup policies of service providers before investing in them. Presenting Cloud Security Assessment Cloud Security Checklist Backup And Data Recovery Diagrams PDF to provide visual cues and insights. Share and navigate important information on three stages that need your due attention. This template can be used to pitch topics like Service Provider, Effective Plans, Natural Disasters In addtion, this PPT design contains high resolution images, graphics, etc, that are easily editable and available for immediate download.

Essential Elements Of Data Lake And Analytics Solution Ppt PowerPoint Presentation File Diagrams PDF
This slide describes the essential elements of data lake and analytics solution including data movement, analytics, machine learning, and securely store, and cataloging data. This Essential Elements Of Data Lake And Analytics Solution Ppt PowerPoint Presentation File Diagrams PDF is perfect for any presentation, be it in front of clients or colleagues. It is a versatile and stylish solution for organizing your meetings. The product features a modern design for your presentation meetings. The adjustable and customizable slides provide unlimited possibilities for acing up your presentation. Slidegeeks has done all the homework before launching the product for you. So, do not wait, grab the presentation templates today.
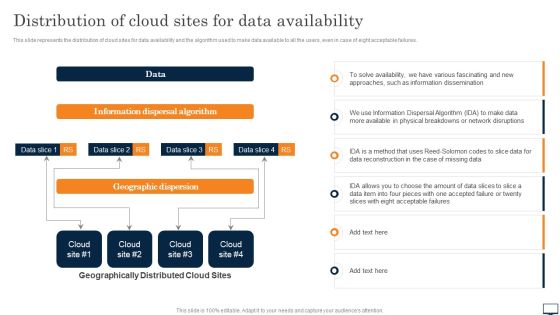
Distribution Of Cloud Sites For Data Availability Ppt PowerPoint Presentation File Diagrams PDF
This slide represents the distribution of cloud sites for data availability and the algorithm used to make data available to all the users, even in case of eight acceptable failures. Crafting an eye catching presentation has never been more straightforward. Let your presentation shine with this tasteful yet straightforward Distribution Of Cloud Sites For Data Availability Ppt PowerPoint Presentation File Diagrams PDF template. It offers a minimalistic and classy look that is great for making a statement. The colors have been employed intelligently to add a bit of playfulness while still remaining professional. Construct the ideal Distribution Of Cloud Sites For Data Availability Ppt PowerPoint Presentation File Diagrams PDF that effortlessly grabs the attention of your audience Begin now and be certain to wow your customers.

Investment Crowdfunding Platforms Data Indicating Equity And Debt Raised For Real Estate Diagrams PDF
This slide exhibits crowdfunding platforms data indicating equity and debt raised for real estate. It includes information about platforms and amount collected which can be referred by investors to choose best platforms to gain maximum ROI.Showcasing this set of slides titled Investment Crowdfunding Platforms Data Indicating Equity And Debt Raised For Real Estate Diagrams PDF. The topics addressed in these templates are Collected Financed, Highest Amount, Estate Industry. All the content presented in this PPT design is completely editable. Download it and make adjustments in color, background, font etc. as per your unique business setting.

Optimizing Fiber Distributed Data Interface To Enhance Processes Phy Physical Layer Protocol Diagrams PDF
This slide describes the physical layer protocol as coding and decoding of data, clock synchronization, symbols of data, violation symbols, and so on. Do you have an important presentation coming up Are you looking for something that will make your presentation stand out from the rest Look no further than Optimizing Fiber Distributed Data Interface To Enhance Processes Phy Physical Layer Protocol Diagrams PDF. With our professional designs, you can trust that your presentation will pop and make delivering it a smooth process. And with Slidegeeks, you can trust that your presentation will be unique and memorable. So why wait Grab Optimizing Fiber Distributed Data Interface To Enhance Processes Phy Physical Layer Protocol Diagrams PDF today and make your presentation stand out from the rest.
User And Owner Data Center With Icons Ppt PowerPoint Presentation Layouts Diagrams PDF
Persuade your audience using this user and owner data center with icons ppt powerpoint presentation layouts diagrams pdf. This PPT design covers seven stages, thus making it a great tool to use. It also caters to a variety of topics including user and owner data center with icons. Download this PPT design now to present a convincing pitch that not only emphasizes the topic but also showcases your presentation skills

Assessment And Workflow Data Center Relocation Process Step 5 Final Planning Diagrams PDF
This slide shows the fifth step that is involved in data center relocation process which is to be implemented for minimizing data center costs and improving scalability i.e. final planning. Do you have an important presentation coming up Are you looking for something that will make your presentation stand out from the rest Look no further than Assessment And Workflow Data Center Relocation Process Step 5 Final Planning Diagrams PDF. With our professional designs, you can trust that your presentation will pop and make delivering it a smooth process. And with Slidegeeks, you can trust that your presentation will be unique and memorable. So why wait Grab Assessment And Workflow Data Center Relocation Process Step 5 Final Planning Diagrams PDF today and make your presentation stand out from the rest.

Business Intelligence And Big Data Analytics Change Management Communication Plan Diagrams PDF
Here, we are describing the communication plan of implementing the change in data analytics project. It includes sections such as designated leader who support the change, respective departments and key actions for rationalizing the change in the process. Deliver and pitch your topic in the best possible manner with this business intelligence and big data analytics change management communication plan diagrams pdf. Use them to share invaluable insights on change management model, organization, apply data analytics and impress your audience. This template can be altered and modified as per your expectations. So, grab it now.

5G Network Applications And Features Service Data Adaptation Protocol SDAP Functions Diagrams PDF
This slide outlines the functions of the service data adaptation protocol sublayer in 5G-NR layer 2, and it includes mapping between the quality of service flow and a data radio bearer, marking or QoS flow ID in Dl and UL packets, and so on. If your project calls for a presentation, then Slidegeeks is your go-to partner because we have professionally designed, easy-to-edit templates that are perfect for any presentation. After downloading, you can easily edit 5G Network Applications And Features Service Data Adaptation Protocol SDAP Functions Diagrams PDF and make the changes accordingly. You can rearrange slides or fill them with different images. Check out all the handy templates.

Business Diagram Three Staged Fish Bowl Diagram For 2013 To 2015 Year Text Presentation Template
This business slide depicts six staged spiral diagram. This diagram provides an effective way of displaying information you can edit text, color, shade and style as per you need. Present your views using this innovative slide and be assured of leaving a lasting impression.

Agenda For Data Governance IT Ppt PowerPoint Presentation File Diagrams PDF
If you are looking for a format to display your unique thoughts, then the professionally designed Agenda For Data Governance IT Ppt PowerPoint Presentation File Diagrams PDF is the one for you. You can use it as a Google Slides template or a PowerPoint template. Incorporate impressive visuals, symbols, images, and other charts. Modify or reorganize the text boxes as you desire. Experiment with shade schemes and font pairings. Alter, share or cooperate with other people on your work. Download Agenda For Data Governance IT Ppt PowerPoint Presentation File Diagrams PDF and find out how to give a successful presentation. Present a perfect display to your team and make your presentation unforgettable.

Risk Management Model For Data Security Information Security Decision Framework Prism Diagrams PDF
Deliver an awe inspiring pitch with this creative Risk Management Model For Data Security Information Security Decision Framework Prism Diagrams PDF bundle. Topics like Key Risk Areas, Vectors, Risk Factors, Prioritization Weighting, Resource Allocation can be discussed with this completely editable template. It is available for immediate download depending on the needs and requirements of the user.
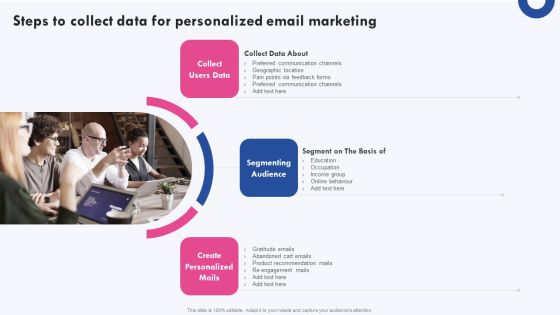
Targeted Marketing Campaigns To Improve Buyers Experience Steps To Collect Data For Personalized Email Diagrams PDF
Do you have an important presentation coming up Are you looking for something that will make your presentation stand out from the rest Look no further than Targeted Marketing Campaigns To Improve Buyers Experience Steps To Collect Data For Personalized Email Diagrams PDF. With our professional designs, you can trust that your presentation will pop and make delivering it a smooth process. And with Slidegeeks, you can trust that your presentation will be unique and memorable. So why wait Grab Targeted Marketing Campaigns To Improve Buyers Experience Steps To Collect Data For Personalized Email Diagrams PDF today and make your presentation stand out from the rest.

Data And Customer Analysis Company Outline Revenue And Operating Income Diagrams PDF
This slide highlights the Nielsen company revenue and operating income for the last 3 years. It includes the data in million of US dollars with a key takeaways section. Create an editable Data And Customer Analysis Company Outline Revenue And Operating Income Diagrams PDF that communicates your idea and engages your audience. Whether youre presenting a business or an educational presentation, pre designed presentation templates help save time. Data And Customer Analysis Company Outline Revenue And Operating Income Diagrams PDF is highly customizable and very easy to edit, covering many different styles from creative to business presentations. Slidegeeks has creative team members who have crafted amazing templates. So, go and get them without any delay.

PowerPoint Design Diagram Property Short Sale Ppt Process
PowerPoint Design Diagram property short sale PPT Process-These high quality powerpoint pre-designed slides and powerpoint templates have been carefully created by our professional team to help you impress your audience. All slides have been created and are 100% editable in powerpoint. Each and every property of any graphic - color, size, orientation, shading, outline etc. can be modified to help you build an effective powerpoint presentation. Any text can be entered at any point in the powerpoint template or slide. Simply DOWNLOAD, TYPE and PRESENT!
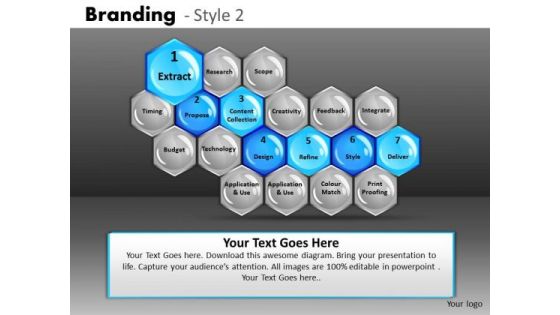
Editable Stages Hexagonal Process Diagram PowerPoint Slides Ppt Templates
Editable Stages Hexagonal Process Diagram PowerPoint Slides PPT templates-These high quality powerpoint pre-designed slides and powerpoint templates have been carefully created by our professional team to help you impress your audience. All slides have been created and are 100% editable in powerpoint. Each and every property of any graphic - color, size, orientation, shading, outline etc. can be modified to help you build an effective powerpoint presentation. Any text can be entered at any point in the powerpoint template or slide. Simply DOWNLOAD, TYPE and PRESENT! These PowerPoint presentation slides can be used to represent themes relating to -
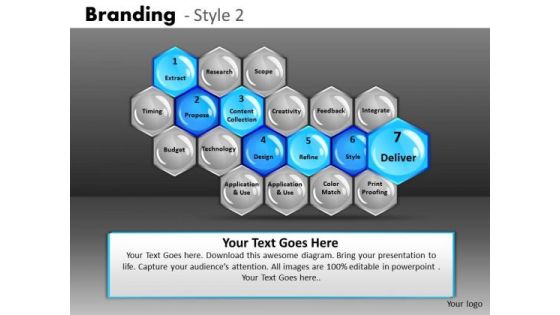
PowerPoint Slides 7th Stage Hexagon Process Diagram Ppt Templates
PowerPoint Slides 7th Stage Hexagon Process Diagram PPT Templates-These high quality powerpoint pre-designed slides and powerpoint templates have been carefully created by our professional team to help you impress your audience. All slides have been created and are 100% editable in powerpoint. Each and every property of any graphic - color, size, orientation, shading, outline etc. can be modified to help you build an effective powerpoint presentation. Any text can be entered at any point in the powerpoint template or slide. Simply DOWNLOAD, TYPE and PRESENT! These PowerPoint presentation slides can be used to represent themes relating to -
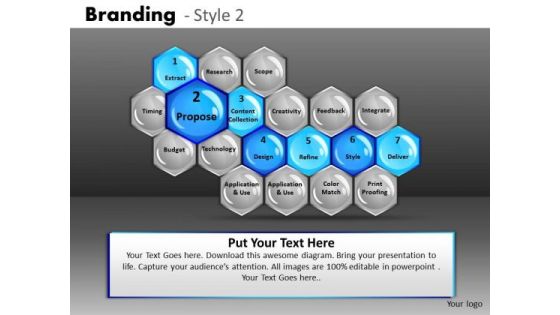
Ppt Templates Branding Process Hexagon Diagram PowerPoint Slides
PPT templates Branding Process Hexagon Diagram PowerPoint Slides-These high quality powerpoint pre-designed slides and powerpoint templates have been carefully created by our professional team to help you impress your audience. All slides have been created and are 100% editable in powerpoint. Each and every property of any graphic - color, size, orientation, shading, outline etc. can be modified to help you build an effective powerpoint presentation. Any text can be entered at any point in the powerpoint template or slide. Simply DOWNLOAD, TYPE and PRESENT! These PowerPoint presentation slides can be used to represent themes relating to -

Software KPI Data Of Warehouse With Manufacturer And Category Diagrams PDF
Showcasing this set of slides titled Software KPI Data Of Warehouse With Manufacturer And Category Diagrams PDF The topics addressed in these templates are Software Product Versions, Capabilities With Internal, Applications By Capability All the content presented in this PPT design is completely editable. Download it and make adjustments in color, background, font etc. as per your unique business setting.
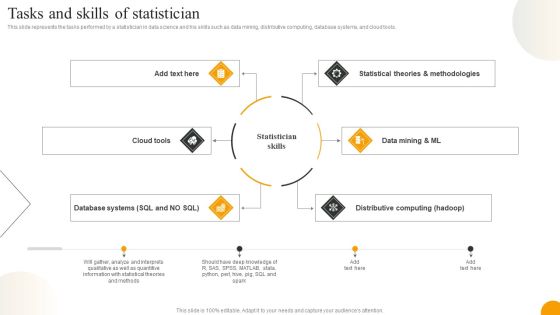
Using Data Science Technologies For Business Transformation Tasks And Skills Of Statistician Diagrams PDF
This slide represents the tasks performed by a statistician in data science and his skills such as data mining, distributive computing, database systems, and cloud tools. This modern and well arranged Using Data Science Technologies For Business Transformation Tasks And Skills Of Statistician Diagrams PDF provides lots of creative possibilities. It is very simple to customize and edit with the Powerpoint Software. Just drag and drop your pictures into the shapes. All facets of this template can be edited with Powerpoint no extra software is necessary. Add your own material, put your images in the places assigned for them, adjust the colors, and then you can show your slides to the world, with an animated slide included.
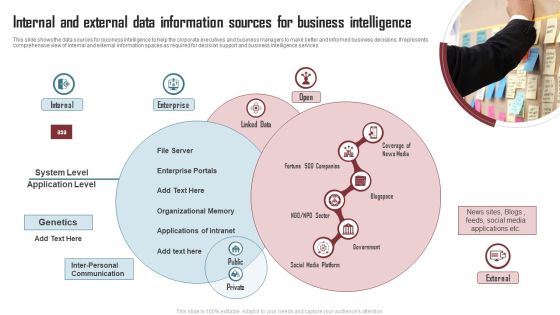
Internal And External Data Information Sources For Business Intelligence Diagrams PDF
This slide shows the data sources for business intelligence to help the corporate executives and business managers to make better and informed business decisions. It represents comprehensive view of internal and external information spaces as required for decision support and business intelligence services. Persuade your audience using this Internal And External Data Information Sources For Business Intelligence Diagrams PDF. This PPT design covers One stage, thus making it a great tool to use. It also caters to a variety of topics including File Server, Enterprise Portals, Organizational Memory. Download this PPT design now to present a convincing pitch that not only emphasizes the topic but also showcases your presentation skills.

Agile Techniques For Data Migration Available Agile Methodologies For Project Scrum Process Diagrams PDF
This slide displays scrum process that can be used by the organization for its data conversion project. It also includes information about scrum process design principle and its testing approach. Deliver and pitch your topic in the best possible manner with this Agile Techniques For Data Migration Available Agile Methodologies For Project Scrum Process Diagrams PDF. Use them to share invaluable insights on Development Phase, Postgame Phase, Pregame Phase, Planning and impress your audience. This template can be altered and modified as per your expectations. So, grab it now.

Medical Care Benefits Of Using Healthcare Data Management Mobile App Diagrams PDF
This slide shows the benefits of using healthcare data management mobile app. This includes various benefits of the application to the providers and the customers such as easily availability of health related information, secure connection, customization, etc. Presenting medical care benefits of using healthcare data management mobile app diagrams pdf to provide visual cues and insights. Share and navigate important information on one stages that need your due attention. This template can be used to pitch topics like security, patient, information, benefits. In addtion, this PPT design contains high resolution images, graphics, etc, that are easily editable and available for immediate download.
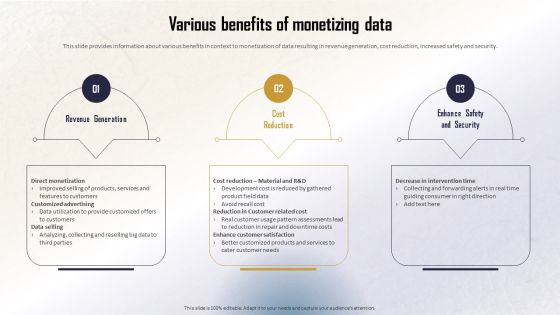
Identifying Direct And Indirect Various Benefits Of Monetizing Data Diagrams PDF
This slide provides information about various benefits in context to monetization of data resulting in revenue generation, cost reduction, increased safety and security. Take your projects to the next level with our ultimate collection of Identifying Direct And Indirect Various Benefits Of Monetizing Data Diagrams PDF. Slidegeeks has designed a range of layouts that are perfect for representing task or activity duration, keeping track of all your deadlines at a glance. Tailor these designs to your exact needs and give them a truly corporate look with your own brand colors theyll make your projects stand out from the rest

Cloud Security Assessment How Does Cloud Security Work Data Security Diagrams PDF
This slide represents the data recovery and business continuity plan in cloud security and what to consider while making a business continuity plan.Presenting Cloud Security Assessment How Does Cloud Security Work Data Security Diagrams PDF to provide visual cues and insights. Share and navigate important information on four stages that need your due attention. This template can be used to pitch topics like Impact Analysis, Recovery Strategies, Plan Development. In addtion, this PPT design contains high resolution images, graphics, etc, that are easily editable and available for immediate download.

Benefits Of Metadata Management To Data Analysts In Organization Diagrams PDF
This slide covers the basic benefits of metadata for any data reader in an organization. The purpose of this template is to define usage of metadata for increasing business revenue. It also includes details related to websites, consumers, social media, etc. Showcasing this set of slides titled Benefits Of Metadata Management To Data Analysts In Organization Diagrams PDF. The topics addressed in these templates are Benefits, Action Steps, Outcomes. All the content presented in this PPT design is completely editable. Download it and make adjustments in color, background, font etc. as per your unique business setting.
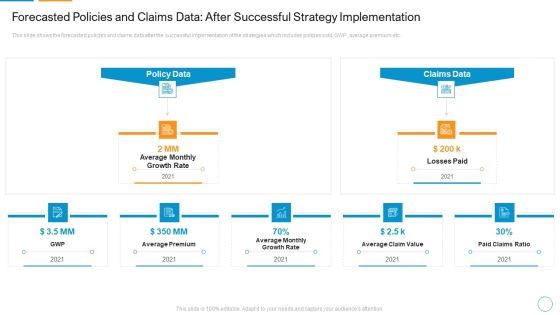
Forecasted Policies And Claims Data After Successful Strategy Implementation Diagrams PDF
This slide shows the forecasted policies and claims data after the successful implementation of the strategies which includes policies sold, GWP, average premium etc.Presenting forecasted policies and claims data after successful strategy implementation diagrams pdf to provide visual cues and insights. Share and navigate important information on five stages that need your due attention. This template can be used to pitch topics like average premium, average monthly growth rate, average claim value. In addtion, this PPT design contains high resolution images, graphics, etc, that are easily editable and available for immediate download.

Identifying Direct And Indirect Selecting Suitable Data Analytics Tool Diagrams PDF
This slide will help firm in choosing the suitable data analytics tool which is to handle existing bulk of data. The firm will choose effective tool with features such as API integration, centralized platform, business intelligence etc. Retrieve professionally designed Identifying Direct And Indirect Selecting Suitable Data Analytics Tool Diagrams PDF to effectively convey your message and captivate your listeners. Save time by selecting pre-made slideshows that are appropriate for various topics, from business to educational purposes. These themes come in many different styles, from creative to corporate, and all of them are easily adjustable and can be edited quickly. Access them as PowerPoint templates or as Google Slides themes. You dont have to go on a hunt for the perfect presentation because Slidegeeks got you covered from everywhere.

Data Safety Initiatives Information Security Program Framework Key Components Diagrams PDF
Mentioned slide portrays the key components of companys information security framework. Components covered are context and leadership, evaluation and direction, prevention, detection etc. Deliver and pitch your topic in the best possible manner with this data safety initiatives information security program framework key components diagrams pdf. Use them to share invaluable insights on governance, management, context and leadership, evaluation and direction, infrastructure security and impress your audience. This template can be altered and modified as per your expectations. So, grab it now.

Table Of Contents For BI Technique For Data Informed Decisions Tool Diagrams PDF
If your project calls for a presentation, then Slidegeeks is your go to partner because we have professionally designed, easy to edit templates that are perfect for any presentation. After downloading, you can easily edit Table Of Contents For BI Technique For Data Informed Decisions Tool Diagrams PDF and make the changes accordingly. You can rearrange slides or fill them with different images. Check out all the handy templates.

30 60 90 Days Plan For Fibre Distributed Data Interface Diagrams PDF
This slide shows the 30 60 90 days plan for FDDI implementation, including deciding the suitable cable vendor, estimating the budget cost, and so on. If you are looking for a format to display your unique thoughts, then the professionally designed 30 60 90 Days Plan For Fibre Distributed Data Interface Diagrams PDF is the one for you. You can use it as a Google Slides template or a PowerPoint template. Incorporate impressive visuals, symbols, images, and other charts. Modify or reorganize the text boxes as you desire. Experiment with shade schemes and font pairings. Alter, share or cooperate with other people on your work. Download 30 60 90 Days Plan For Fibre Distributed Data Interface Diagrams PDF and find out how to give a successful presentation. Present a perfect display to your team and make your presentation unforgettable.

Predictive Analytics In The Age Of Big Data Overview Of Regression Model Types Diagrams PDF
This slide represents the types of the regression model, including its overview, examples, and usage percentage. The main types of regression include linear, multiple linear, stepwise regression modelling, and non-linear regression. If you are looking for a format to display your unique thoughts, then the professionally designed Predictive Analytics In The Age Of Big Data Overview Of Regression Model Types Diagrams PDF is the one for you. You can use it as a Google Slides template or a PowerPoint template. Incorporate impressive visuals, symbols, images, and other charts. Modify or reorganize the text boxes as you desire. Experiment with shade schemes and font pairings. Alter, share or cooperate with other people on your work. Download Predictive Analytics In The Age Of Big Data Overview Of Regression Model Types Diagrams PDF and find out how to give a successful presentation. Present a perfect display to your team and make your presentation unforgettable.
Methods Of Real World Data Management With Icons Ppt PowerPoint Presentation Icon Diagrams PDF
Persuade your audience using this methods of real world data management with icons ppt powerpoint presentation icon diagrams pdf. This PPT design covers five stages, thus making it a great tool to use. It also caters to a variety of topics including social media optimization, innovation and product development, marketing and sales forecasts. Download this PPT design now to present a convincing pitch that not only emphasizes the topic but also showcases your presentation skills.

Data Analytics Business Case And Roadmap Business Analysis Modification Toolkit Diagrams PDF
Presenting Data Analytics Business Case And Roadmap Business Analysis Modification Toolkit Diagrams PDF to provide visual cues and insights. Share and navigate important information on one stage that need your due attention. This template can be used to pitch topics like Identify Business, Governance Initiatives, Governance Model. In addtion, this PPT design contains high resolution images, graphics, etc, that are easily editable and available for immediate download.
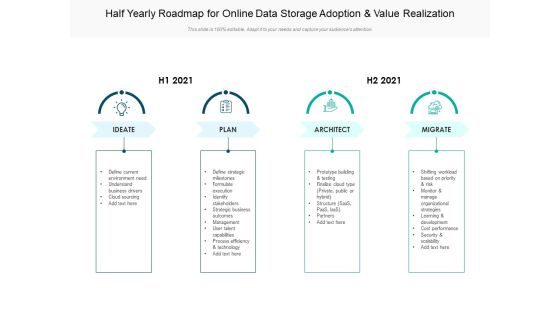
Half Yearly Roadmap For Online Data Storage Adoption And Value Realization Diagrams
Presenting our innovatively-structured half yearly roadmap for online data storage adoption and value realization diagrams Template. Showcase your roadmap process in different formats like PDF, PNG, and JPG by clicking the download button below. This PPT design is available in both Standard Screen and Widescreen aspect ratios. It can also be easily personalized and presented with modified font size, font type, color, and shapes to measure your progress in a clear way.

Five Year Effective Data Governance Execution Roadmap With Organizations Progress Diagrams
Presenting our innovatively structured five year effective data governance execution roadmap with organizations progress diagrams Template. Showcase your roadmap process in different formats like PDF, PNG, and JPG by clicking the download button below. This PPT design is available in both Standard Screen and Widescreen aspect ratios. It can also be easily personalized and presented with modified font size, font type, color, and shapes to measure your progress in a clear way.
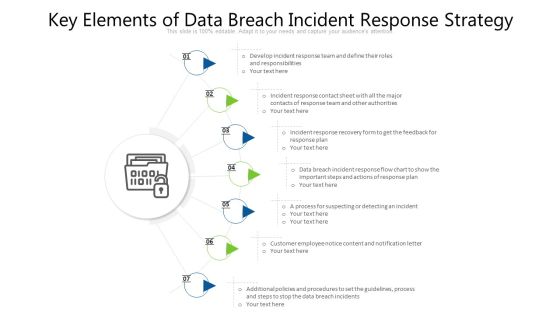
Key Elements Of Data Breach Incident Response Strategy Ppt PowerPoint Presentation File Diagrams PDF
Persuade your audience using this key elements of data breach incident response strategy ppt powerpoint presentation file diagrams pdf. This PPT design covers seven stages, thus making it a great tool to use. It also caters to a variety of topics including plan, roles and responsibilities, develop. Download this PPT design now to present a convincing pitch that not only emphasizes the topic but also showcases your presentation skills.

Redis Cache Data Structure IT Secure Server Configuration With Server Configuration Lock Diagrams PDF
This slide describes the secure server configuration with server configuration lock, which guarantees only users have access. Presenting redis cache data structure it secure server configuration with server configuration lock diagrams pdf to provide visual cues and insights. Share and navigate important information on five stages that need your due attention. This template can be used to pitch topics like securing, programmer, network. In addtion, this PPT design contains high resolution images, graphics, etc, that are easily editable and available for immediate download.
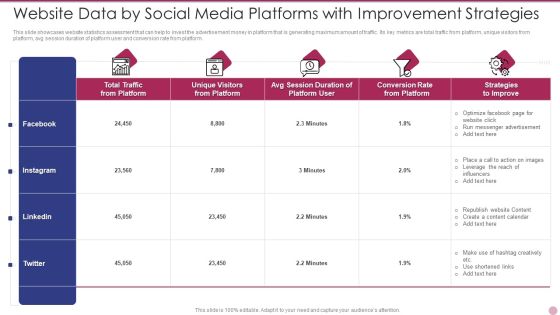
Website Data By Social Media Platforms With Improvement Strategies Diagrams PDF
This slide showcases website statistics assessment that can help to invest the advertisement money in platform that is generating maximum amount of traffic. Its key metrics are total traffic from platform, unique visitors from platform, avg session duration of platform user and conversion rate from platform. Showcasing this set of slides titled Website Data By Social Media Platforms With Improvement Strategies Diagrams PDF. The topics addressed in these templates are Strategies To Improve, Advertisement, Optimize. All the content presented in this PPT design is completely editable. Download it and make adjustments in color, background, font etc. as per your unique business setting.

Data Center Infrastructure Technologies Comparison Between CPU And GPU Diagrams PDF
This slide depicts a comparison between CPU and GPU processing based on the number of cores, latency, processing, and hardware. If your project calls for a presentation, then Slidegeeks is your go-to partner because we have professionally designed, easy-to-edit templates that are perfect for any presentation. After downloading, you can easily edit Data Center Infrastructure Technologies Comparison Between CPU And GPU Diagrams PDF and make the changes accordingly. You can rearrange slides or fill them with different images. Check out all the handy templates.

 Home
Home