Data Architecture Diagram
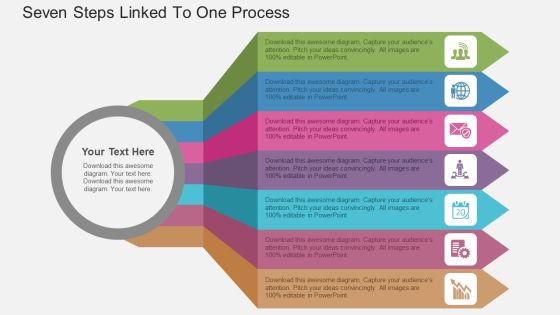
Seven Steps Linked To One Process Powerpoint Templates
This power point template has been designed with graphics of seven linked steps. Use this diagram to display workflow and task management. Download this diagram to display information in visual manner.

Circle For Strategic Marketing Plan Outline Powerpoint Template
This PowerPoint template has been designed with circular wheels diagram. This diagram provides schematic representation of any information. Visual effect this slide helps in maintaining the flow of the discussion and provides more clarity to the subject.

Three Sections In Semi Circle Powerpoint Template
Our above business slide has been designed with graphic of semicircle. This diagram provides schematic representation of any information. Use this business diagram to present your work in a more smart and precise manner.
Coalescer Section Powerpoint Slides Design
This is a coalescer section powerpoint slides design. This is a six stage process. The stages in this process are data flow diagram, compressed air, coalescer section, fresh caustic prewash, jet fuel feed, spent caustic drain.
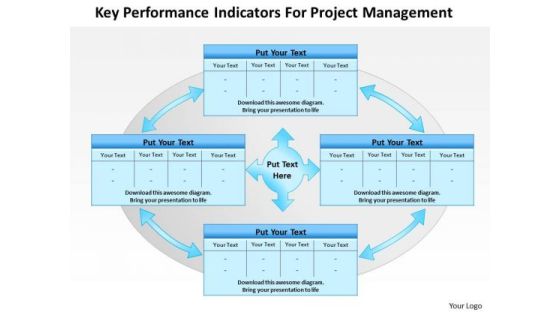
Business Framework Key Performance Indicators For Project Management PowerPoint Presentation
Our above diagram provides framework of key performance indicators for project management. It contains four interconnected text boxes. Download this diagram to make professional presentations on project management. This diagram enables the users to create their own display of the required processes in an easy way.

Ppt Colorful Circular Arrows PowerPoint 2007 Showing Seven Aspects Templates
PPT colorful circular arrows powerpoint 2007 showing seven aspects Templates-Arrow timeline PowerPoint diagram is a free PPT diagram with a timeline design diagram that you can download for PowerPoint presentations. This arrow diagram contains a year timeline ready to be used for business projects or education timeline for PowerPoint.-PPT colorful circular arrows powerpoint 2007 showing seven aspects Templates-analysis, arrow, background, business, chart, communication, concept, construction, delivery, design, development, engineering, fabrication, feasibiliti, generated, growth, idea, industry, making, production, products, science, sequence, shape

Business Framework Tcs Influence Of Technology PowerPoint Presentation
This diagram displays framework of tcs influence of technology. It contains four steps diagram depicting digital touch points and VOC, pricing and margin analytics, collaboration with customers and business partners, intelligent services. This diagram is innovatively designed to highlight your worthy views.

Battery Icons For Business Growth Levels Powerpoint Template
Levels of business growth can be displayed with this diagram. This PowerPoint template contains graphics of seven battery icons. You can use this design for data analysis in business presentations
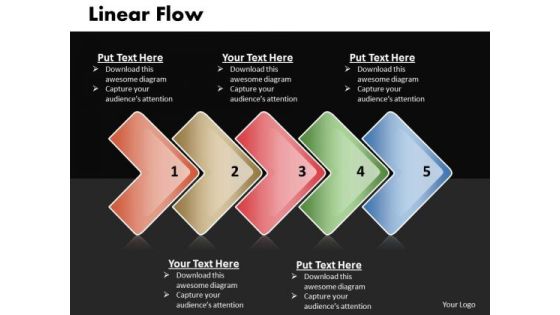
Ppt Linear Work Flow Chart PowerPoint 5 Stages Templates
PPT linear work flow chart powerpoint 5 stages Templates-Use this successive PowerPoint diagram to represent a series of interconnected ideas.-PPT linear work flow chart powerpoint 5 stages Templates-Abstract, Arrow, Arrow Chart, Business, Design, Development, Diagram, Direction, Element, Flow, Flow Chart, Flow Diagram, Flowchart, Graph, Linear, Management, Model, Motion, Organization, Plan, Process, Process Arrows, Process Chart, Process Diagram, Process Flow, Program, Section, Segment, Set, Sign, Solution, Strategy, Symbol, Technology

Business Framework Bar Chart In PowerPoint Presentation
This power point diagram slide has been designed with graphic of bar chart. In this diagram slide we have used green and blue colored vertical bar graph. Display result analysis with this bar graph diagram and use it in your result verification and analysis related presentations.
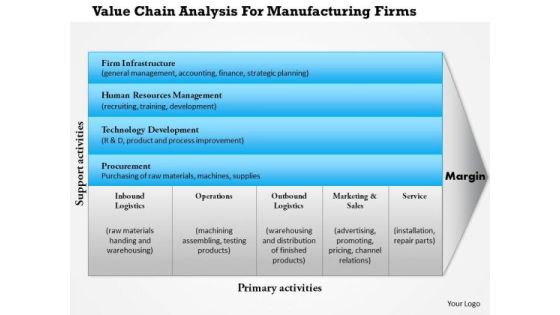
Business Framework Value Chain Manufacturing PowerPoint Presentation
This diagram displays business framework for value chain analysis for manufacturing firms. It contains diagram depicting activities of manufacturing firms like Inbound Logistics, Operations, Outbound Logistics, Marketing & Sales, and Service. Use this professional and customized business diagram in your presentations.
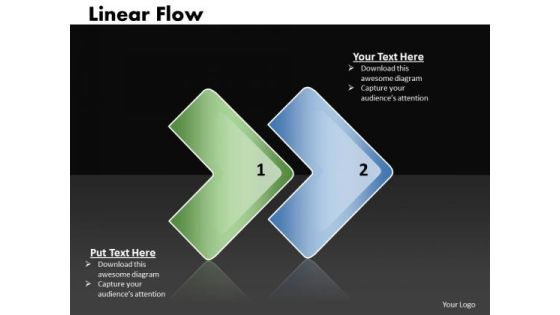
Ppt Linear Flow 2 Stages PowerPoint Templates
PPT linear flow 2 stages PowerPoint Templates-Use this diagram to show either related or contrasting concepts with some connection.-PPT linear flow 2 stages PowerPoint Templates-Abstract, Arrow, Arrow Chart, Business, Design, Development, Diagram, Direction, Element, Flow, Flow Chart, Flow Diagram, Flowchart, Graph, Linear, Management, Model, Motion, Organization, Plan, Process, Process Arrows, Process Chart, Process Diagram, Process Flow, Program, Section, Segment, Set, Sign, Solution, Strategy, Symbol, Technology

Business Framework Service Concept PowerPoint Presentation
This business framework power point template has been crafted with concept of service. To show this concept we have used graphic of blue colored petal diagram. This diagram contains the three petals inside to show different text related with service concept. This diagram is also called as service logic model. Define customer logic value and organizational culture related topics with this exclusive PPT.
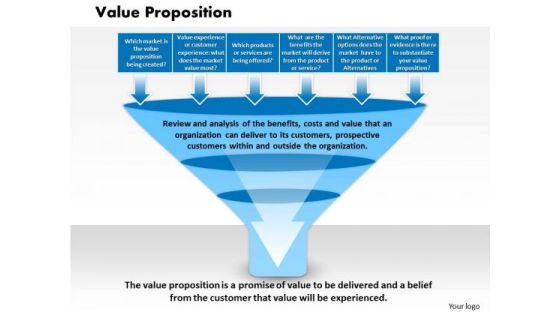
Business Framework Value Proposition PowerPoint Presentation
This diagram provides business framework for value proposition. It contains graphics of funnel diagram. Use this diagram to review and analysis of the benefits, costs and value that an organization can deliver to its customers, prospective customers within and outside the organization.
Five Wings Around Circle With Icons Powerpoint Templates
This business slide contains diagram of smart phone with apps icons. This diagram is suitable to present concept of mobile communication. Download this diagram for schematic representation of any information. Visual effect of this slide helps in maintaining the flow of the discussion and provides more clarity to the subject.
Six Staged Business Process Circle Chart Icons Powerpoint Template
Our above business diagram has been designed with circle process infographic chart. You may download this diagram to display workflow and task management. This diagram provides an effective way of displaying information you can edit text, color, shade and style as per you need.
Consulting Slides Innovative Idea Bulb With Icons Business Presentation
This diagram has been designed with graphic of idea bulb with icons. This diagram may use to depict creativity and ideas. You can change color, size and orientation of any icon to your liking. This diagram is best to present your newer thoughts.

Circular Business Strategic Model Powerpoint Template
Our above PPT slide contains circular web diagram with men icon in center holding megaphone. This business diagram helps to exhibit business strategic model design. Use this diagram to impart more clarity to subject and to create more sound impact on viewers.
Four Tags With Social Media Icons Powerpoint Template
Our above business diagram has been designed with four tags and social media icons. You may download this diagram to display marketing social media strategy. This diagram provides an effective way of displaying information you can edit text, color, shade and style as per you need.

Circle Of Five Steps For Marketing Strategy Powerpoint Template
Our above diagram has been designed with circle diagram of five steps. This PowerPoint template may be used to exhibit marketing strategy steps. This diagram provides an effective way of displaying information you can edit text, color, shade and style as per you need.

Achieving Proactive From Reactive How To Build An IT Culture In Organization Graphics PDF
This slide represents how to develop an IT culture in the organization, and it includes factors such as Democratizing Data Science, Eliminate the bottlenecks of culture of experimentation and so on. This is a Achieving Proactive From Reactive How To Build An IT Culture In Organization Graphics PDF template with various stages. Focus and dispense information on four stages using this creative set, that comes with editable features. It contains large content boxes to add your information on topics like Leveraging Curated Data, Feature Stores, Democratizing Data Science, Culture Experimentation. You can also showcase facts, figures, and other relevant content using this PPT layout. Grab it now.
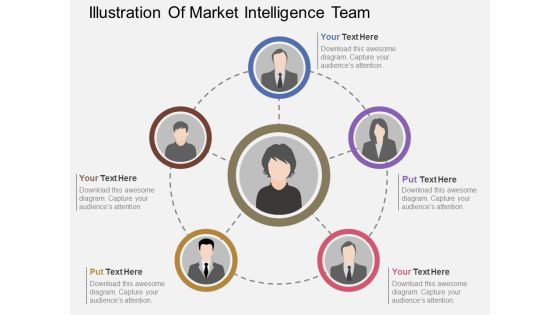
Illustration Of Market Intelligence Team Powerpoint Template
Our above business diagram has been designed with circular graphics with team icons. You may download this diagram to display working of marketing intelligence team. This diagram provides an effective way of displaying information you can edit text, color, shade and style as per you need.

Hexagons For Risk Management Techniques PowerPoint Template
Our above business diagram has been designed with graphics of hexagons. You may download this diagram to display risk management techniques. This diagram provides an effective way of displaying information you can edit text, color, shade and style as per you need.

Checklist Of Approved Projects Powerpoint Template
This PowerPoint template has been designed with diagram of checklist. You can use this diagram to display list of tasks. This diagram provides an effective way of displaying information you can edit text, color, shade and style as per you need.
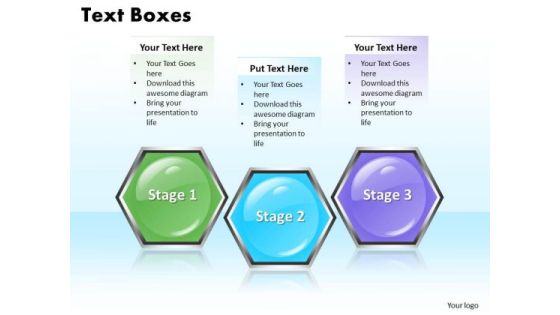
Ppt Colorful Hexagonal Text Align Boxes PowerPoint 2010 3 Process Templates
PPT colorful hexagonal text align boxes powerpoint 2010 3 process Templates-This Diagram makes information accessible throughout the organization with a collective, visible view of critical data from different perspectives and providing the tools to upcoming business scenarios and plan for change. This image has been professionally designed to emphasize the concept of sequential process using hexagonal boxes. It consists of three colorful hexagonal text boxes. -PPT colorful hexagonal text align boxes powerpoint 2010 3 process Templates-3d, Abstract, Art, Background, Clip, Clipart, Comb, Concept, Connected, Connection, Design, Different, Drawings, Graphics, Group, Hexagon, Honey, Honeycomb, Illustration, Pictures, Solution, Teamwork

Business Procedures Improvement Methodology Flow Chart For Project Management Ideas PDF
Following slide shows the flow diagram for the business process reengineering technique which assist in radical restructuring of business processes to achieve radically improved quality and output. It covers under various phases such as management decision, implementation, etc. Persuade your audience using this Business Procedures Improvement Methodology Flow Chart For Project Management Ideas PDF. This PPT design covers one stages, thus making it a great tool to use. It also caters to a variety of topics including Project Management, Collect Data Organizations, Redical Adjustments. Download this PPT design now to present a convincing pitch that not only emphasizes the topic but also showcases your presentation skills.

Concept Of Locked Money Finance PowerPoint Templates And PowerPoint Themes 1012
Concept Of Locked Money Finance PowerPoint Templates And PowerPoint Themes 1012-Develop competitive advantage with our above template which contains a diagram of 3d money and lock. This image signifies the concept of data security. This image has been conceived to enable you to emphatically communicate your ideas in your Business and Financial PPT presentations on finance, protection and banking. Our PPT images are so perfectly designed that it reveals the very basis of our PPT template to make your clients understand.-Concept Of Locked Money Finance PowerPoint Templates And PowerPoint Themes 1012-This PowerPoint template can be used for presentations relating to-Money and lock, security, success, money, finance, business

ERD For Pharmacy Management System Guidelines PDF
Following slide illustrates database relationship diagram for pharmacy management system by using various entities and attributes. The major entities are drug manufacturer, drug, pharmacy, patient, doctor which can be used to define the relationship between structured data groups. Showcasing this set of slides titled Contract, Pharmacy, Relationship. The topics addressed in these templates are Contract, Pharmacy, Relationship. All the content presented in this PPT design is completely editable. Download it and make adjustments in color, background, font etc. as per your unique business setting.

ERD For Banking System Pictures PDF
Following slide showcases banking system database relationship diagram using various entities, attributes and their relationship. Customer, credit card, account, loan and branch are some of the key entities which assist the banks in understanding the data structure and minimizing redundancy. Pitch your topic with ease and precision using this ERD For Banking System Pictures PDF. This layout presents information on Customer, Branch, Loan, Account. It is also available for immediate download and adjustment. So, changes can be made in the color, design, graphics or any other component to create a unique layout.
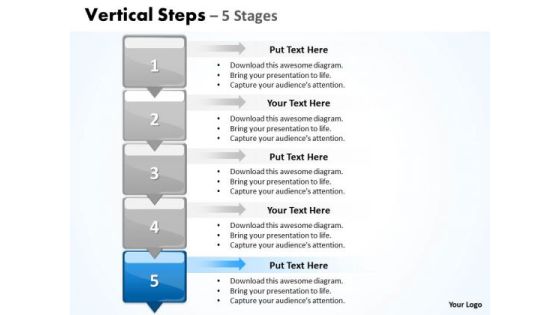
Usa Ppt Background Vertical PowerPoint Slide Numbers 5 Business Plan 6 Image
USA PPT Background vertical powerpoint slide numbers 5 business plan 6 Image-You can use this diagram to create an overview of the system or a structured design of data processing. Drive home your reasons and chart the path ahead to arrive at tour destination and achieve the goal.-USA PPT Background vertical powerpoint slide numbers 5 business plan 6 Image-Advertising, Arrow, Background, Blue, Bookmark, Card, Choice, Concept, Corporate, Creative, Design, Flow, Graphic, Illustration, Instruction, Label, Layout, Manual, Modern, Number, Options, Order, Page, Paper, Product, Progress, Progress, Concept, Progress, Report, Promotion, Sequence, Special, Step, Symbol

Ppt Linear Demonstration Of Process Using PowerPoint Graphics Arrows Templates
PPT linear demonstration of process using powerpoint graphics arrows Templates-This Diagram makes information accessible throughout the organization with a collective, visible view of critical data from different perspectives and providing the tools to upcoming business scenarios and plan for change. This image has been professionally designed to emphasize the concept of sequential process using curved arrows. It represents the Fifth arrow using purple color.-PPT linear demonstration of process using powerpoint graphics arrows Templates-Aim, Arrow, Arrowheads, Badge, Border, Click, Connection, Curve, Design, Direction, Download, Element, Fuchsia, Icon, Illustration, Indicator, Internet, Magenta, Mark, Object, Orientation, Pointer, Shadow, Shape, Sign
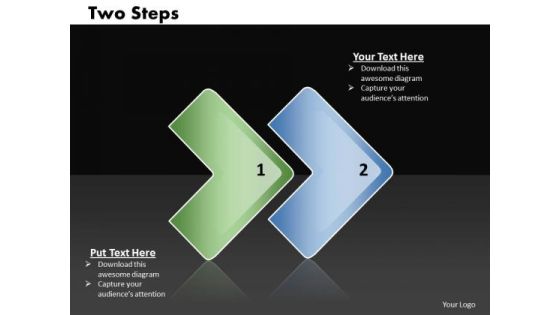
Ppt Linear Way To Represent 2 Practice The PowerPoint Macro Steps Templates
PPT linear way to represent 2 practice the powerpoint macro steps Templates-This Diagram makes information accessible throughout the organization with a collective, visible view of critical data from different perspectives and providing the tools to upcoming business scenarios and plan for change. This image has been professionally designed to emphasize the concept of sequential process using vertical arrows.-PPT linear way to represent 2 practice the powerpoint macro steps Templates-Aim, Arrow, Arrowheads, Badge, Border, Click, Connection, Curve, Design, Direction, Download, Element, Fuchsia, Icon, Illustration, Indicator, Internet, Magenta, Mark, Object, Orientation, Pointer, Shadow, Shape, Sign

Ppt Linear Demonstration Of Process Business PowerPoint Templates
PPT linear demonstration of process Business PowerPoint Templates-This Diagram makes information accessible throughout the organization with a collective, visible view of critical data from different perspectives and providing the tools to upcoming business scenarios and plan for change. This image has been professionally designed to emphasize the concept of sequential process using vertical arrows.-PPT linear demonstration of process Business PowerPoint Templates-Aim, Arrow, Arrowheads, Badge, Border, Click, Connection, Curve, Design, Direction, Download, Element, Fuchsia, Icon, Illustration, Indicator, Internet, Magenta, Mark, Object, Orientation, Pointer, Shadow, Shape, Sign

DSS Software Framework For Mis Ppt PowerPoint Presentation File Pictures PDF
This slide outlines the decision support system framework for MIS Management Information System which includes steps such as data collection, data analysis techniques and presentation of data. It also provide information about different types of decisions such as personnel, accounting, production etc. Presenting DSS Software Framework For Mis Ppt PowerPoint Presentation File Pictures PDF to dispense important information. This template comprises six stages. It also presents valuable insights into the topics including Personnel, Accounting, Production, Marketing, Distribution. This is a completely customizable PowerPoint theme that can be put to use immediately. So, download it and address the topic impactfully.
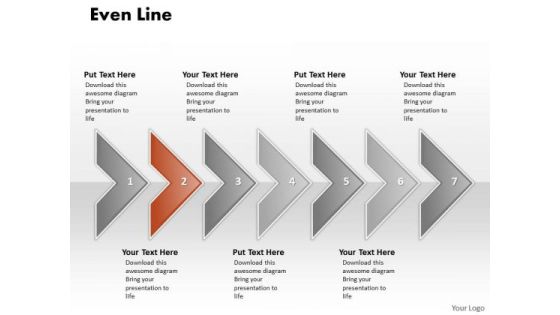
Ppt Correlated Arrows PowerPoint Templates Even Line 7 Stages
PPT correlated arrows powerpoint templates even line 7 stages-This Diagram is used to illustrate how information will move between interrelated systems in the accomplishment of a given function, task or process. The visual description of this information flow with each given level showing how data is fed into a given process step and subsequently passed along at the completion of that step.-PPT correlated arrows powerpoint templates even line 7 stages-Aim, Arrow, Badge, Border, Color, Connection, Curve, Design, Direction, Download, Icon, Illustration, Indicator, Internet, Label, Link, Magenta, Mark, Next, Object, Orientation, Paper, Peeling, Pointer, Rounded, Set, Shadow, Shape, Sign
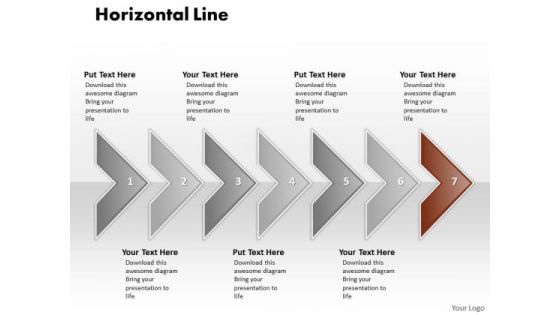
Ppt Correlated Circular Arrows PowerPoint 2010 Horizontal Line 7 Stages Templates
PPT correlated circular arrows powerpoint 2010 horizontal line 7 stages Templates-This Diagram is used to illustrate how information will move between interrelated systems in the accomplishment of a given function, task or process. The visual description of this information flow with each given level showing how data is fed into a given process step and subsequently passed along at the completion of that step.-PPT correlated circular arrows powerpoint 2010 horizontal line 7 stages Templates-Aim, Arrow, Badge, Border, Color, Connection, Curve, Design, Direction, Download, Icon, Illustration, Indicator, Internet, Label, Link, Magenta, Mark, Next, Object, Orientation, Paper, Peeling, Pointer, Rounded, Set, Shadow, Shape, Sign

Ppt Correlated Curved Arrows PowerPoint 2010 Regular Line 7 Stages Templates
PPT correlated curved arrows powerpoint 2010 regular line 7 stages Templates-This Diagram is used to illustrate how information will move between interrelated systems in the accomplishment of a given function, task or process. The visual description of this information flow with each given level showing how data is fed into a given process step and subsequently passed along at the completion of that step.-PPT correlated curved arrows powerpoint 2010 regular line 7 stages Templates-Aim, Arrow, Badge, Border, Color, Connection, Curve, Design, Direction, Download, Icon, Illustration, Indicator, Internet, Label, Link, Magenta, Mark, Next, Object, Orientation, Paper, Peeling, Pointer, Rounded, Set, Shadow, Shape, Sign
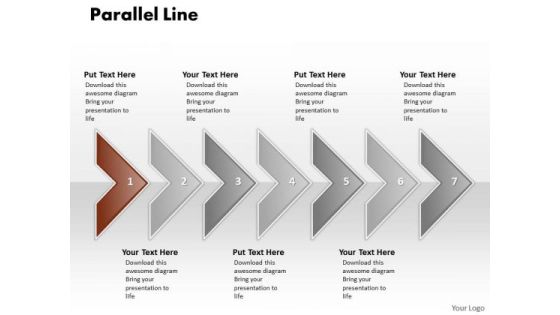
Ppt Correlated PowerPoint Graphics Arrows Parallel Line 7 Stage Templates
PPT correlated powerpoint graphics arrows parallel line 7 stage Templates-This Diagram is used to illustrate how information will move between interrelated systems in the accomplishment of a given function, task or process. The visual description of this information flow with each given level showing how data is fed into a given process step and subsequently passed along at the completion of that step.-PPT correlated powerpoint graphics arrows parallel line 7 stage Templates-Aim, Arrow, Badge, Border, Color, Connection, Curve, Design, Direction, Download, Icon, Illustration, Indicator, Internet, Label, Link, Magenta, Mark, Next, Object, Orientation, Paper, Peeling, Pointer, Rounded, Set, Shadow, Shape, Sign

Ppt Correlated Shapes Arrows PowerPoint Horizontal Stages Templates
PPT correlated shapes arrows powerpoint horizontal stages Templates-This Diagram is used to illustrate how information will move between interrelated systems in the accomplishment of a given function, task or process. The visual description of this information flow with each given level showing how data is fed into a given process step and subsequently passed along at the completion of that step.-PPT correlated shapes arrows powerpoint horizontal stages Templates-Aim, Arrow, Badge, Border, Color, Connection, Curve, Design, Direction, Download, Icon, Illustration, Indicator, Internet, Label, Link, Magenta, Mark, Next, Object, Orientation, Paper, Peeling, Pointer, Rounded, Set, Shadow, Shape, Sign
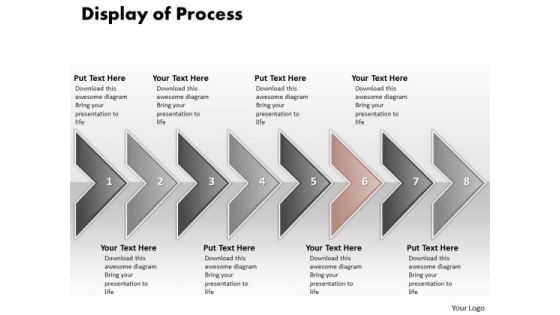
Ppt Display Of Marketing Process Using 8 Power Point Stage PowerPoint Templates
PPT display of marketing process using 8 power point stage PowerPoint Templates-This Diagram is used to illustrate how information will move between interrelated systems in the accomplishment of a given function, task or process. The visual description of this information flow with each given level showing how data is fed into a given process step and subsequently passed along at the completion of that step.-PPT display of marketing process using 8 power point stage PowerPoint Templates-Aim, Arrow, Badge, Border, Color, Connection, Curve, Design, Direction, Download, Icon, Illustration, Indicator, Internet, Label, Link, Magenta, Mark, Next, Object, Orientation, Paper, Peeling, Pointer, Rounded, Set, Shadow, Shape, Sign
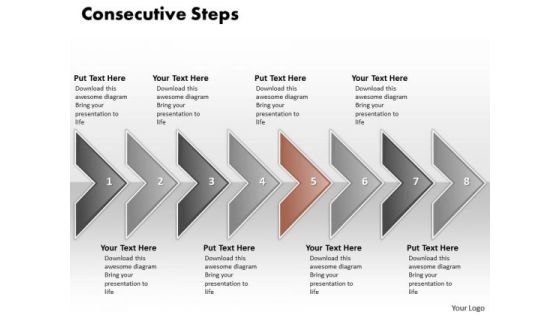
Ppt Eight Consecutive Practice The PowerPoint Macro Steps Of Marketing Process Templates
PPT eight consecutive practice the powerpoint macro steps of marketing process Templates-This Diagram is used to illustrate how information will move between interrelated systems in the accomplishment of a given function, task or process. The visual description of this information flow with each given level showing how data is fed into a given process step and subsequently passed along at the completion of that step.-PPT eight consecutive practice the powerpoint macro steps of marketing process Templates-Aim, Arrow, Badge, Border, Color, Connection, Curve, Design, Direction, Download, Icon, Illustration, Indicator, Internet, Label, Link, Magenta, Mark, Next, Object, Orientation, Paper, Peeling, Pointer, Rounded, Set, Shadow, Shape, Sign

Four Phases Workstreams For Managing Marketing Projects Guidelines PDF
This slide covers four workstreams for managing marketing projects. It involves workstreams such as infrastructure, business intelligence, data management and customer data integration. Persuade your audience using this Four Phases Workstreams For Managing Marketing Projects Guidelines PDF. This PPT design covers four stages, thus making it a great tool to use. It also caters to a variety of topics including Infrastructure Workstream, Business Intelligence, Data Management. Download this PPT design now to present a convincing pitch that not only emphasizes the topic but also showcases your presentation skills.

Corporate Analysis Framework To Enhance Decision Making Process Guidelines PDF
This slide covers organizational diagnosis framework to enhance decision making process in organization. It involves data gathering, interpretation, initial phase diagnosis, testing preliminary diagnosis and final diagnosis. Showcasing this set of slides titled Corporate Analysis Framework To Enhance Decision Making Process Guidelines PDF. The topics addressed in these templates are Data Interpretation, Data Gathering, Knowledge Of Systems. All the content presented in this PPT design is completely editable. Download it and make adjustments in color, background, font etc. as per your unique business setting.

Remote Management Framework Of IOT Devices Rules PDF
The following slide exhibits the working structure of IoT device data management and transmission at various stages that helps to understand the working of multiple stages. The different phases are information storage, data transfer, error detection, notification, etc. Showcasing this set of slides titled Remote Management Framework Of IOT Devices Rules PDF. The topics addressed in these templates are Monitoring, Data Visualization, Aws Lot Analytics. All the content presented in this PPT design is completely editable. Download it and make adjustments in color, background, font etc. as per your unique business setting.

Research Plan Of Product Quality Analysis Ppt PowerPoint Presentation Inspiration Clipart Images PDF
Persuade your audience using this research plan of product quality analysis ppt powerpoint presentation inspiration clipart images pdf. This PPT design covers nine stages, thus making it a great tool to use. It also caters to a variety of topics including research objective, choose data collection method, choose sampling frame, select sample, create questionnaire, design and implement data collection process, code and edit data, make adjustments if required, perform analysis. Download this PPT design now to present a convincing pitch that not only emphasizes the topic but also showcases your presentation skills.

Legal Requisites For Small Business Website Icon Clipart PDF
This slide mentions the legal requisites to keep in consideration while building website for small businesses. It includes ADA Compliance, Data Privacy and Collection, Copyright Requirements, Data Security Measures and Transaction Compliance. Presenting Legal Requisites For Small Business Website Icon Clipart PDF to dispense important information. This template comprises five stages. It also presents valuable insights into the topics including Copyright Requirements, Data Security Measures, Transaction Compliance. This is a completely customizable PowerPoint theme that can be put to use immediately. So, download it and address the topic impactfully.
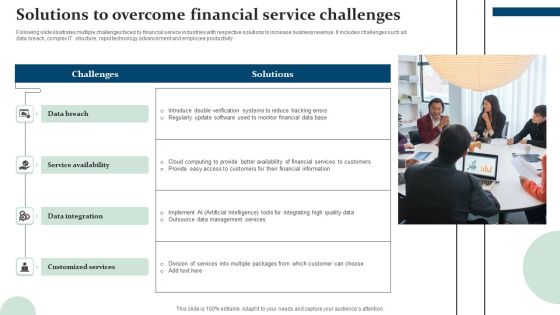
Solutions To Overcome Financial Service Challenges Themes PDF
Following slide illustrates multiple challenges faced by financial service industries with respective solutions to increase business revenue. It includes challenges such ad data breach, complex IT structure, rapid technology advancement and employee productivity. Persuade your audience using this Solutions To Overcome Financial Service Challenges Themes PDF. This PPT design covers four stages, thus making it a great tool to use. It also caters to a variety of topics including Data Breach, Service Availability, Data Integration, Customized Services. Download this PPT design now to present a convincing pitch that not only emphasizes the topic but also showcases your presentation skills.

Development Procedure To Summarize Expense Information Ppt Layouts Sample PDF
The following slide showcases budget development process to summarize data. The steps include revenue transferred, budget analysis, data compilation and budget presented for approval. Persuade your audience using this Development Procedure To Summarize Expense Information Ppt Layouts Sample PDF. This PPT design covers five stages, thus making it a great tool to use. It also caters to a variety of topics including Revenue Transfer, Budget Analysis, Data Compilation. Download this PPT design now to present a convincing pitch that not only emphasizes the topic but also showcases your presentation skills.

Cybersecurity Resilience Frameworks For Organization Protection Information PDF
The slide showcases the framework types of cybersecurity resilience to help organizations in securing and protecting data from cyberattacks. It covers national institute of standards and technology framework, center for internet security critical security controls, so 27001 and iso 27002 international organization for standardization and payment card industry data security standard. Presenting Cybersecurity Resilience Frameworks For Organization Protection Information PDF to dispense important information. This template comprises four stages. It also presents valuable insights into the topics including Data Security, Organization For Standardization, Security Controls. This is a completely customizable PowerPoint theme that can be put to use immediately. So, download it and address the topic impactfully.

Cloud Intelligence Framework For Application Consumption Determining The Suitable Software For Organization Icons PDF
The slide provides the key features comparison of various software that will help the company to achieve its objective of process automation and data security. Deliver and pitch your topic in the best possible manner with this cloud intelligence framework for application consumption determining the suitable software for organization icons pdf. Use them to share invaluable insights on process automation, data security, improve productivity, process automation and data security and impress your audience. This template can be altered and modified as per your expectations. So, grab it now.

Statistics Indicating Future Demand For Digital Insurance Technologies Brochure PDF
This slide illustrates data indicating future demand for insurtech digital technology. It provides information about data analytics, cloud technology, internal blockchain application, artificial intelligence, etc. Pitch your topic with ease and precision using this Statistics Indicating Future Demand For Digital Insurance Technologies Brochure PDF. This layout presents information on Data Analytics, Cloud Technology, Internal Blockchain Application. It is also available for immediate download and adjustment. So, changes can be made in the color, design, graphics or any other component to create a unique layout.
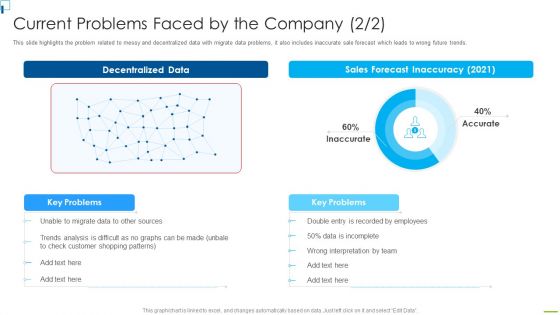
Designing And Deployment Current Problems Faced By The Company Portrait PDF
This slide highlights the problem related to messy and decentralized data with migrate data problems, it also includes inaccurate sale forecast which leads to wrong future trends. Deliver and pitch your topic in the best possible manner with this designing and deployment current problems faced by the company portrait pdf. Use them to share invaluable insights on decentralized data, sales forecast inaccuracy 2021, employees, trends analysis and impress your audience. This template can be altered and modified as per your expectations. So, grab it now.

Growth Reporting Workflow Process Steps Guidelines PDF
This slide shows report development process for collecting, classifying and analyzing data into report. It include steps such as creating report design, designing data collection method and development phase etc. Presenting Growth Reporting Workflow Process Steps Guidelines PDF to dispense important information. This template comprises four stages. It also presents valuable insights into the topics including Design Data Collection, Development Phase, Production Phase. This is a completely customizable PowerPoint theme that can be put to use immediately. So, download it and address the topic impactfully.

Computer Simulation Human Thinking Determine Trends In Cognitive Computing Space Inspiration PDF
This slide provides information regarding various trends existing in cognitive computing space in terms of contextual analytics and sensor generated data. Presenting Computer Simulation Human Thinking Determine Trends In Cognitive Computing Space Inspiration PDF to provide visual cues and insights. Share and navigate important information on five stages that need your due attention. This template can be used to pitch topics like Contextual Analytics, Contextual Data Comprise, Sensor Generated Data. In addtion, this PPT design contains high resolution images, graphics, etc, that are easily editable and available for immediate download.
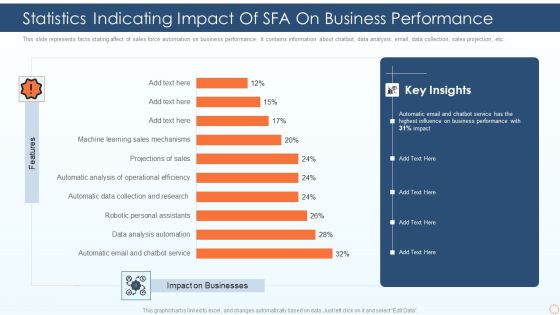
Statistics Indicating Impact Of SFA On Business Performance Ppt PowerPoint Presentation Gallery Outfit PDF
This slide represents facts stating affect of sales force automation on business performance. It contains information about chatbot, data analysis, email, data collection, sales projection, etc. Pitch your topic with ease and precision using this statistics indicating impact of sfa on business performance ppt powerpoint presentation gallery outfit pdf. This layout presents information on automatic email and chatbot service, data analysis automation, robotic personal assistants. It is also available for immediate download and adjustment. So, changes can be made in the color, design, graphics or any other component to create a unique layout.

Strategies To Improve B2b Consumer Response Surveys Themes PDF
This slide covers strategies to enhance B2B customers experience and feedback through surveys. It includes setting clear survey objectives, develop quality questions, get authentic customer data, use of data analytic tools and utilize all feedback survey methods. Persuade your audience using this Strategies To Improve B2b Consumer Response Surveys Themes PDF. This PPT design covers five stages, thus making it a great tool to use. It also caters to a variety of topics including Use Data Analytic Tools, Develop Quality Questions, Clear Survey Objectives. Download this PPT design now to present a convincing pitch that not only emphasizes the topic but also showcases your presentation skills.

Challenges For Conducting Market Research Process Steps Designs PDF
The slide highlights the barriers to conducting an effective market research process for companies. These challenges reflect how they restrict the way researchers collect data and contribute to decision-making. Presenting Challenges For Conducting Market Research Process Steps Designs PDF to dispense important information. This template comprises five stages. It also presents valuable insights into the topics including Automation, Data Curation, Consumer Data Protection. This is a completely customizable PowerPoint theme that can be put to use immediately. So, download it and address the topic impactfully.

Apache Hadoop Software Deployment Impacts Of Hadoop On Business Themes PDF
This slide represents the impacts of Hadoop on the business, including data-driven decisions, better data access, and data offloads.Presenting Apache Hadoop Software Deployment Impacts Of Hadoop On Business Themes PDF to provide visual cues and insights. Share and navigate important information on three stages that need your due attention. This template can be used to pitch topics like Relational Database, Accurate Judgments, Accessibility Expenses. In addtion, this PPT design contains high resolution images, graphics, etc, that are easily editable and available for immediate download.

Barriers To Investigate Forensic Crimes And Frauds Graphics PDF
This slide covers different obstacles in detection and investigation of financial frauds. It includes barriers such as data integrity issues, data gathering and manipulation, lack of database integration, complex financial closes, lack of accurate reporting and analysis, reconciliation issues, etc. Presenting Barriers To Investigate Forensic Crimes And Frauds Graphics PDF to dispense important information. This template comprises three stages. It also presents valuable insights into the topics including Disconnected Data, Reactive Processes, Difficult Applications. This is a completely customizable PowerPoint theme that can be put to use immediately. So, download it and address the topic impactfully.

Barriers In Implementation Of Manpower Analytics For Human Capital System Ideas PDF
This slide depicts issues faced in effective implementation of workforce analytics in different areas. It includes inconsistency in human capital metrics, data not captured consistently, lack of HCM-non HCM systems, etc. Showcasing this set of slides titled Barriers In Implementation Of Manpower Analytics For Human Capital System Ideas PDF. The topics addressed in these templates are Data Collection, Analysis Leads, Data Management. All the content presented in this PPT design is completely editable. Download it and make adjustments in color, background, font etc. as per your unique business setting.
 Home
Home