Data Architecture Diagram

Four Arrows Tags Infographics Powerpoint Template
The above PowerPoint slide displays four arrows design with icons. This PowerPoint diagram helps to summarize complex business data. Adjust the above diagram in your business presentations to visually support your content.
Four Banners With Business Icons Powerpoint Template
The above PowerPoint slide displays four banners with icons. This PowerPoint diagram helps to summarize complex business data. Adjust the above diagram in your business presentations to visually support your content.
Four Banners With Finance Growth Icons Powerpoint Template
The above PowerPoint slide displays four banners with finance growth icons. This PowerPoint diagram helps to summarize complex business data. Adjust the above diagram in your business presentations to visually support your content.
Four Colored Arrow Tags With Icons Powerpoint Template
The above PowerPoint slide displays four colored arrow tags with icons. This PowerPoint diagram helps to summarize complex business data. Adjust the above diagram in your business presentations to visually support your content.
Four Colorful Circle Tags With Icons Powerpoint Template
The above PowerPoint slide displays four colorful circle tags with icons. This PowerPoint diagram helps to summarize complex business data. Adjust the above diagram in your business presentations to visually support your content.
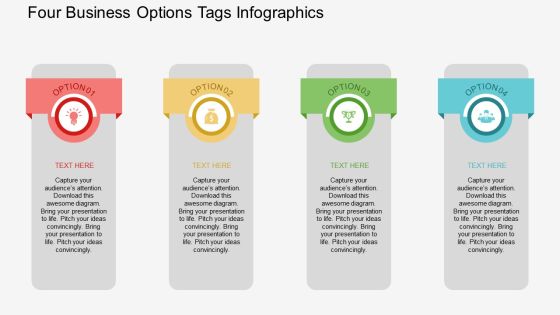
Four Business Options Tags Infographics Powerpoint Template
The above PowerPoint slide displays four options tags infographic. This PowerPoint diagram helps to summarize complex business data. Adjust the above diagram in your business presentations to visually support your content.

PowerPoint Design Gear Process Success Ppt Slide
PowerPoint Design Gear Process Success PPT Slide-If you need to create advanced, completely customizable diagrams for your data, Use this diagram with excellent graphics that help you convey your ideas successfully.-PowerPoint Design Gear Process Success PPT Slide

Business Framework Brand Equity Development PowerPoint Presentation
This power point diagram slide has been crafted with graphic of two axial flow chart. This chart refers to the concept of brand equity development. Display this concept in your presentations and get detailed information about brand architecture.
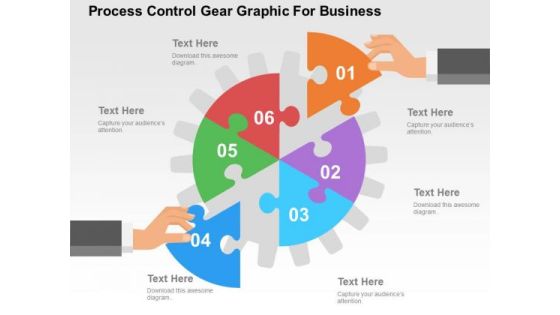
Process Control Gear Graphic For Business PowerPoint Template
Our professionally designed gear diagram is as an effective tool for communicating ideas. It contains graphics of gear with six segments. Convey your views with this diagram slide. It will amplify the strength of your logic.
Process Automation And Artificial Intelligence Framework Ppt PowerPoint Presentation Icon Deck PDF
Presenting process automation and artificial intelligence framework ppt powerpoint presentation icon deck pdf to dispense important information. This template comprises nine stages. It also presents valuable insights into the topics including data cleaning, training data, learning algorithm. This is a completely customizable PowerPoint theme that can be put to use immediately. So, download it and address the topic impactfully.

DSS Framework With Database Flow Chart Ppt PowerPoint Presentation Gallery Model PDF
Presenting this set of slides with name dss framework with database flow chart ppt powerpoint presentation gallery model pdf. This is a five stage process. The stages in this process are tps, user interface, user dss, data base, software system models, olap tool, external data. This is a completely editable PowerPoint presentation and is available for immediate download. Download now and impress your audience.
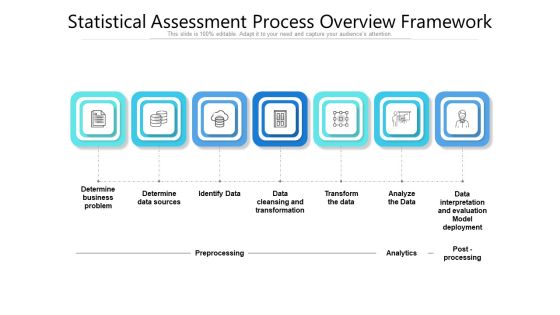
Statistical Assessment Process Overview Framework Ppt Layouts Graphics PDF
Presenting statistical assessment process overview framework ppt layouts graphics pdf to dispense important information. This template comprises seven stages. It also presents valuable insights into the topics including data sources, transform, business problem, data interpretation, analytics. This is a completely customizable PowerPoint theme that can be put to use immediately. So, download it and address the topic impactfully.
Functional Framework Of Operations Network Management Ppt PowerPoint Presentation Icon Model
Presenting this set of slides with name functional framework of operations network management ppt powerpoint presentation icon model. The topics discussed in these slides are service configuration, network interface, service workflow, report generator, data analyzer, performance data. This is a completely editable PowerPoint presentation and is available for immediate download. Download now and impress your audience.

3 Project Groups Comparative Assessment Chart For Performance Evaluation Background PDF
Showcasing this set of slides titled 3 project groups comparative assessment chart for performance evaluation background pdf. The topics addressed in these templates are data analysis, data recovery, android development. All the content presented in this PPT design is completely editable. Download it and make adjustments in color, background, font etc. as per your unique business setting.
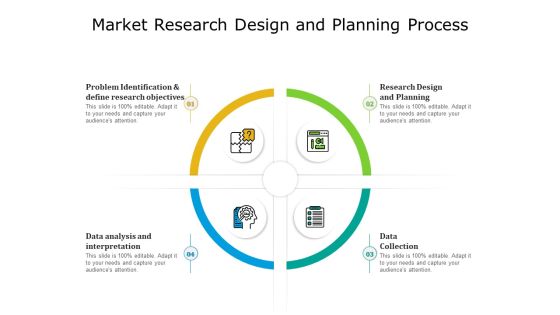
Market Research Design And Planning Process Ppt PowerPoint Presentation File Design Inspiration PDF
Presenting market research design and planning process ppt powerpoint presentation file design inspiration pdf to dispense important information. This template comprises four stages. It also presents valuable insights into the topics including planning, data analysis, data collection. This is a completely customizable PowerPoint theme that can be put to use immediately. So, download it and address the topic impactfully.
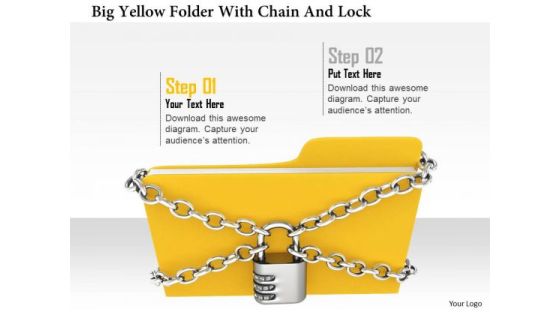
Stock Photo Big Yellow Folder With Chian And Lock PowerPoint Slide
A big yellow folder has been used to design this image slide. This yellow folder has been covered with chain and lock. This slide depicts the concept of data safety and security. Keep safe your data and display this massage in your presentation with this unique design

Create Timetable And Financial Forecast Bundle Project Milestone Summary Chart Slides PDF
Deliver and pitch your topic in the best possible manner with this create timetable and financial forecast bundle project milestone summary chart slides pdf. Use them to share invaluable insights on develop project module, build architecture, develop process to convert system data and impress your audience. This template can be altered and modified as per your expectations. So, grab it now.

Numeric Design Circle Text Boxes Powerpoint Template

Bar Graph For Yearly Statistical Analysis Powerpoint Slides
This PowerPoint template has been designed with bar graph. This PowerPoint diagram is useful to exhibit yearly statistical analysis. This diagram slide can be used to make impressive presentations.
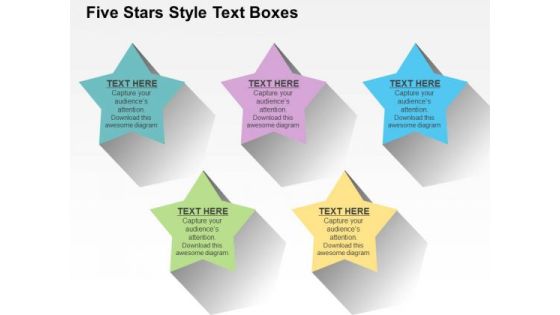
Five Stars Style Text Boxes PowerPoint Templates
This professional diagram slide has been designed with five colorful stars. You may use this diagram to present success steps. You can easily impart your information with help of this PowerPoint template.

Colorful Infographic For Text Representation Powerpoint Templates
Our above business diagram has been designed with colorful circular tags with icons. This slide is suitable for text representation in visual manner. Use this business diagram to present your work in a more smart and precise manner.

Infographic For Financial Statement Analysis PowerPoint Templates
This PowerPoint template contains infographic slide. This diagram has been designed with circular infographic to exhibit financial statement analysis. Use this diagram to set targets and to measure performance in your presentations.
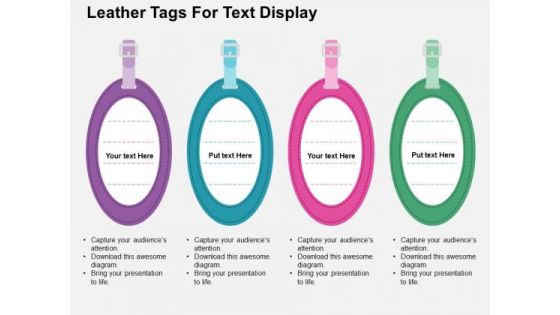
Leather Tags For Text Display PowerPoint Templates
Our professionally designed business diagram is as an effective tool to present text information. It contains graphics of leather tags. Convey your views with this diagram slide. It will amplify the strength of your logic.

Statistical Technique Tags For Market Research Powerpoint Template
Graphic of arrows in linear flow has been used to design this business diagram. This diagram slide may be used to depict statistical techniques and market research. Use this editable slide to build quality presentation for your viewers.
Year 2016 Text With Icons Powerpoint Template
This PowerPoint template contains year 2016 text with icons. This diagram has been designed to exhibit concept of future planning. Use this diagram to set targets and to measure performance in your presentations.
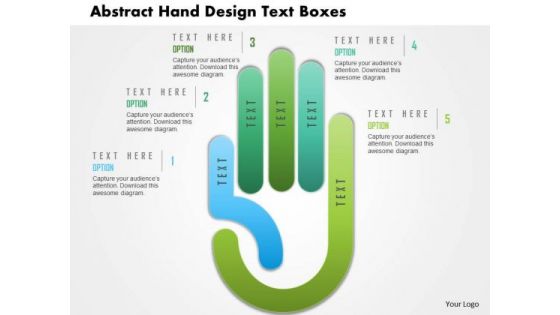
Business Daigram Abstract Hand Design Text Boxes Presentation Templets
This business slide contains graphics of hand diagram with five text boxes. This business diagram helps to depict five steps of any business process. Download this image to display information in visual manner.

Paint Brush Style Text Boxes Powerpoint Templates
Our above business diagram has been designed with graphics of paint brush style text boxes. This slide is suitable for text representation. Use this business diagram to present your work in a more smart and precise manner.
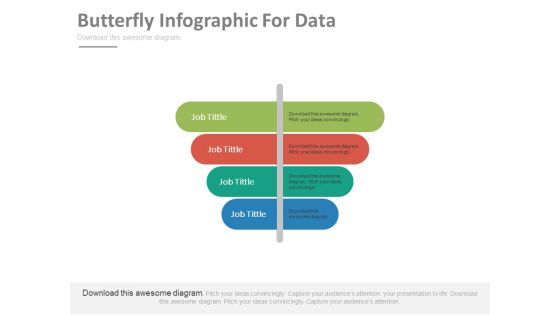
Four Butterfly Style Text Tags Powerpoint Template
This business slide contains butterfly style text tags. This diagram is suitable to present process steps. Visual effect of this diagram helps in maintaining the flow of the discussion and provides more clarity to the subject.
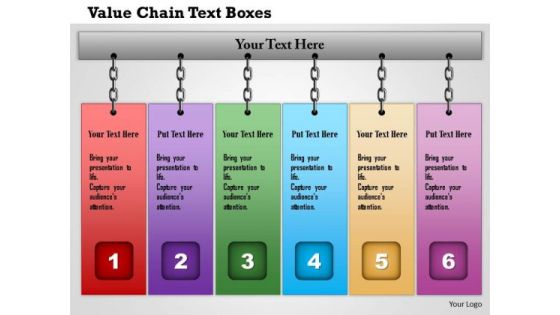
Business Framework Value Chain Text Boxes PowerPoint Presentation
This business diagram displays framework for value chain. This slide contains graphic of colorful tags in linear order. This editable diagram may be used for business and sales related presentations.

Three Options Text Arrow Boxes Powerpoint Templates
This business diagram displays graphic of arrows with icons. This power point template contains the concept of business analysis and research. Use this diagram to build unique presentation for your viewers.

Creative Gears Infographics For Planning Processes Powerpoint Template
Our above diagram provides gears layout to display corporate planning. This diagram provides an effective way of displaying information you can edit text, color, shade and style as per you need.
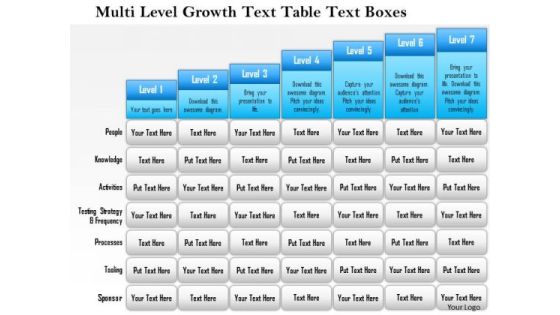
Business Framework Multi Level Growth Text Table Text Boxes 4 PowerPoint Presentation
Seven staged text box diagram has been used to decorate this Power Point template slide. This diagram slide contains the concept of multilevel growth. Use this template and build unique presentation for growth topic.

Modern Text Boxes For Information Display PowerPoint Templates
Our professionally designed business diagram is as an effective tool to present text information. It contains graphics of text boxes. Convey your views with this diagram slide. It will amplify the strength of your logic.
Globe With Bars And Business Icons Powerpoint Templates
Bar graph with globe for statistical analysis has been displayed in this business slide. This business diagram helps to exhibit global statistical analysis and research. Use this diagram to build an exclusive presentation.

Four Text Boxes For Swot Analysis Powerpoint Slides
This PPT slide has been designed with graphics of four steps text boxes diagram. This business diagram helps to exhibit SWOT analysis. Use this PowerPoint template to build an exclusive presentation.

Three Text Tags With Alphabets Powerpoint Templates
The above template displays a diagram of circular arrows with icons. This diagram has been professionally designed to display steps of financial planning. Capture the attention of your audience.
Four Text Banners With Business Icons Powerpoint Template
This PowerPoint template has been designed with four text banners and business icons. This business diagram helps to exhibit sample marketing plan. Use this diagram to build an exclusive presentation.

Mobile Style Text Boxes PowerPoint Templates
Our professionally designed business diagram is as an effective tool to present text information. It contains graphics of mobile style text boxes. Convey your views with this diagram slide. It will amplify the strength of your logic.
Six Text Circles With Icons PowerPoint Templates
This creative PPT slide has been designed with graphics of circles. This business diagram is suitable for text representation. Use this diagram in business presentations to give better impact.

Business Strategy Evaluation And Analytics Framework Ppt Ideas Images PDF
This slide represents the framework to ensure that product teams leverage disparate information, draw insights to learn from mistakes of past and determine effective product strategies for future. It includes details related to analytics, data governance, people, process etc. Presenting Business Strategy Evaluation And Analytics Framework Ppt Ideas Images PDF to dispense important information. This template comprises six stages. It also presents valuable insights into the topics including Analytics, Data Governance, Information Architecture, People. This is a completely customizable PowerPoint theme that can be put to use immediately. So, download it and address the topic impactfully.

Business Framework Technology Best Practices PowerPoint Presentation
This business diagram displays framework for technology best practices. This slide contains graphic of five hexagons. These hexagons are used to show the best practices for technology. Use this editable diagram for your business and technology related presentations.
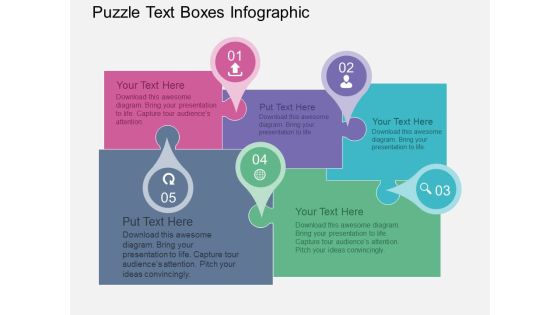
Puzzle Text Boxes Infographic Powerpoint Templates
Puzzle infographic has been used to design this power point template. This business diagram helps to depict concepts of marketing solution and strategy. Use this diagram to build unique presentation for your viewers.

Circle Of Four Text Boxes Powerpoint Templates
Our professionally designed circle diagram is as an effective tool for communicating ideas. It contains circle of four steps. Convey your views with this diagram slide. It will amplify the strength of your logic.

Business Framework Visual Information PowerPoint Presentation
This business power point template is designed with unique network diagram. This business diagram is useful to display visual information for any business process. Use this template for professional approach.
Year 2016 Numbers With Icons Powerpoint Template
This PowerPoint template contains year 2016 numbers with icons. This diagram has been designed to exhibit concept of future planning. Use this diagram to set targets and to measure performance in your presentations.

Construction Project Categorization And Dimensions Structure Graphics PDF
The slide highlights the categories and dimensions structure for construction projects management. Structure includes categories company structure, building material, project data, IT architecture, etc and dimensions project structure, project management, project data and project phase. Showcasing this set of slides titled Construction Project Categorization And Dimensions Structure Graphics PDF. The topics addressed in these templates are Project Management, Company Structure, Building Material. All the content presented in this PPT design is completely editable. Download it and make adjustments in color, background, font etc. as per your unique business setting.

Business Framework Experience Curve Analysis PowerPoint Presentation
A two way linear curve has been used to design this PPT diagram. This business framework contains the concept of curve analysis and management. Use this PPT diagram for your business and management related topics.

Business Framework Bond Prices And Yields PowerPoint Presentation
This power point diagram slide has been crafted with graphic of statistics of bond price and yields. Display the dependency in-between these two fields with this innovative diagram slide. This slide is very useful for financial presentations.

Financial Growth Analysis Circular Chart Powerpoint Slides
Visually support your presentation with our above template containing graphics of circular chart. This diagram slide helps to display financial growth analysis. Etch your views in the brains of your audience with this diagram slide.
Hexagon With Six Business Icons Powerpoint Templates
Hexagonal layout with business icons has been displayed in this business slide. This business diagram helps to exhibit concepts of strategy, planning, communication, management and analysis. Use this diagram to build an exclusive presentation.
Hexagonal Layout With Business Icons Powerpoint Templates
Hexagonal layout with business icons has been displayed in this business slide. This business diagram helps to exhibit concepts of strategy, planning, communication, management and analysis. Use this diagram to build an exclusive presentation.
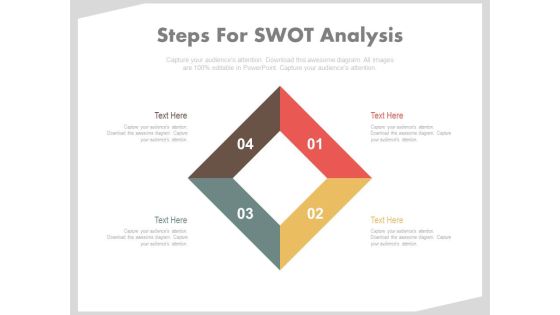
Diamond Design For Swot Analysis Powerpoint Slides
This PPT slide has been designed with graphics of four steps diamond diagram. This business diagram helps to exhibit SWOT analysis. Use this PowerPoint template to build an exclusive presentation.

Business Framework Technology Strategies For A Sustainable 1 PowerPoint Presentation
This business slide contains framework of technology strategies for a sustainable. It contains diagram of technology strategies depicting technology change for political, legal and national endowments. Download this diagram as a tool for business presentations.
Three Icons For Financial Reporting PowerPoint Template
Download this exclusive business diagram to present three steps of financial reporting This slide contains the graphic of three text circles with icons. This diagram can be useful for business presentations.
Man With Laptop And Icons Powerpoint Template
Graphic of man with laptop and icons has been used to design this power point template. This diagram contains the concept of computer technology and internet. Use this diagram to build a professional presentation.

Six Hexagons For Business Information Display Powerpoint Templates
Hexagonal layout with business icons has been displayed in this business slide. This business diagram helps to exhibit concepts of strategy, planning, communication, management and analysis. Use this diagram to build an exclusive presentation.

Business Reports On Laptop Powerpoint Template
This PPT slide has been designed with graphics of laptop on office table presenting statistical graph. This business diagram maybe used to exhibit management strategy. Use this diagram to build an exclusive presentation.
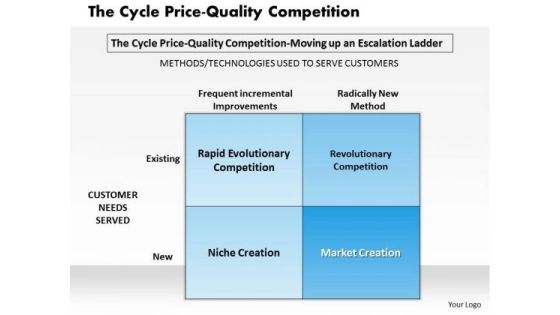
Business Framework The Cycle Price PowerPoint Presentation
This business slide displays framework of cycle price. It contains diagram of cycle price-quality competition depicting methods and technologies used to serve customers. Download this diagram as a tool for business presentations.
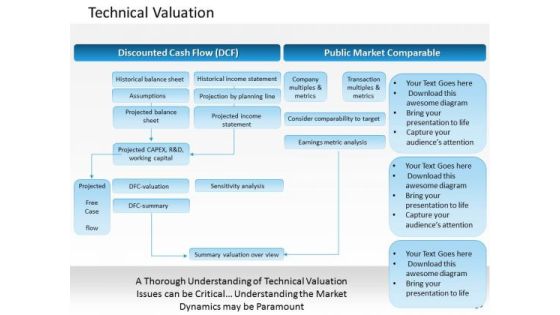
Business Framework Technical Valuation PowerPoint Presentation
This diagram displays framework of technical valuation. It contains flow-chart of discounted cash flow and public market. Use this diagram for thorough understanding of technical valuation issues and market dynamics.

DNA Design Infographics For Research Powerpoint Slides
This business slide contains four DNA infographic structure. This diagram is suitable to present business research and analysis. Visual effect of this diagram helps in maintaining the flow of the discussion and provides more clarity to the subject.
 Home
Home