Data Analysis Icon

Strategic Planning Decisions Diagram Powerpoint Presentation
This is a strategic planning decisions diagram powerpoint presentation. This is a eight stage process. The stages in this process are data sheet, references, pricing, social media, call guide, sales presentation, demo, website.

Busines Diagram 3d Pencil With Multicolor And Text Boxes Presentation Template
This business diagram displays four text boxes around a pencil. This professional slide can be used for data display in visual manner. Download this diagram for your school and education related presentations.
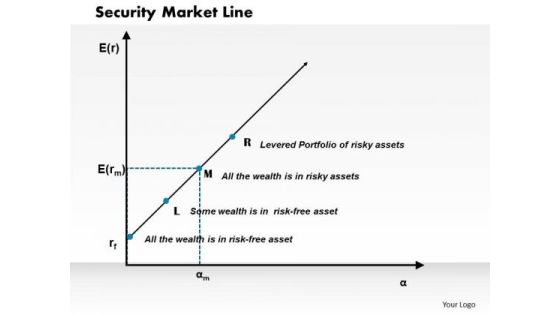
Business Framework Security Market Line PowerPoint Presentation
This diagram displays graph of security market line. You can use line graph to plot changes in data over time, such as monthly revenue and earnings changes or daily changes in stock market prices.
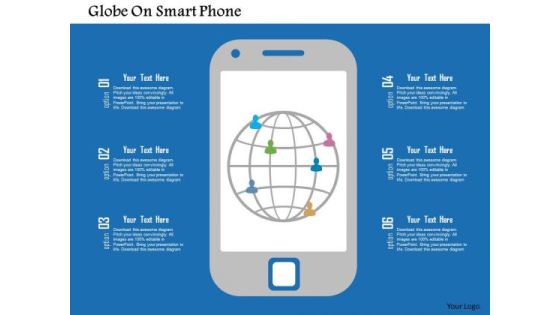
Business Diagram Globe On Smart Phone Presentation Template
Our above slide contains graphics of globe on smart phone. It helps to display GPS service on mobile phones Use this diagram to impart more clarity to data and to create more sound impact on viewers.

Diamond Design With Two Levels And Eight Stages Powerpoint Template
Our above slide contains graphics of diamond design with two levels and eight stages. It helps to display concepts in visual manner. Use this diagram to impart more clarity to data and to create more sound impact on viewers.

Cycle Of Cross Media Overview Diagram Ppt Slides
This is a cycle of cross media overview diagram ppt slides. This is a five stage process. The stages in this process are email, sms, mms text messaging, rich media, landing pages and micro sites, variable data print.
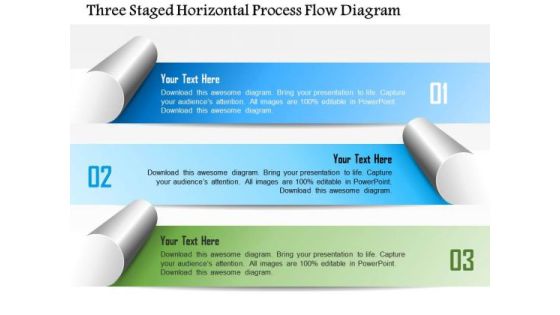
Business Diagram Three Staged Horizontal Process Flow Diagram Presentation Template
This business slide displays three staged horizontal process flow diagram. This diagram is useful for data display. Use this colorful diagram to depict three steps of any business process. It helps in clearly conveying your message to clients and audience.
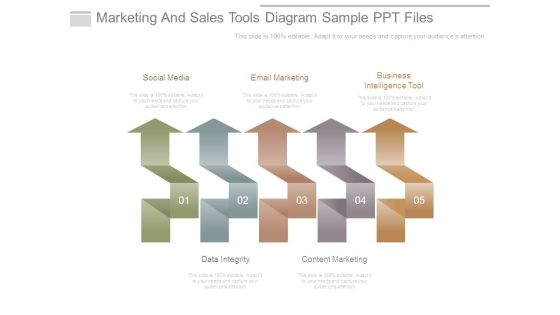
Marketing And Sales Tools Diagram Sample Ppt Files
This is a marketing and sales tools diagram sample ppt files. This is a five stage process. The stages in this process are social media, email marketing, business intelligence tool, data integrity, content marketing.

Circle Process Of Four Steps Powerpoint Templates
Our above slide contains graphics of bulb with success graph. It helps to exhibit planning for growth. Use this diagram to impart more clarity to data and to create more sound impact on viewers.

Business Diagram Red Umbrella Under The Magnifier For Search Presentation Template
Graphic of red umbrella and magnifier has been used to craft this PPT diagram. This PPT contains the concept of search. Use this PPT for data and business related presentations.
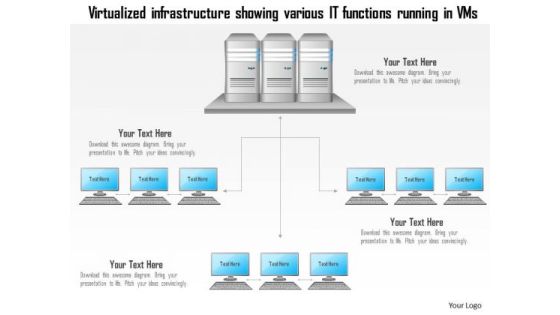
Business Diagram Virtualized Infrastructure Showing Various It Functions Running In Vms Ppt Slide
Graphic of data base server and VMS has been used to design this technology diagram. This slide contains the virtualized infrastructure for various functions. Use this diagram for technology related presentations.
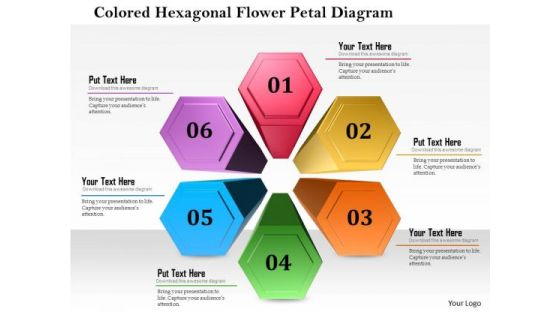
Business Diagram Colored Hexagon Flower Petal Diagram Presentation Template
This business diagram displays colored hexagon flower petal design. This Power Point slide can be used for data representation. Use this PPT slide to show flow of activities in circular manner. Get professional with this exclusive business slide.

Wealth Management Customer Journey Sample Diagram Ppt Images
This is a wealth management customer journey sample diagram ppt images. This is a five stage process. The stages in this process are data setup, model development, campaign launch, campaign execution and tracking, revenue realization.
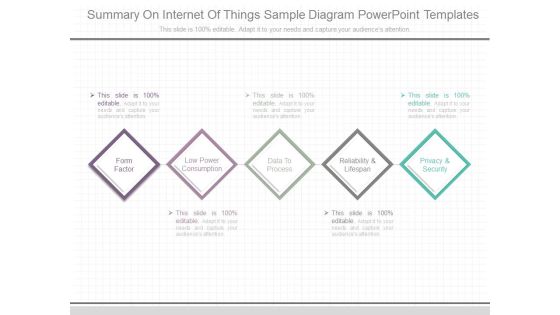
Summary On Internet Of Things Sample Diagram Powerpoint Templates
This is a summary on internet of things sample diagram powerpoint templates. This is a five stage process. The stages in this process are form factor, low power consumption, data to process, reliability and lifespan, privacy and security.
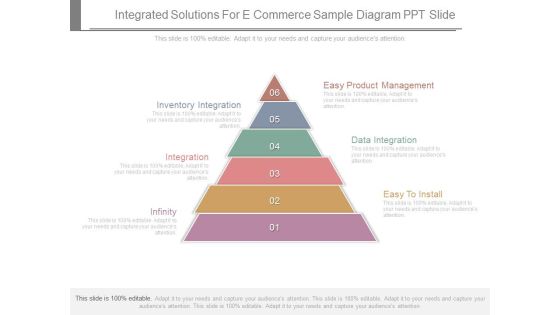
Integrated Solutions For E Commerce Sample Diagram Ppt Slide
This is a integrated solutions for e commerce sample diagram ppt slide. This is a six stage process. The stages in this process are inventory integration, integration, infinity, easy to install, data integration, easy product management.

Process Of Sales Account Management Diagram Powerpoint Templates Download
This is a process of sales account management diagram powerpoint templates download. This is a three stage process. The stages in this process are sales account management, customer prospect data acquisition, sales account assignment, sales account planning.
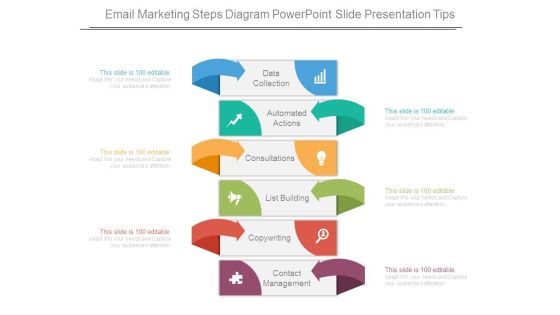
Email Marketing Steps Diagram Powerpoint Slide Presentation Tips
This is a email marketing steps diagram powerpoint slide presentation tips. This is a six stage process. The stages in this process are data collection, automated actions, consultations, list building, copywriting, contact management.
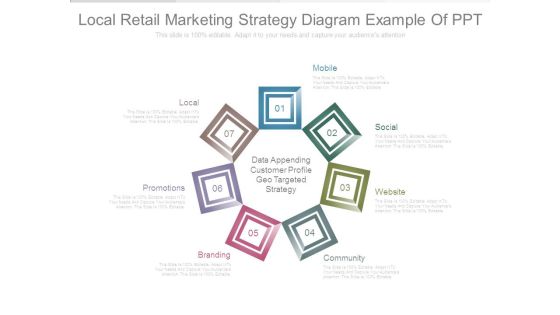
Local Retail Marketing Strategy Diagram Example Of Ppt
This is a local retail marketing strategy diagram example of ppt. This is a seven stage process. The stages in this process are local, promotions, branding, mobile, social, website, community, data appending customer profile geo targeted strategy.

Cia Triad Of Information Security In Information Availability Microsoft PDF
This slide represents CIA triad of information security in data availability such as confidentiality, integrity and availability for securing data from breach and thefts in an organization. Presenting cia triad of information security in information availability microsoft pdf to dispense important information. This template comprises three stages. It also presents valuable insights into the topics including confidentiality, integrity, availability. This is a completely customizable PowerPoint theme that can be put to use immediately. So, download it and address the topic impactfully.
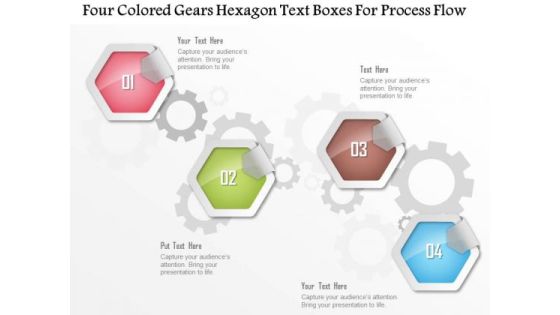
Business Diagram Four Colored Gears Hexagon Text Boxes For Process Flow Presentation Template
Four colored gears hexagon text boxes are used to design this power point template. This diagram contains hexagons for data representation. Use this diagram to display business process workflows in any presentation.

Sop Strategic Plan Ppt Diagram Powerpoint Templates Microsoft
This is a sop strategic plan ppt diagram powerpoint templates microsoft. This is a six stage process. The stages in this process are production, construction, supplier, gather data and analyze, demand and supply, demand planning.
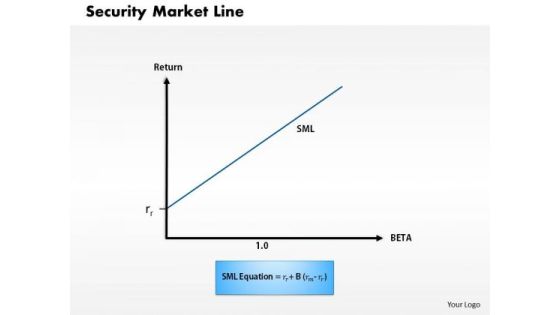
Business Framework Security Market Line 1 PowerPoint Presentation
This diagram displays graph of security market line. You can use line graph to plot changes in data over time, such as monthly revenue and earnings changes or daily changes in stock market prices.

Business Framework Security Market Line 11 PowerPoint Presentation
This diagram displays graph of security market line. You can use line graph to plot changes in data over time, such as monthly revenue and earnings changes or daily changes in stock market prices.

Business Men On Gears Towards Success Trophy Powerpoint Templates
Our above slide contains diagram of business men on gears towards success trophy. It helps to exhibit strategy process and competition. Use this diagram to impart more clarity to data and to create more sound impact on viewers.

Business Diagram Four Thermometer For Entrepreneurship Statistics Presentation Template
Graphic of thermometers have been used to design this business diagram. Thermometers can be used to display entrepreneurship statistics. Use this diagram your data and information related topics in any presentation.
Busines Diagram 3d Building Diagram With Four Text Boxes Presentation Template
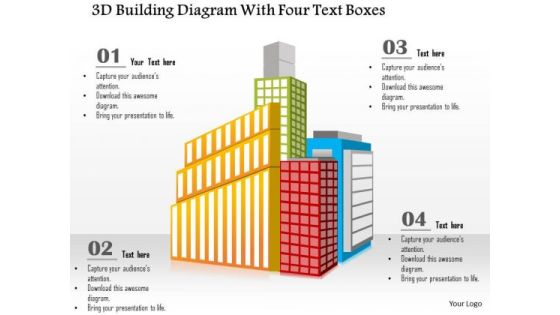
This business diagram has been designed with graphic of 3d building diagram and four text boxes. This business slide is useful for data representation. Use this diagram to make professional presentations.

Business Diagram Abstract Info Graphics 3 Steps Presentation Template
This slide displays info graphics three steps diagram. This info graphics template can be used for workflow layout. Simply add your data in this business diagram and create your own customized presentations.
Business Diagram Abstract Info Graphics 5 Steps Presentation Template
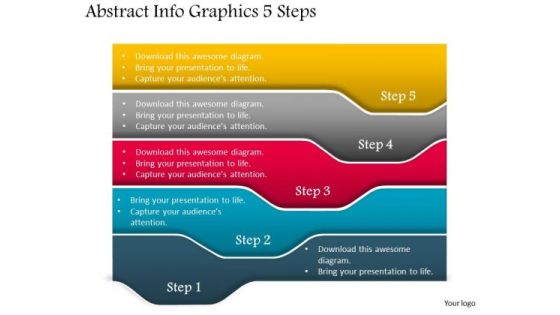
This slide displays info graphics five steps diagram. This info graphics template can be used for workflow layout. Simply add your data in this business diagram and create your own customized presentations.

Business Diagram Seven Staged Flower Petal Diagram For Text Representation Presentation Template
This business diagram displays seven staged flower petal diagram. This Power Point slide can be used for data representation. Use this PPT slide to show flow of activities in circular manner. Get professional with this exclusive business slide.
Business Diagram Six Staged Flower Petal Diagram For Text Representation Presentation Template
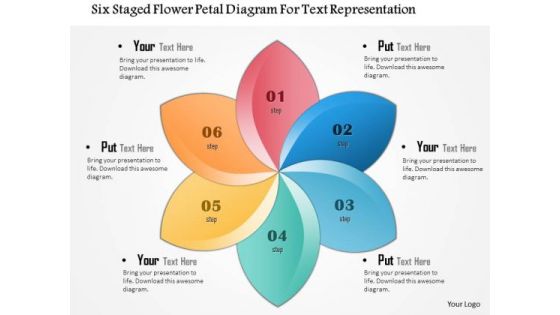
This business diagram displays six staged flower petal diagram. This Power Point slide can be used for data representation. Use this PPT slide to show flow of activities in circular manner. Get professional with this exclusive business slide.

Four Horizontal Text Banners Powerpoint Template
This PowerPoint template has been designed with four horizontal text banners. This diagram is excellent visual tools for business presentations. Download this PPT slide to explain complex data immediately and clearly.

Four Options Zigzag Infographics Powerpoint Template
Emphatically define your message with our above template which contains four options zigzag infographic. This business diagram may be used to plot data series. Deliver amazing presentations to mesmerize your audience.

Team Pictures With Names And Profile Powerpoint Slides
This PowerPoint template has been designed with team pictures and profile information. This diagram is excellent visual tools to present team profile. Download this PPT slide to explain complex data immediately and clearly.
Team Profiles For About Us Slide Powerpoint Slides
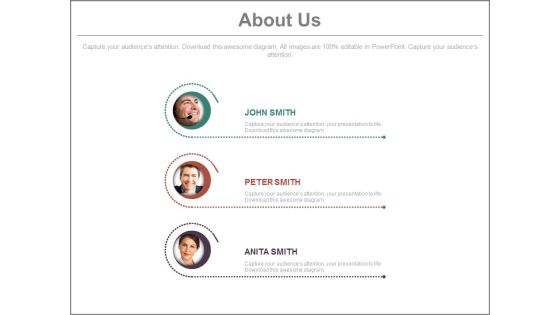
This PowerPoint template has been designed with team pictures and profile information. This diagram is excellent visual tools to present team profile. Download this PPT slide to explain complex data immediately and clearly.

Business People Profile For Social Media Powerpoint Slides
This PowerPoint template has been designed with business people profile information. This diagram is excellent visual tools to present team profile with social media. Download this PPT slide to explain complex data immediately and clearly.

Diamond Process Flow Infographic Diagram Powerpoint Template
Our above slide contains diamond process flow infographic diagram. This PowerPoint template helps to display six steps in linear flow. Use this diagram to impart more clarity to data and to create more sound impact on viewers.
Decision Support System Diagram Presentation Outline
This is a decision support system diagram presentation outline. This is a five stage process. The stages in this process are communication driven dss, data driven dss, document driven dss, knowledge driven dss, model driven dss.
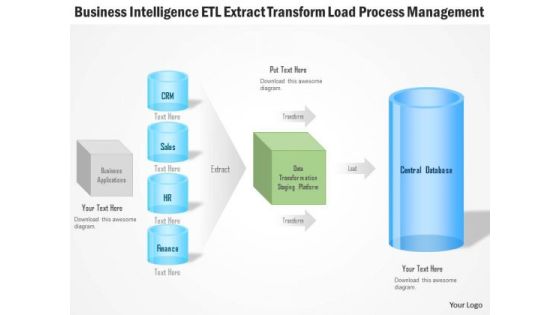
Business Diagram Business Intelligence Etl Extract Transform Load Process Management Ppt Slide
Explain the load process management and ETL extract transform with this unique PPT. This PPT contains the graphic of computer server and data base with connectivity. This PPT can be used for business intelligence related topics in any presentation.
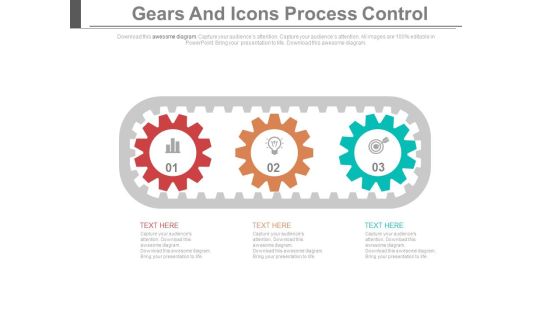
Three Gears Steps For Innovative Process Powerpoint Template
This PowerPoint slide contains graphics of three gears steps. It helps to exhibit innovative process steps. Use this diagram to impart more clarity to data and to create more sound impact on viewers.

Business Man On Road With Question Mark Powerpoint Template
Our above PPT slide contains road graphics with business man and question mark. It helps to exhibit finding possible solutions. Use this diagram to impart more clarity to data and to create more sound impact on viewers.

Business Diagram Six Staged Ribbon Style Text Boxes Presentation Template
Graphic of four staged diagram has been used to design this power point template slide. This PPT slide contains the data flow. This PPT slide can be used for business and marketing related presentations.
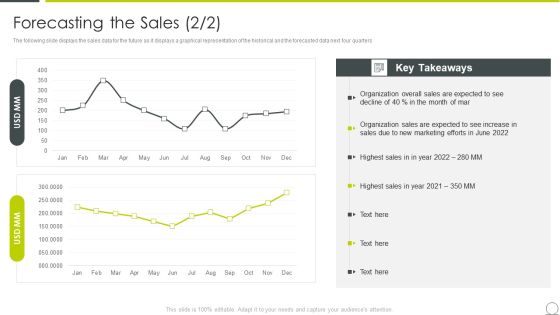
Examining Product Characteristics Brand Messaging Forecasting The Sales Marketing Ideas PDF
The following slide displays the sales data for the future as it displays a graphical representation of the historical and the forecasted data next four quarters Deliver and pitch your topic in the best possible manner with this examining product characteristics brand messaging forecasting the sales marketing ideas pdf. Use them to share invaluable insights on forecasting the sales and impress your audience. This template can be altered and modified as per your expectations. So, grab it now.
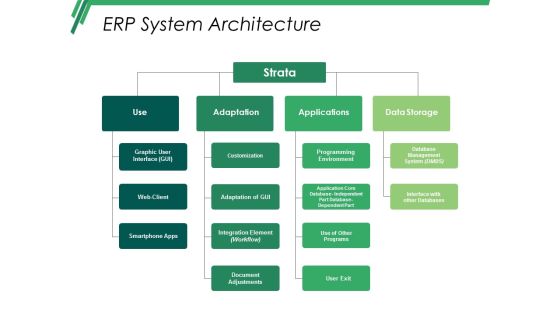
Erp System Architecture Ppt PowerPoint Presentation Pictures Master Slide
This is a erp system architecture ppt powerpoint presentation pictures master slide. This is a four stage process. The stages in this process are use, strata, adaptation, applications, data storage.

Arrows With Circles And Idea Bulb Powerpoint Template
Our above slide contains graphics of arrows with circles and idea bulb. It helps to display innovative ideas. Use this diagram to impart more clarity to data and to create more sound impact on viewers.

Graphical Representation Of Research IT Tableau As Visualization Research Tool Graphics PDF
This slide shows the tableau visualization research tool in which users can construct and share interactive and editable dashboards that represent data in charts. Deliver and pitch your topic in the best possible manner with this graphical representation of research it tableau as visualization research tool graphics pdf. Use them to share invaluable insights on process data, sources, sales, application and impress your audience. This template can be altered and modified as per your expectations. So, grab it now.
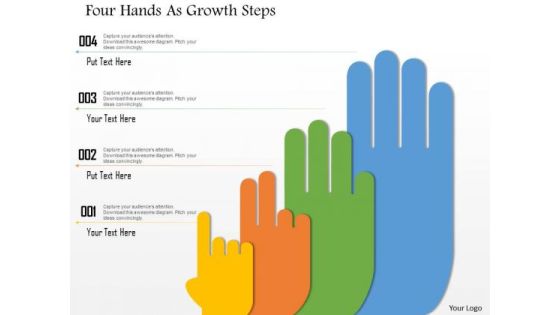
Business Diagram Four Hands As Growth Steps Presentation Template
This business diagram displays four staged hand process diagram. This professional diagram slide helps to display data and process flow. Use this slide for your business and marketing related presentations.
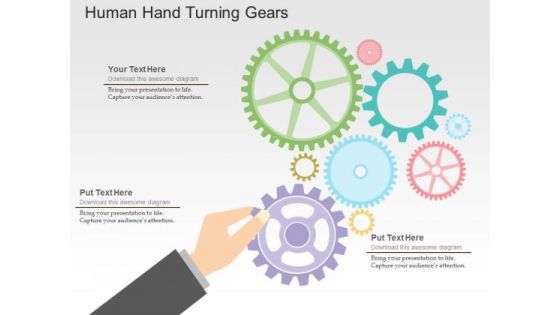
Human Hand Turning Gears PowerPoint Templates
Our above slide contains graphics of human hand turning gears. It helps to display concepts of process control and management. Use this diagram to impart more clarity to data and to create more sound impact on viewers.

Man Climbing On Books With Ladder PowerPoint Templates
Our above slide contains graphics of man climbing on books with help of ladder. It helps to display concept of education and success. Use this diagram to impart more clarity to data and to create more sound impact on viewers.

Donating Money To Charity Powerpoint Template
Our above slide contains ten staged colorful infographic. It helps to exhibit concepts of charity and donation. Use this diagram to impart more clarity to data and to create more sound impact on viewers.
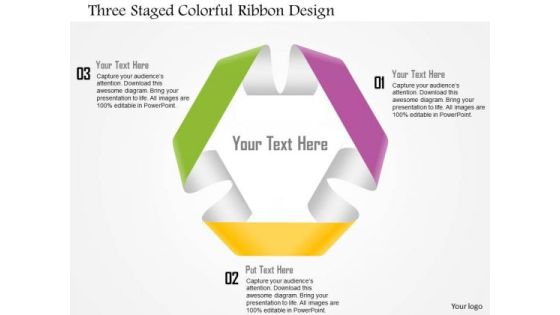
Business Diagram Three Staged Colorful Ribbon Design Presentation Template
This business diagram displays three staged circular ribbon. This Power Point slide can be used for data representation. Use this PPT slide to show flow of activities in circular manner. Get professional with this exclusive business slide.
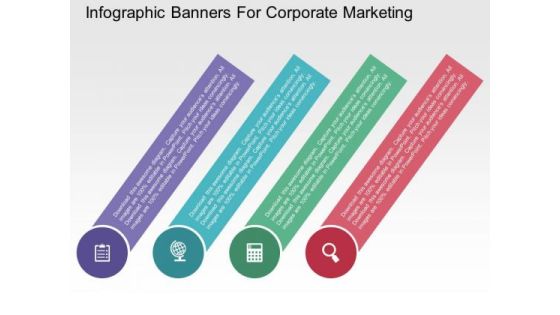
Infographic Banners For Corporate Marketing PowerPoint Templates
Our above PPT slide contains diagram of infographic banners. It helps to display steps of corporate marketing. Use this diagram to impart more clarity to data and to create more sound impact on viewers.

Best Practices For Progress Summary Creation Ideas PDF
Following slide showcases best practices for creating progress report which help to manage projects and secure businesses. It presents information related to data usage, transparency, etc. Presenting Best Practices For Progress Summary Creation Ideas PDF to dispense important information. This template comprises six stages. It also presents valuable insights into the topics including Use Data, Be Transparent, Include Company Department Goals. This is a completely customizable PowerPoint theme that can be put to use immediately. So, download it and address the topic impactfully.
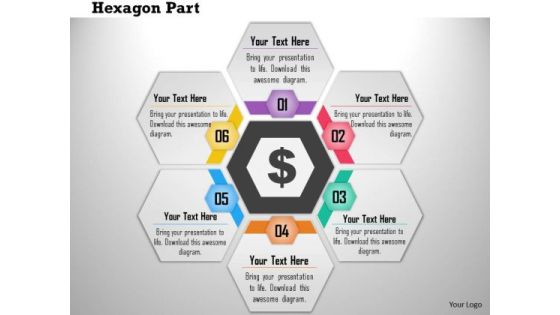
Business Diagram Six Hexagon Text Boxes In Cyclic Order Presentation Template
This PowerPoint template has been designed with graphic of six hexagon text boxes in cyclic order. This diagram can be used to depict data flow. Use this diagram to build exclusive presentation for your viewers.

Choosing An Area Of Research Powerpoint Slides
This is a choosing an area of research powerpoint slides. This is a five stage process. The stages in this process are choosing an area of research, choosing method of data collection, review of studies, sources of feedback, complete proposal.

Colorful Circle Arrow Design Powerpoint Template
Our above PPT slide contains circular arrow design. This business diagram helps to exhibit process flow. Use this diagram to impart more clarity to data and to create more sound impact on viewers.
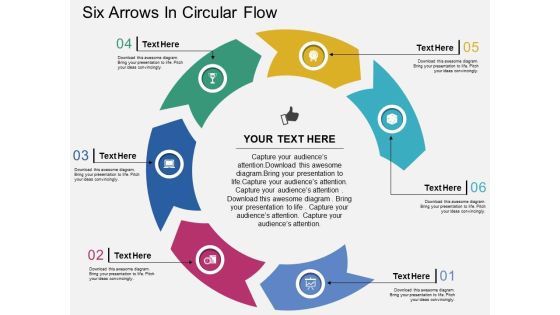
Six Arrows In Circular Flow Powerpoint Templates
Our above PPT slide contains graphics of circular diagram. This business diagram helps to display outline of business plan. Use this template to impart more clarity to data and to create more sound impact on viewers.
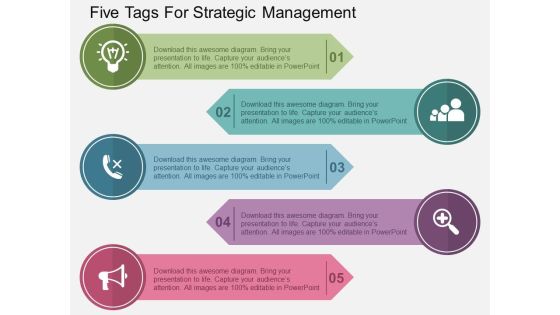
Five Tags For Strategic Management Powerpoint Templates
Our above slide contains diagram of circular infographic. It helps to exhibit six steps of goal planning. Use this diagram to impart more clarity to data and to create more sound impact on viewers.
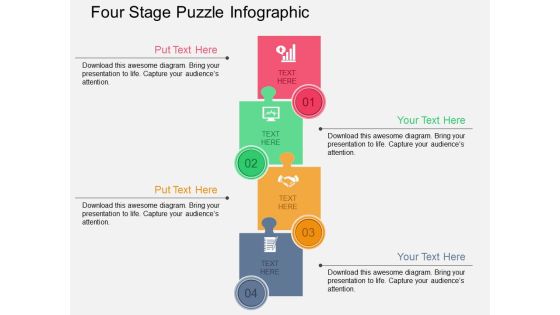
Four Stage Puzzle Infographic Powerpoint Templates
Our above slide contains diagram of puzzles infographic. It helps to exhibit business management and strategies. Use this diagram to impart more clarity to data and to create more sound impact on viewers.
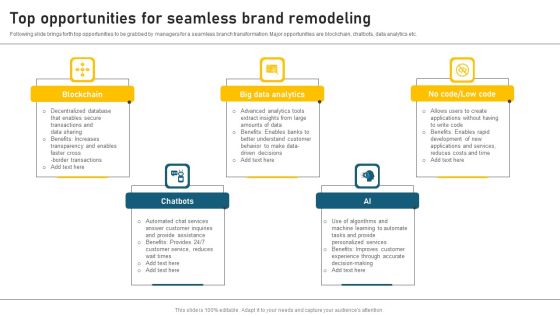
Top Opportunities For Seamless Brand Remodeling Summary PDF
Following slide brings forth top opportunities to be grabbed by managers for a seamless branch transformation. Major opportunities are blockchain, chatbots, data analytics etc. Presenting Top Opportunities For Seamless Brand Remodeling Summary PDF to dispense important information. This template comprises Five stages. It also presents valuable insights into the topics including Blockchain, Big Data Analytics, Chatbots. This is a completely customizable PowerPoint theme that can be put to use immediately. So, download it and address the topic impactfully.

Business Intelligence To Overcome Marketing Analytics Challenges Mockup PDF
The following slide presents various solutions given by business intelligence to overcome marketing analytics challenges. The challenges related to information, filtration, data, interpretation, security and campaign testing. Presenting Business Intelligence To Overcome Marketing Analytics Challenges Mockup PDF to dispense important information. This template comprises four stages. It also presents valuable insights into the topics including Information Filtration, Data Interpretation, Security. This is a completely customizable PowerPoint theme that can be put to use immediately. So, download it and address the topic impactfully.


 Continue with Email

 Home
Home


